4850
Gadolinium contrast-enhanced lesion segmentation in multiple sclerosis: a deep-learning approach.1Translational Imaging in Neurology (ThINk) Basel, Department of Biomedical Engineering, Faculty of Medicine, University Hospital Basel and University of Basel, Basel, Switzerland, 2Department of Neurology, University Hospital Basel, Basel, Switzerland, 3Research Center for Clinical Neuroimmunology and Neuroscience Basel (RC2NB), University Hospital Basel and University of Basel, Basel, Switzerland, 4Department of Health Sciences, University of Genova, Genova, Italy, 5Division of Radiological Physics, Department of Radiology, University Hospital Basel, Basel, Switzerland, 6Medical Image Analysis Center (MIAC), Basel, Switzerland, 7Clinical Trial Unit, Department of Clinical Research, University Hospital Basel, University of Basel, Basel, Switzerland, 8Department of Neurology, Cantonal Hospital St. Gallen, St. Gallen, Switzerland, 9Department of Neurology, Cantonal Hospital Aarau, Aarau, Switzerland, 10Neurology Department, Neurocenter of Southern Switzerland, Lugano, Switzerland, 11Department of Neurology, Inselspital, Bern University Hospital and University of Bern, Bern, Switzerland, 12Department of Neurology, St. Josef-Hospital, Ruhr-University Bochum, Bochum, Germany, 13Service of Neurology, Department of Clinical Neurosciences, Lausanne University Hospital (CHUV) and University of Lausanne, Lausanne, Switzerland, 14Department of Clinical Neurosciences, Division of Neurology, Geneva University Hospitals and Faculty of Medicine, Geneva, Switzerland, 15Faculty of biomedical Sciences, Università della Svizzera Italiana, Lugano, Switzerland, 16Division of Diagnostic and Interventional Neuroradiology, Clinic for Radiology and Nuclear Medicine, University Hospital Basel, Basel, Switzerland, 17Department of Radiology, Cantonal Hospital Aarau, Aarau, Switzerland, 18Department of Diagnostic and Interventional Neuroradiology, Inselspital, Bern University Hospital and University of Bern, Bern, Switzerland, 19Department of Radiology, Geneva University Hospital and Faculty of Medicine, Geneva, Switzerland, 20Department of Neuroradiology, Neurocenter of Southern Switzerland, Lugano, Switzerland, 21Department of Radiology, Cantonal Hospital St. Gallen, St. Gallen, Switzerland
Synopsis
Keywords: Diagnosis/Prediction, Segmentation
Motivation: Detection of contrast-enhanced lesions (CELs) is fundamental for the diagnosis and monitoring of Multiple Sclerosis (MS) patients. This task is time-consuming and variable in the clinical setting. However, only a few studies reported automatic approaches.
Goal(s): To develop a deep-learning tool to automatically detect and segment CELs in clinical MRI scans from MS patients.
Approach: We implemented a UNet-based network with an adapted sampling strategy to overcome the scarcity of CELs. We considered the data imbalance to weight the training loss function.
Results: The model performance was evaluated for different lesion-volume ranges and achieved high performance even in low-volume lesions.
Impact: We developed a deep-learning method fulfilling clinical needs in detecting and segmenting lesions characterized by low volume, low numbers per patient and heterogeneous shapes.
Introduction
Multiple sclerosis is characterized by inflammatory and demyelinating lesions in the Central Nervous System1.Focal inflammation with breakdown of the blood-brain barrier leads to gadolinium extravasation in the parenchyma after contrast injection, highlighting contrast-enhanced lesions (CEL)2.The detection of CELs is fundamental for the diagnosis and monitoring of MS3,4.
The main challenges for CEL identification and segmentation are the low frequency, heterogeneous shape and often low volume of CELs5. Manual detection of CELs is highly time-consuming. For this reason, an automatic tool can be useful and reduce the variability of the results in clinical practice. Moreover, in literature, only a few methods performed this task. This work aims to develop a deep learning tool to detect and segment especially low-volume and sparse lesions in MRI images.
Methods
The dataset was obtained by 1.5 and 3 T MRI systems in 7 centres belonging to the SMSC6.The MRI acquisitions and their respective TR [ms], TI [ms] and slice thickness [mm] ranges are: T1-weighted (T1w) MPRAGE ([1720-2700]; [900-110];[1-1.2]), T1w-MPRAGE with gadolinium contrast agent([30-2700]; [0-1100];[1-3])and FLuid Attenuated Inversion Recovery (FLAIR) ([5000-7500]; [1600-3000];[1-1.3]).
Furthermore, the automatically segmented white matter lesion (WML) and ground truth masks are manually corrected and segmented by expert neurologists and radiologists.
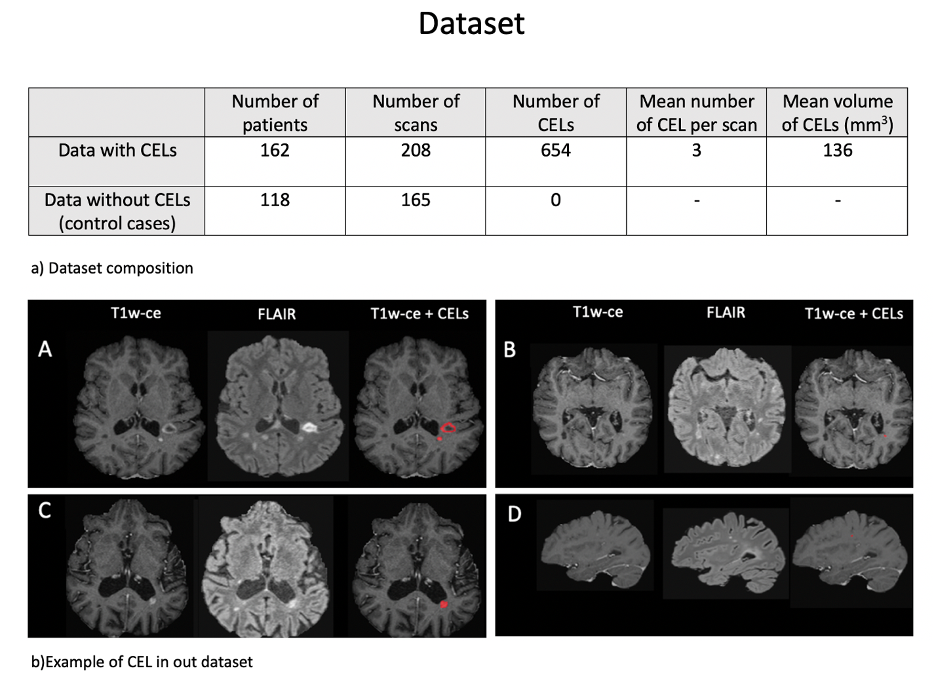
The dataset included 373 scans from 280 patients, divided into scans with CELs and without CELs (Figure 1). These scans are introduced to mimic the real clinical situation, which shows a high percentage of MRI scans without CELs7.
62 patients had multiple visits, considered independently and included in the same dataset for training, validation or testing.
The images of the same acquisition were co-registered and skull-stripped using FSL8 and HD-BET9, respectively.
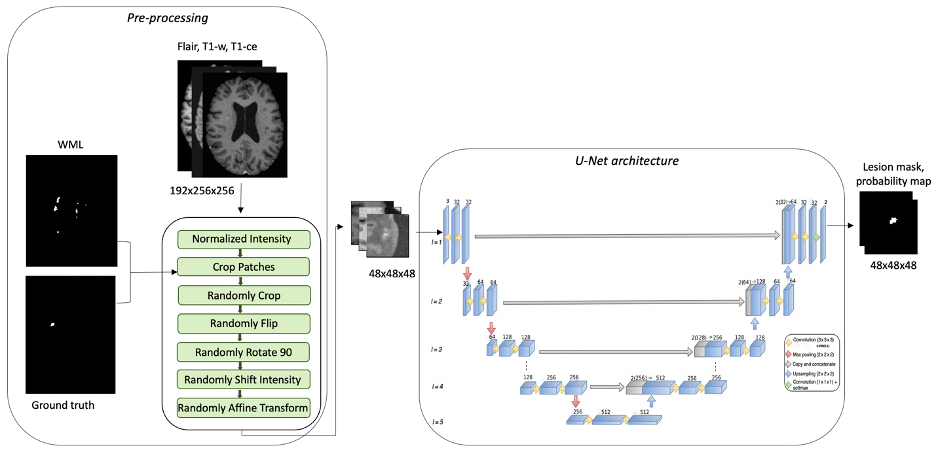
A 3D patch-based UNet-based network for cortical lesions10, was expanded with two more convolutional layers of 256 and 512 filters, respectively.
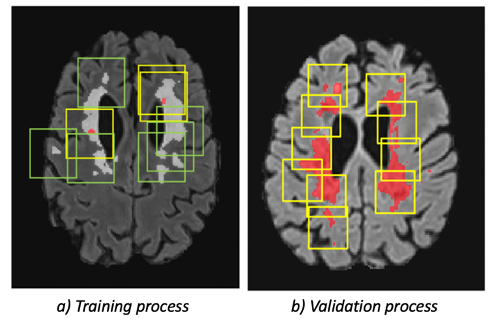
Patches were sampled on the WMLs, indeed during the training process, the ratio of the CEL patches (positive patches) over WML patches (negative patches) was 1/3. In control patients, instead, all the patches were cropped in WML.
In the validation process, the sliding window inference was replaced by the sample of WML. Consequently, the validation strategy is similar to the training one, and all the possible regions in which CELs can be present are given as input to the model (Figure 2).
The further implementation takes into account the loss function.
The starting loss function11 was:
$$$Loss_{function}=0.5*Loss_{Dice}+Loss_{focal}$$$
However, the dataset is unbalanced and the number of negative patches is higher than the positive ones $$$(rate_{unbalance}=2/9)$$$. Moreover, the Dice loss in negative patches is usually 1 if the number of False Positive (FP) voxels is nonzero. As a consequence, the learning process gives low importance to the $$$Loss_{Dice_{positive}}$$$ decrease but concentrates more on lowering $$$Loss_{Dice_{negative}}$$$. Therefore, we defined a new loss function to reduce the weight of $$$Loss_{Dice_{negative}}$$$ multiplying it with the rate of patches unbalance: $$$Loss_{function}=mean(rate_{unbalance}*Loss_{Dice_{negative}}+Loss_{Dice_{positive}})+mean(Loss_{focal_{negative}}+Loss_{focal_{positive}})$$$
The dataset was randomly subdivided into 11 groups. A group was randomly chosen as the testing dataset. The rest of the groups formed 10-fold cross-validation. An example of the training pipeline is in Figure 3.The Dice Score Coefficient (DSC) was calculated in patches and whole images during the validation process.
The output of the model was filtered removing the prediction outside the WML mask. Consequently, 3 FP were deleted.
Results
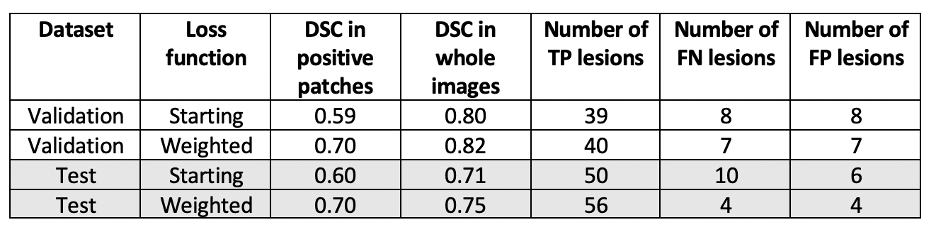
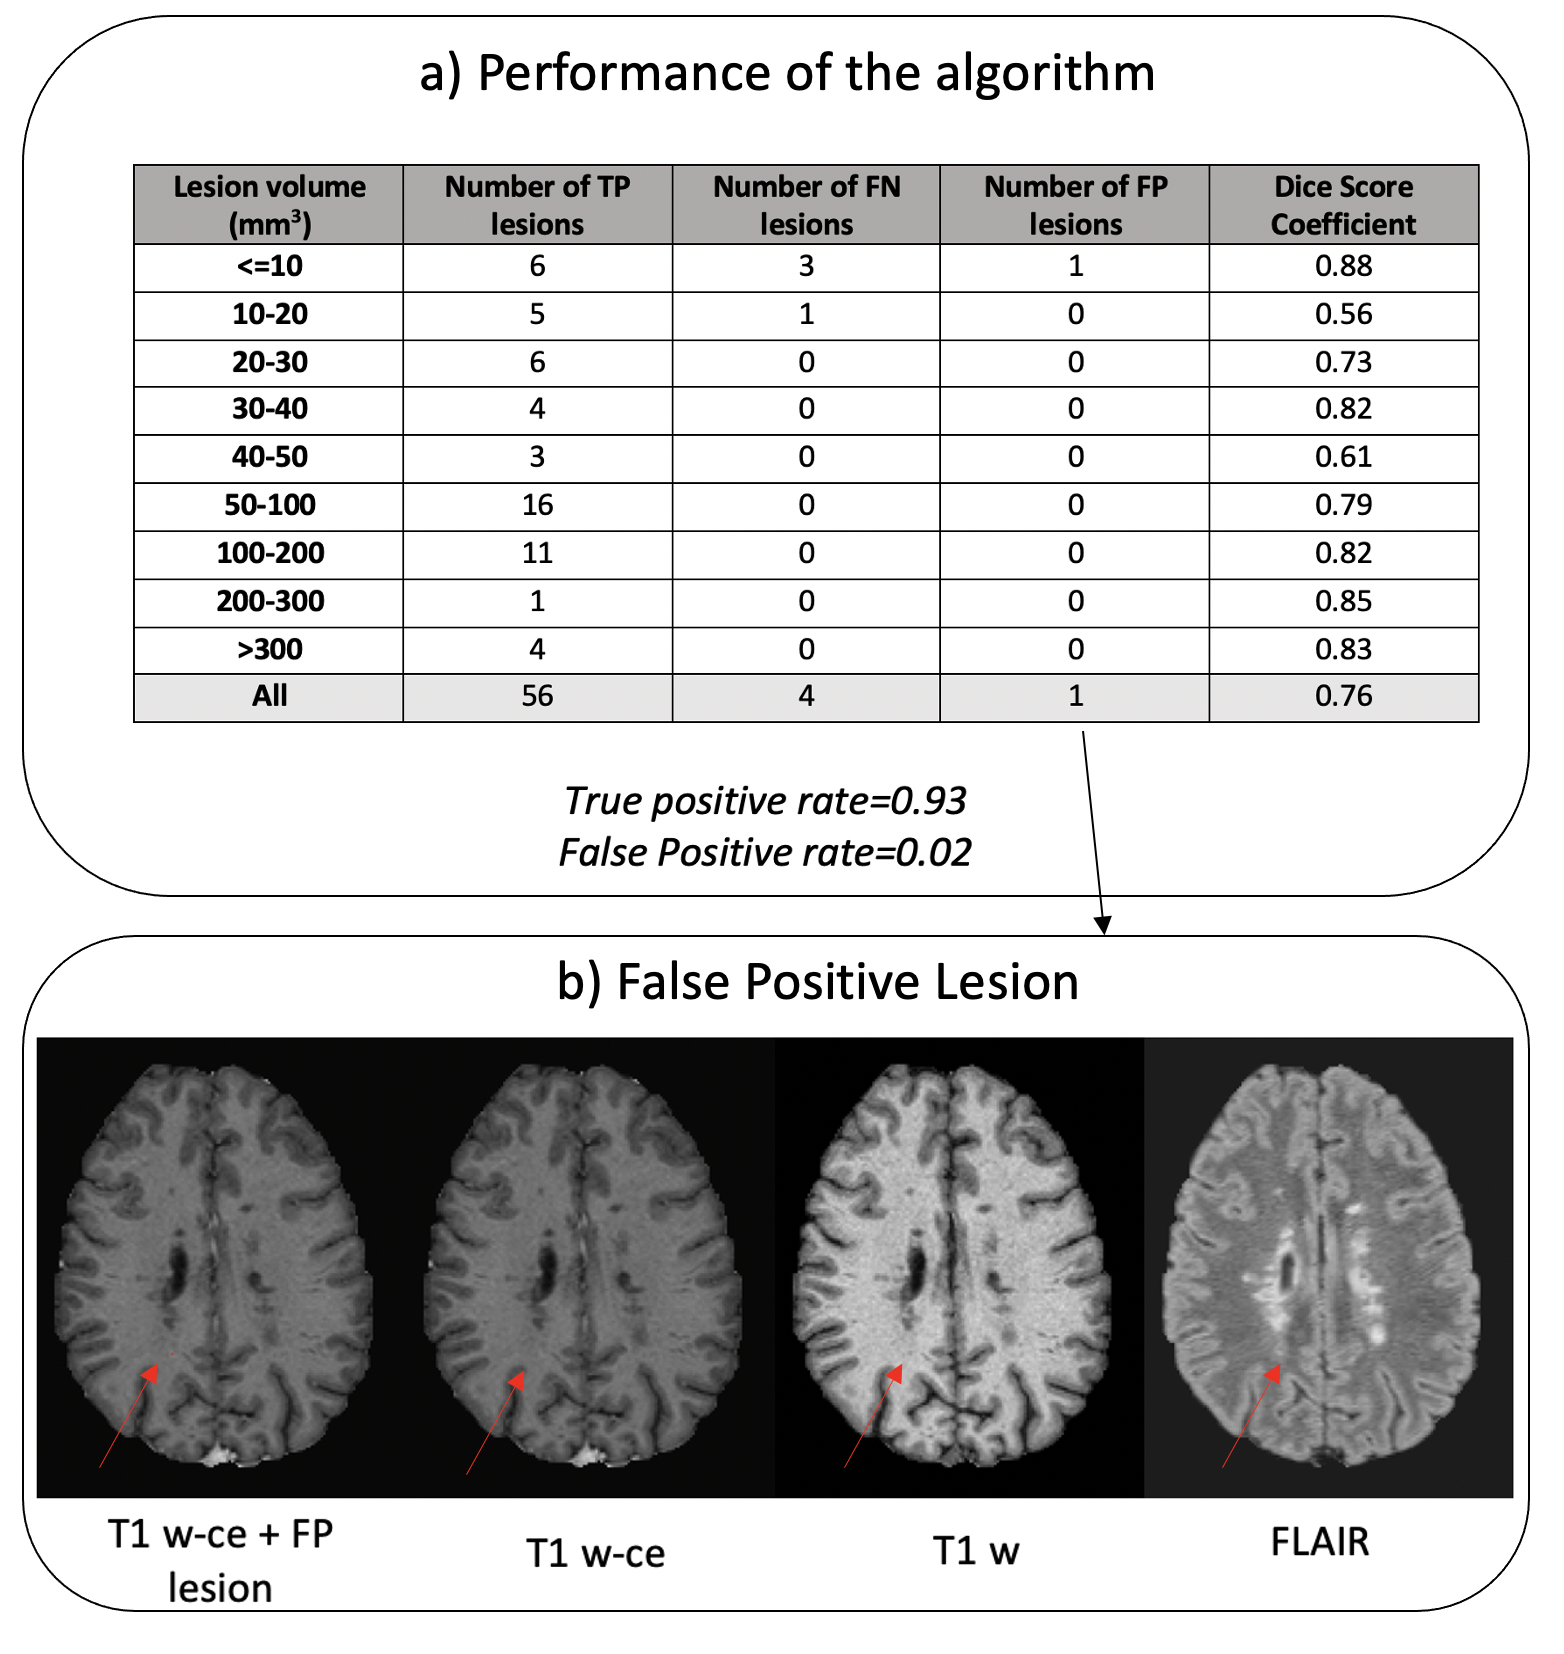
The weighted loss function increased the weights of $$$Loss_{Dice_{positive}}$$$,thereby leading to a DSC improvement in positive patches. Furthermore, it improved the segmentation and detection performance both in the validation and test datasets. (Figure 4)The model reached over the whole images a DSC of 0.76, a True Positive (TP) rate of 0.93, and an FP rate of 0.02. The wrong detections were localized on low-volume lesion (Figure 5). Regarding the segmentation in these groups, the DSC reached values similar to the ones in other volume ranges.
Discussion
The sampling strategy was fundamental in decreasing the FP prediction and achieving a stable DSC and loss function during the training process. Furthermore, the weighted loss function permits high performance in validation and test datasets.Conclusion
The strategies implemented in our UNet-based network permit the detection and segmentation of low-volume and sparse lesions in MRI images.As a future step, we need to consider the application of the tool in a large dataset, to achieve generalizable results and aim at further reducing the number of FN lesions.
Another possible future improvement might be the achievement of a similar accuracy without the need of a WML mask as an input, which relies on its segmentation accuracy.
Acknowledgements
No acknowledgement found.References
1. Lassmann, Hans. "Multiple sclerosis pathology." Cold Spring Harbor perspectives in medicine 8.3 (2018).
2. MILLER, D. H.; BARKHOF, F.; NAUTA, J. J. P. Gadolinium enhancement increases the sensitivity of MRI in detecting disease activity in multiple sclerosis. Brain, 1993, 116.5: 1077-1094.
3. GRANZIERA, Cristina; REICH, Daniel S. Gadolinium should always be used to assess disease activity in MS–Yes. Multiple Sclerosis Journal, 2020, 26.7: 765-766.
4. WATTJES, Mike P., et al. 2021 MAGNIMS–CMSC–NAIMS consensus recommendations on the use of MRI in patients with multiple sclerosis. The Lancet Neurology, 2021, 20.8: 653-670.
5. FILIPPI, Massimo, et al. Assessment of lesions on magnetic resonance imaging in multiple sclerosis: practical guidelines. Brain, 2019, 142.7: 1858-1875.
6. Disanto, Giulio, et al. "The Swiss Multiple Sclerosis Cohort-Study (SMSC): a prospective Swiss wide investigation of key phases in disease evolution and new treatment options." PloS one 11.3 (2016): e0152347.
7. KHALEELI, Z., et al. Lesion enhancement diminishes with time in primary progressive multiple sclerosis. Multiple Sclerosis Journal, 2010, 16.3: 317-324.
8.JENKINSON, Mark, et al. Fsl. Neuroimage, 2012, 62.2: 782-790.
9. ISENSEE, Fabian, et al. Automated brain extraction of multisequence MRI using artificial neural networks. Human brain mapping, 2019, 40.17: 4952-4964.
10. LA ROSA, Francesco, et al. Multiple sclerosis cortical and WM lesion segmentation at 3T MRI: a deep learning method based on FLAIR and MP2RAGE. NeuroImage: Clinical, 2020, 27: 102335.
11. LA ROSA, Francesco, et al. Multiple sclerosis cortical lesion detection with deep learning at ultra‐high‐field MRI. NMR in Biomedicine, 2022, 35.8: e4730.
Figures