4846
A Convolutional Neural Network Approach to Personalized Neuropil Density Prediction1Biomedical Engineering, Yale University, New Haven, CT, United States
Synopsis
Keywords: Diagnosis/Prediction, Diffusion/other diffusion imaging techniques, Brain, gray matter, white matter
Motivation: Bottom-up energy budgets provide a way to quantify electrical activity in the brain using metabolic imaging. However, existing models are not patient-specific, instead using generalized neural cell counts, preventing direct measures of cognitive activity in the brain.
Goal(s): Our goal was to use a convolutional neural network (CNN) to demonstrate the possibility of predicting individualized neural cell counts.
Approach: Multi-modal MRI from nine patients was used to model neural and synaptic density predictions, which were compared to silver standard counts using correlation coefficient in a cross-validation study.
Results: The model demonstrates an ability to predict patient-specific energy budgets.
Impact: The success of machine learning methods in predicting neural cell and synaptic density paves the way for the use of CNNs to generate patient-specific energy budgets, improving understanding of brain energetics at a microscopic level in health and disease.
Introduction
Bottom-up energy budgets use metabolic imaging to extract information about brain activity at the microscopic level1,2, providing insights into the infrastructure necessary for healthy brain function current imaging techniques fail to capture3-5. Energy budget models require a fundamental level of understanding of cellular and synaptic densities. Current energy budget models use generalized cell density counts without regard for how these vary across patients and brain regions. We challenge this norm by developing a convolutional neural network (CNN) capable of predicting individualized neuropil densities in the brain.Methods
To reflect differences between gray and white matter tissue, we used T1-weighted MPRAGE. We used DWI with ADC and FA to provide tissue cellularity and axon directionality information. Images were gathered from the Alzheimer’s Disease Neuroimaging Initiative (ADNI)6, filtering for cognitively healthy subjects scanned using the ADNI 3 protocol on Siemens 3T scanners. Where multiple DWI scans were available, we chose the earliest scans, and we chose T1 scans acquired closest to the DWI. Images were affine registered to MNI space and resized to 3 mm isotropic spacing using SPM. Using FSL, we stripped the skull from MPRAGE images and created subject-specific brain masks (Figure 1).Silver standard cell density (CellDen) data was obtained from the BigBrain dataset7. Synaptic density (SynDen) data was obtained by averaging parametric images of volume of distribution (VT) from PET images of the synaptic vesicle glycoprotein 2A (SV2A) radioligand [11C]UCB-J across 30 healthy subjects8.
The CellDen and SynDen maps were each further co-registered to each subject’s MPRAGE to mimic more individualized cell and synapse counts. Raw MRI data from BigBrain was resampled from 0.4 to 1 mm isotropic and affine registered to MNI space. The resulting image was then nonlinearly coregistered9 to each stripped MPRAGE image to create subject-specific CellDen template images. The SynDen template map was similarly coregistered to each individual stripped MPRAGE.
We used a U-Net CNN architecture with kernel size of 5x5x5 and channel sizes of 16,32,64,64 to predict CellDen and SynDen separately, using a concatenation of binary brain mask, MPRAGE, FA, and ADC images as inputs. We performed ablation studies without the mask input and tested a model that predicted SynDen and CellDen together (DualDen). We used leave-one-out training and tested the model on each subject. We used Earth Mover’s Distance (EMD) to evaluate histogram similarity between model predictions and silver standard.
Results
Across nine subjects, we found individual CellDen and SynDen model predictions have a higher average correlation coefficient with the silver standard templates than the DualDen model (Figure 2). The models with reregistered templates had lower average correlation coefficients, with histograms of the resulting predictions demonstrating higher EMD. The model performs better on gray than white matter (Figure 3).Discussion
We found that the rigorous coregistration of the neural and synaptic density silver standards to each patient yielded a lower average correlation between prediction and silver standard, as well as a higher EMD. This is closer to our ideal, as the model should be adept at predicting individuality among patients. From a qualitative standpoint, the predictions after coregistration compared to the original silver standards without coregistration are more personalized to each subject, a good indication that the model is not overfitting (Figures 4 and 5).When predicting both cell and synaptic density together, the shape of the prediction histogram is highly skewed toward the shape of the SynDen predictions. This, combined with higher average correlation values for SynDen predictions when compared to our silver standard than those for CellDen, indicates that synaptic density is easier for the model to predict. This may be due to the simpler nature of the relationship between synapses, which are distinct in gray and white matter, or the fact that the SynDen silver standard was composed of a group average as opposed to a single patient like the CellDen silver standard was, providing a more representative dataset.
The size of the training dataset was limited by the number of subjects used. In addition, the silver standard templates we used were not true reflections of each patient’s neural and synaptic density. Since the synaptic and cell density templates did not come from the same patient or even patients of the same age range, the data fails to truly represent potential relationships between neural cell and synaptic density.
Conclusion
We present a machine learning approach to predicting neural cell and synaptic density using individually-registered template images. Our model can create individualized energy budget maps of subject brains, paving the way for improved brain disease modeling.Acknowledgements
Data collection and sharing for this project was funded by the Alzheimer's Disease Neuroimaging Initiative (ADNI) (National Institutes of Health Grant U01 AG024904) and DOD ADNI (Department of Defense award number W81XWH-12-2-0012). ADNI is funded by the National Institute on Aging, the National Institute of Biomedical Imaging and Bioengineering, and through generous contributions from the following: AbbVie, Alzheimer’s Association; Alzheimer’s Drug Discovery Foundation; Araclon Biotech; BioClinica, Inc.; Biogen; Bristol-Myers Squibb Company; CereSpir, Inc.; Cogstate; Eisai Inc.; Elan Pharmaceuticals, Inc.; Eli Lilly and Company; EuroImmun; F. Hoffmann-La Roche Ltd and its affiliated company Genentech, Inc.; Fujirebio; GE Healthcare; IXICO Ltd.; Janssen Alzheimer Immunotherapy Research & Development, LLC.; Johnson & Johnson Pharmaceutical Research & Development LLC.; Lumosity; Lundbeck; Merck & Co., Inc.; Meso Scale Diagnostics, LLC.; NeuroRx Research; Neurotrack Technologies; Novartis Pharmaceuticals Corporation; Pfizer Inc.; Piramal Imaging; Servier; Takeda Pharmaceutical Company; and Transition Therapeutics. The Canadian Institutes of Health Research is providing funds to support ADNI clinical sites in Canada. Private sector contributions are facilitated by the Foundation for the National Institutes of Health (www.fnih.org). The grantee organization is the Northern California Institute for Research and Education, and the study is coordinated by the Alzheimer’s Therapeutic Research Institute at the University of Southern California. ADNI data are disseminated by the Laboratory for Neuro Imaging at the University of Southern California.
FH is the founder of InnovaCyclics LLC. All other authors declare no conflict of interest.
References
1. Yu Y, Herman P, Rothman DL, Agarwal D, Hyder F. 2018. Evaluating the gray and white matter energy budgets of human brain function. J Cereb Blood Flow Metab. 38:1339-1353.
2. Attwell D, Laughlin SB. 2001. An energy budget for signaling in the grey matter of the brain. J Cereb Blood Flow Metab. 21:1133-1145.
3. Ferree TC, Luu P, Russell GS, Tucker DM. 2001. Scalp electrode impedance, infection risk, and EEG data quality. Clin Neurophysiol. 112:536-544.
4. Wendel K, Vaisanen O, Malmivuo J, Gencer NG, Vanrumste B, Durka P, Magjarevic R, Supek S, Pascu ML, Fontenelle H, Grave de Peralta Menendez R. 2009. EEG/MEG source imaging: methods, challenges, and open issues. Comput Intell Neurosci.656092.
5. Kirschstein T, Kohling R. 2009. What is the source of the EEG? Clin EEG Neurosci. 40:146-149.
6. Petersen RC, Aisen PS, Beckett LA, Donohue MC, Gamst AC, Harvey DJ, Jack CR Jr, Jagust WJ, Shaw LM, Toga AW, Trojanowski JQ, Weiner MW. Alzheimer's Disease Neuroimaging Initiative (ADNI): clinical characterization. Neurology. 2010 Jan 19;74(3):201-9.
7. Amunts K, Lepage C, Borgeat L, Mohlberg H, Dickscheid T, Rousseau ME, Bludau S, Bazin PL, Lewis LB, Oros-Peusquens AM, Shah NJ, Lippert T, Zilles K, Evans AC. 2013. BigBrain: an ultrahigh-resolution 3D human brain model. Science. 340:1472-1475.
8. Finnema SJ, Nabulsi NB, Mercier J, Lin SF, Chen MK, Matuskey D, Gallezot JD, Henry S, Hannestad J, Huang YY, Carson RE. 2018. Kinetic evaluation and test-retest reproducibility of [C-11]UCB-J, a novel radioligand for positron emission tomography imaging of synaptic vesicle glycoprotein 2A in humans. J Cerebr Blood F Met. 38:2041-2052.
9. D. Rueckert, L. I. Sonoda, C. Hayes, D. L. G. Hill, M. O. Leach, and D. J. Hawkes, “Nonrigid registration using free-form deformations: application to breast MR images,” IEEE Trans. Med. Imaging, vol. 18, no. 8, pp. 712–721, 1999.
Figures
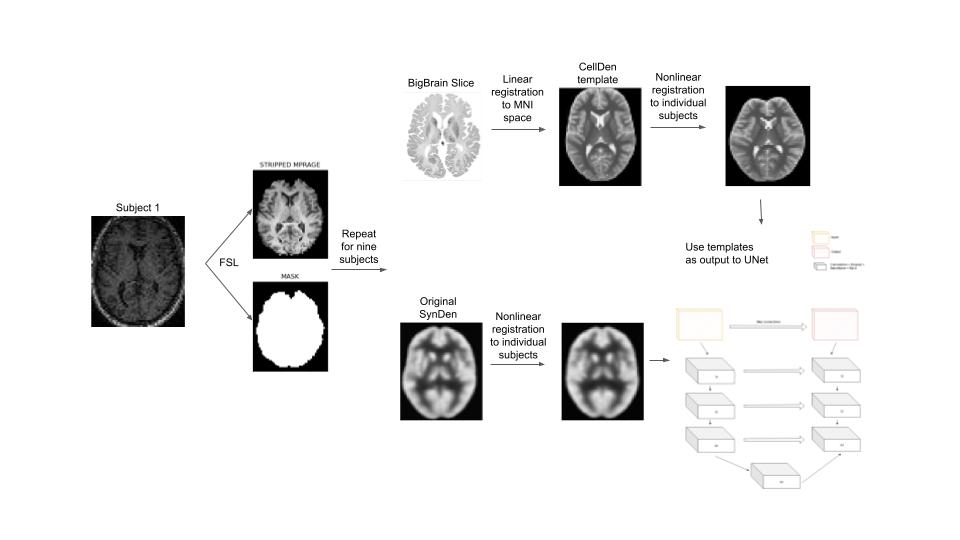
Project pipeline is shown. Subject MPRAGEs were taken from ADNI and brain masked and skull-stripped using FSL. To obtain the CellDen silver standard, original BigBrain slices were linearly registered to MNI space. This template was then nonlinearly registered to subject skull-stripped MPRAGE to create personalized CellDen templates. A similar nonlinear registration process was followed to develop the SynDen templates. These templates were used as output targets for our UNet model.
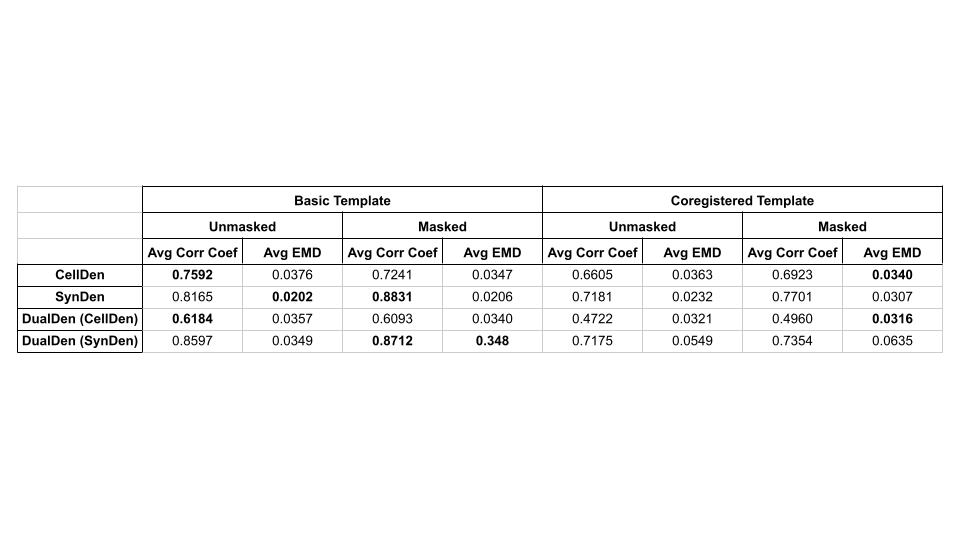
Results of each model and ablation study are shown. Especially for SynDen, masking tended to improve average correlation coefficient and average Earth Mover’s Distance (EMD). In general, registration of templates to individual MPRAGEs caused a decreased correlation coefficient and a higher EMD, but the model is likely overfitting when using non-individualized templates leading to better quantitative performance on the limited dataset.
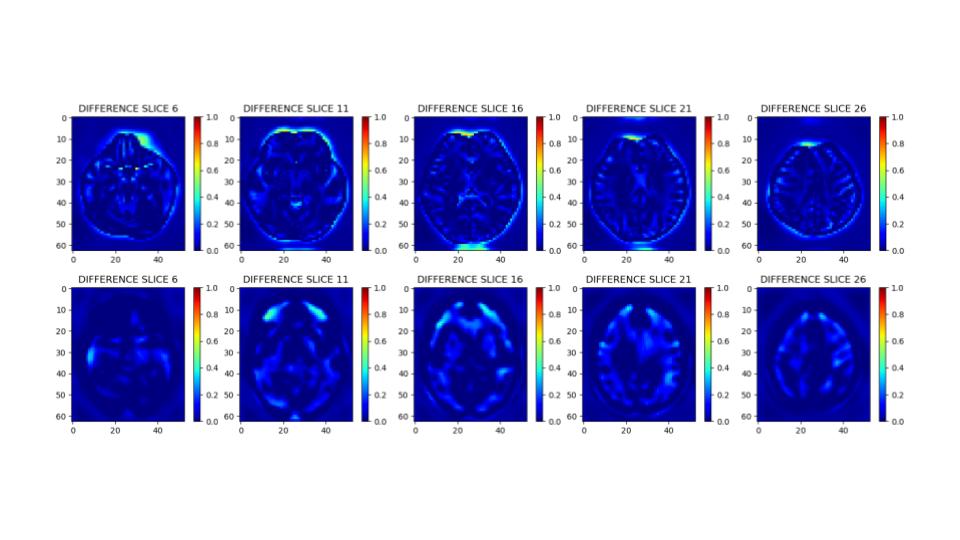
Difference images for Subject 1 are shown. The first row of images shows the difference between model prediction and silver standard for CellDen, while the second row shows the same for SynDen. Model performance is worst at the edges of the brain, most significantly at the top edge. The model is better at predicting both cell and synaptic density in gray matter compared to white matter.
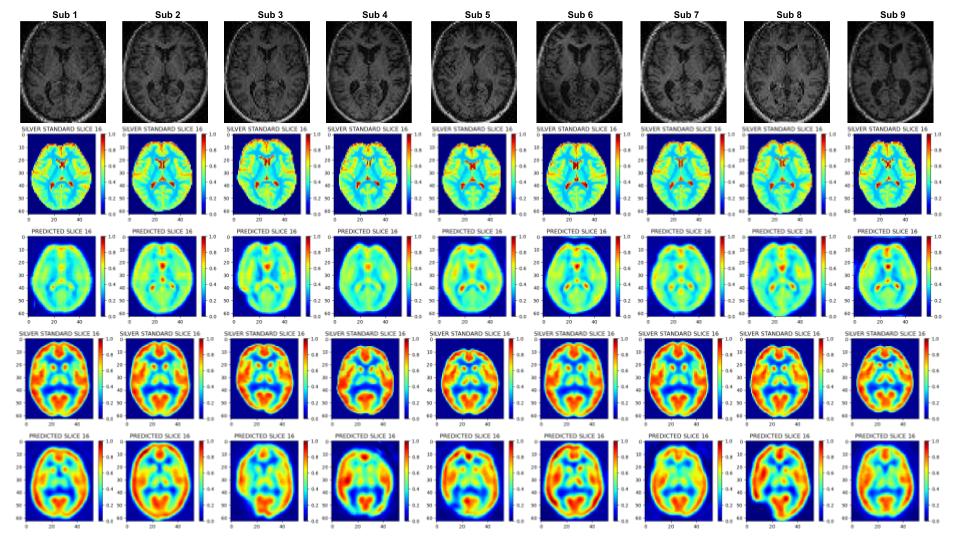
Model prediction results for each subject are shown. The first row shows subject MPRAGEs. The next two rows show CellDen silver standard and predictions, respectively, while the last two rows depict the same for SynDen. CellDen and SynDen results were predicted using separate models and the silver standard templates for both CellDen and SynDen were registered to individual MPRAGEs. Without masking, some model predictions do not exactly match template shapes, especially for SynDen.
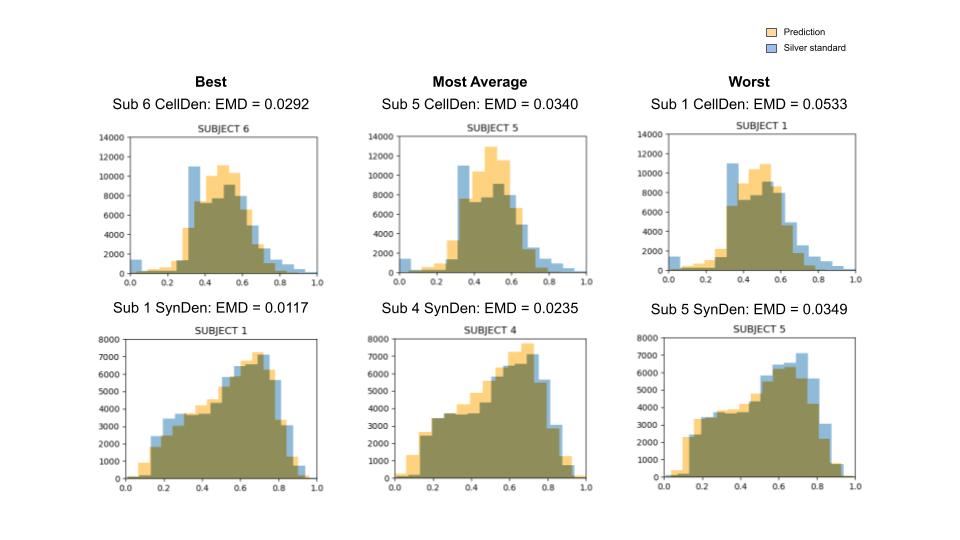
Histograms for best, average, and worst case subject results, separated by EMD metric performance. Prediction histograms are overlaid over silver standard ones. The model performs better on SynDen than CellDen, as the worst SynDen prediction is comparable to an average CellDen one. The model also misses peaks present in the template histograms, most evidently the CellDen models. This is likely reflective of the model’s poor performance on white matter.