4845

Automatic Quantification of Abdominal Subcutaneous and Visceral Adipose Tissue based on Dixon Sequences using Convolutional Neural Networks
Benito de Celis Alonso1, José Gerardo Suárez García2, Po Wah-So3, Javier Miguel Hernández López1, Silvia Sandra Hidalgo Tobón4,5, and Pilar Dies Suárez6
1Faculty of Physical and Mathematical Sciences, Benemérita Universidad Autónoma de Puebla, BUAP, Puebla, Mexico, 2Benemérita Universidad Autónoma de Puebla, BUAP, Puebla, Mexico, 3Department of Neuroimaging, Institute of Psychiatry, King´s College London, London, United Kingdom, 4Facultad de Ciencias, UAM Campus Iztapalapa, CDMX, Mexico, 5Imaging Department., Hospital Infantil de México, federico Gómez, CDMX, Mexico, 6Imaging Department, Hospital Infantil de México Federico Gómez, CDMX, Mexico

Synopsis

Keywords: AI/ML Software, Fat

Motivation: Currently there is a widely validated commercial semi-automatic method called AMRA® Researcher, which quantifies ASAT and VAT. However, it is not accessible to everyone due to the necessary economic means.

Goal(s): To develop an automatic, simple and free methodology to quantify ASAT and VAT, with at least the same precision as AMRA® Researcher.

Approach: Preprocessing and simple CNNs applied on in-phase Dixon MRI sequences were proposed for quantify VAT and ASAT.

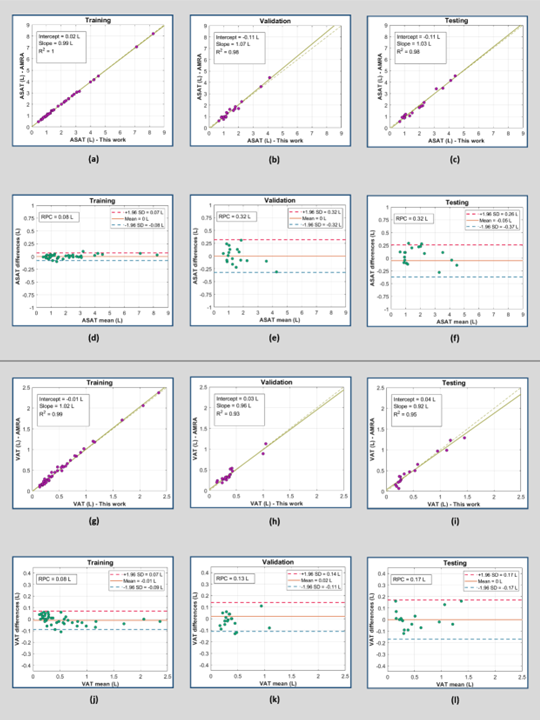
Results: There were no significant differences between the quantifications from AMRA Researcher and our methodology. Both obtained a high correlation and our methodology reached the precision of AMRA® Researcher.

Impact: Our automatic, simple and free ASAT and VAT quantification methodology, studying MRI through preprocessing and CNNs, achieved the precision of the commercial semi-automatic AMRA Researcher method. After future independent validation, this could become an accessible tool to assist specialists.

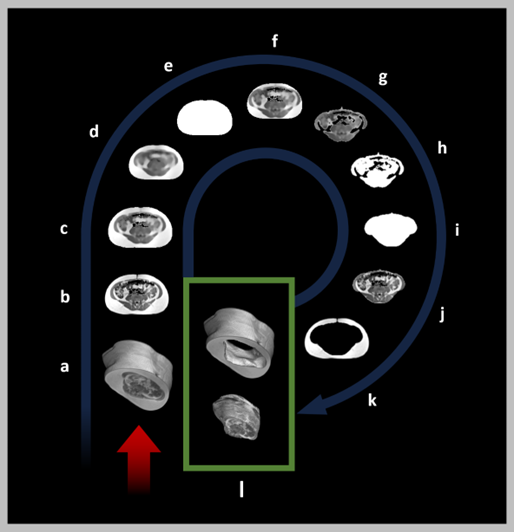
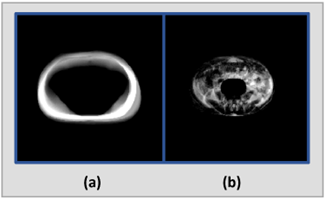
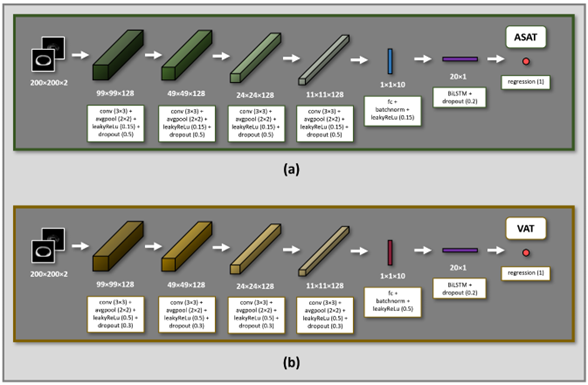
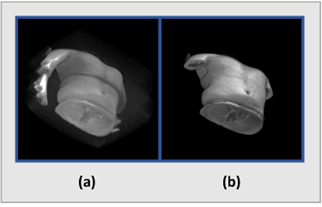
Introduction: Although BMI is an international standard measure for obesity in both children and adults, it does not describe the amount and distribution of body fat. In children, it is known that a greater amount of visceral adipose tissue (VAT) compared to abdominal subcutaneous adipose tissue (ASAT) is related to the early onset of diseases, as well as a higher risk of obesity in adulthood 1. Currently there is a widely validated commercial semi-automatic method called AMRA® Researcher, which allows VAT and ASAT to be quantified by studying Dixon MRI sequences 2. However, it is not accessible to everyone due to the financial investment involved. Objective: Our goal was to develop an automatic, simple and free method to quantify ASAT and VAT, with at least the same precision as AMRA® Researcher, this being equal to 0.17 L for VAT and 0.33 L for ASAT, according to the reports obtained from the quantifications made by AMRA Researcher on our own database. Methods: A proprietary database was studied, consisting of in-phase Dixon MRI sequences of 78 Mexican children, aged 7 to 9 years, with different weight profiles (3 were underweight (BMI percentile < 5), 42 were normal weight (BMI percentile 5 - 85), 17 overweight (BMI percentile 85-95) and 16 obese (BMI percentile >95). The subjects were randomly separated into training, validation and testing subsets, containing 42, 18 and 18 subjects respectively. Since the full body scan of each subject was made up of several overlapping volumes, alignment and joining processes was carried out (Fig. 1). Subsequently, other preprocessing techniques was applied on each axial slice of a joined volume, in order to perform an approximate separation of ASAT and VAT. The result of the separation was two 3D volumes that contained approximately only ASAT and VAT respectively (Fig. 2). These two 3D volumes did not necessarily contain all the ASAT and VAT of the subject studied. Afterwards, two (what we call) Total Intensity Maps were created, which were 2D images that resulted from the sum of the intensities of the voxels of the aforementioned 3D volumes (Fig. 3). Two simple Convolutional Neural Networks (CNNs) architectures were proposed, whose inputs were the two Total Intensities Maps of each subject (Fig. 4). These networks were trained, validated and tested with the corresponding subjects. The outputs of the networks were the quantifications of VAT and ASAT respectively. The quantifications made by AMRA Researcher and those made by our methodology were compared using statistical tests, correlations plots and Bland-Altam graphs. Results: Considering the quantifications from testing subjects, there were no significant differences (p > 0.05) between the quantifications made by AMRA Researcher and those made by our methodology. Furthermore, both reached a high correlation. Our methodology obtained a precision for VAT and ASAT equal to 0.17 L and 0.32 L, therefore equaling the precision of AMRA® Researcher (Fig. 5). Conclusions: Although our methodology achieved the precision of AMRA Researcher, the second is a widely validated method. However, our methodology, being automatic, simple, with low demand for computational resources and free, allows its validation by future independent works, after which, it could be useful as an accessible tool that assists specialists in diagnosis, follow-up and prevention of childhood obesity.

Acknowledgements

We would like to thank CONAHCyT for their support of the postdoctoral expenses of Dr. José Gerardo Suárez García.

References

1. Neeland I, Ross R, Després J, et al. Visceral and ectopic fat, atherosclerosis, and cardiometabolic disease: a position statement. Lancet Diabetes Endo. 2019; 7(9): 715-725.

2. Borga M, West J, Bell J, et al. Advanced body composition assessment: From body mass index to body composition profiling. J Invest Med. 2018; 66(5): 1-9.
Figures

Figure 1: Alignment and joining. (a) Initially, two overlapping volumes form the region of interest. (b) After applying normalizing, equalizing and centering techniques, an aligned and joined volume containing the regions of interest was obtained.

Figure 2: Approximate separation of ASAT and VAT. (a) Joined volume. (b) Example axial slice. (c) Smoothing. (d) Slice resized and smoothed (e) Mask creation. From (c), (f) slice obtained after applying the mask. (g) Removal of voxels with intensities ≥ 0.75. (h) Voxels intensities equal to 1. (i) Creation of new mask. From (b), (j) slice containing VAT after removing voxels outside the mask, and (k) slice containing ASAT after removing voxels inside the mask. (l) Volumes with separate ASAT and VAT.

Figure 3. Total intensity maps. (a) Total intensity map, obtained from the volume that contained approximately only ASAT. (b) Total intensity map, obtained from the volume that contained approximately only VAT. Both maps together were used as input to the proposed CNNs.

Figure 4. CNNs architecture to quantify ASAT and VAT. The different blocks and layers that formed the proposed CNNs to quantify (a) ASAT and (b) VAT are shown. Both had the Total Intensity Maps together as inputs.

Figure 5: Bland-Altman and correlation graphs. (a), (b) and (c) show the results obtained from correlation plots, while (d), (e) and (f) show the Blan-Altman graphs for the training, validation and testing subjects respectively, all regarding the quantification of ASAT. Similarly, from (g) until (l), the results obtained regarding the quantification of VAT are showed.

Proc. Intl. Soc. Mag. Reson. Med. 32 (2024)
4845
DOI: https://doi.org/10.58530/2024/4845