4842
Initial experience of proton short echo MR spectroscopy of human brain at 5T1United-Imaging Healthcare, Shanghai, China, 2Wuhan United-Imaging Life Science Instrument Ltd Co., Wuhan, China, 3United-Imaging Healthcare, Shenzhen, China
Synopsis
Keywords: High-Field MRI, Metabolism, spectroscopy
Motivation: Proton short echo (TE≤10ms) MR spectroscopy of human brain at high magnetic fields (≥3T) provides abundant metabolic information beyond MR images, but remains challenging for routine clinical usages beyond 3T.
Goal(s): To evaluate feasibility and assess quality of proton ultrashort echo (i.e.10ms) MR spectroscopy of human brain on a clinical, whole-body 5T MRI system.
Approach: Stimulated echo acquisition mode (STEAM) spectra with TE=10ms were obtained in human brain at 3T and 5T.
Results: The feasibility of short echo MR spectroscopy of human brain at 5T was first demonstrated. The spectral quality is substantially improved when compared to 3T.
Impact: The quality of short echo MR spectra at 5T could be reached without exceeding the SAR and thus may offer additional metabolite information for large amount of clinical diagnostic applications.
Introduction
In vivo MR spectroscopy is a unique technique that allows noninvasive quantification of brain metabolites.(1) and references therein) Increased availability of high magnetic field MR scanners in recent years stimulates an interest in evaluating the pros and cons of in vivo 1H MR spectroscopy of brain for clinical usages. For instance with increased magnetic field strengths, the amplified spectral resolution together with increased signal to noise levels makes detection of metabolites (1). However, the RF power required for a 90° pulse maybe doubled (2), thus limits to routinely clinical usages without exceeding the specific absorption rate (SAR). Stimulated-echo acquisition mode (STEAM, 3) is a major method used for localized proton magnetic resonance spectroscopy (MRS). Although STEAM suffers a two-fold signal loss compared to point-resolved spectroscopy (PRESS, 4), but allows shorter echo times (TE) without exceeding SAR, it is highly desirable to be applied at high magnetic fields. Therefore, the aim of this study was to evaluate STEAM on a clinical platform at 3T and 5T and to obtain high-quality single-voxel spectra of the human brain at ultrashort TEs (≤10 ms).Methods
Experiments were performed on two whole body MRI scanners (United Imaging Healthcare, Shanghai, China) with two field strengths, i.e. 3T and 5T, respectively. At 3T (uMR 790), a whole body VTC RF coil was used for transmitting and a HNC24 (24 channels, United-Imaging Healthcare, P. R .China) RF coil was used for receiving. At 5T (uMR Jupiter), a HC48 (48 channels) RF coil (United-Imaging Healthcare, P. R. China) was used for transceiving.In total, four healthy volunteers were scanned. Amongst, two of them were scanned at both 3T and 5T. In both scanners, all subjects were lying supine position and prepared for further brain scanning. After anatomical images (FSE, TE/TR=110/4436ms, BW=250Hz/pixel), volume of interests (VOIs, 8cm3) were carefully positioned in either white matter or the occipital lobe (1). All first- and second-order shim terms were automatically adjusted over the VOIs using a 3D GRE sequence. Then the STEAM sequence was optimized for both scanners, i.e Shinnar-Le Roux RF pulses(duration= 2.5ms, bandwidth= 3kHz) were used. The STEAM sequence was implemented with a dynamic frequency correction scheme. Water suppression was achieved with a WET approach. (5)
Then, the obtained in vivo spectra were analyzed using the LcModel (6, 7). As previous studies (1), LcModel basis sets for 5T included 19 brain metabolites: alanine (Ala), ascorbate (Asc), aspartate (Asp), creatine (Cr), phosphocreatine (PCr), γ-aminobutyric acid (GABA), glucose (Glc), glutamate (Glu), glutamine (Gln), glutathione (GSH), glycerophosphorylcholine (GPC), phosphorylcholine (PCho), glycine, myo-inositol (myo-Ins), scyllo-inositol (scyllo-Ins), lactate (Lac), N-acetylaspartate(NAA), N-acetylaspartylglutamate (NAAG), phosphorylethanolamine (PE), and taurine (Tau). All spectra were simulated based on a recently updated database of chemical shifts and coupling constants (8,9) using in-house matlab codes. LcModel basis sets for 3T is from the LcModel packages (6,7). Since the mathematical approximation can provide sufficiently accurate and reproducible estimate of the macromolecule contribution to the 1H spectra at 3T (10, 11), we adopted such approach for this study. Due to the fact that some metabolites remain highly correlated, i.e. NAA and NAAG, GPC and PCho, PCr and Cr, the sum of contents were also reported.
Results and Discussion
Typical short TE proton SVS data from the human brain were the first acquired at 5T (Top rows of Figure 1). The spectral quality clearly resolved peaks of glutamate and glutamine, as visually observed and highlighted in Figure 1a.Further LcModel analysis of three spectral data at 5T (FWHM of total Cr at 3.03ppm: 6.9±0.7Hz; sufficient SNR≥20) could reveal the following metabolites, including Asc, Gly, Glc, GPC, PCho, Scyllo, Asp, Glu, Gln, GSH, Ins, GABA, NAA, NAAG, and Mac etc, more than those from 3T, as shown in Figure 2. It is also to our interest to note that a spectrum from at 5T, a similar spectral quality to those of 7T (12) could be achieved (Figure 3).
Due to limited number of measurements were performed in this study and a measured macromolecule baseline is lacking, quality statistical comparison as previous studies (1,10) may be hampered. Nonetheless, the substantially reduced power deposition using STEAM, the satisfactory field inhomogeneity adjustment and high quality of short echo MR spectra at 5T suggests that ultrashort echo MR spectroscopy at 5T could become a promising technique to provide additional metabolic information for quite a few clinical applications.
Acknowledgements
No acknowledgement found.References
1. Tkáč, I., Öz, G., Adriany, G., Uğurbil, K. and Gruetter, R. (2009), In vivo 1H NMR spectroscopy of the human brain at high magnetic fields: Metabolite quantification at 4T vs. 7T. Magn. Reson. Med., 62: 868-879.
2. Vaughan, J.T., Garwood, M., Collins, C.M., Liu, W., DelaBarre, L., Adriany, G., Andersen, P., Merkle, H., Goebel, R., Smith, M.B. and Ugurbil, K. (2001), 7T vs. 4T: RF power, homogeneity, and signal-to-noise comparison in head images. Magn. Reson. Med., 46: 24-30.
3. Frahm J, Bruhn H, Gyngell ML, Merboldt KD, Hanicke W, Sauter R. Localized high-resolution proton NMR spectroscopy using stimulated echoes: initial applications to human brain in vivo. Magn Reson Med 1989; 9: 79–93
4. Bottomley PA. Selective volume method for performing localized NMR spectroscopy. US Patent #4,480,228 (approved 30 Oct 1984).
5. Ogg RJ, Kingsley PB, Taylor JS. WET, a T1- and B1-insensitive water-suppression method for in vivo localized 1H NMR spectroscopy. J Magn Reson B. 1994 May;104(1):1-10.
6.Stephen Provencher: Estimation of metabolite concentrations from localized in vivo proton NMR spectra. Magn Reson Med 30, 672 (1993).
7. Provencher SW. Automatic quantitation of localized in vivo 1H spectra with LCModel. NMR Biomed 2001; 14: 260–264.
8. Govindaraju V, Young K, Maudsley AA. Proton NMR chemical shifts and coupling constants for brain metabolites. NMR Biomed 2000; 13: 129–153.
9. Govindaraju V, Young K, Maudsley AA. Corrigendum: proton NMR chemical shifts and coupling constants for brain metabolites, NMR Biomed. 2000; 13: 129-153. NMR Biomed. 2015 Jul;28(7):923-4.
10. Mekle, R., Mlynárik, V., Gambarota, G., Hergt, M., Krueger, G. and Gruetter, R. (2009), MR spectroscopy of the human brain with enhanced signal intensity at ultrashort echo times on a clinical platform at 3T and 7T. Magn. Reson. Med., 61: 1279-1285.
11. Schaller, B., Xin, L., Cudalbu, C. and Gruetter, R. (2013), Quantification of the neurochemical profile using simulated macromolecule resonances at 3 T. NMR Biomed., 26: 593-599.
12. Riemann, LT, Aigner, CS, Ellison, SLR, et al. Assessment of measurement precision in single-voxel spectroscopy at 7 T: Toward minimal detectable changes of metabolite concentrations in the human brain in vivo. Magn Reson Med. 2022; 87: 1119–1135.
Figures
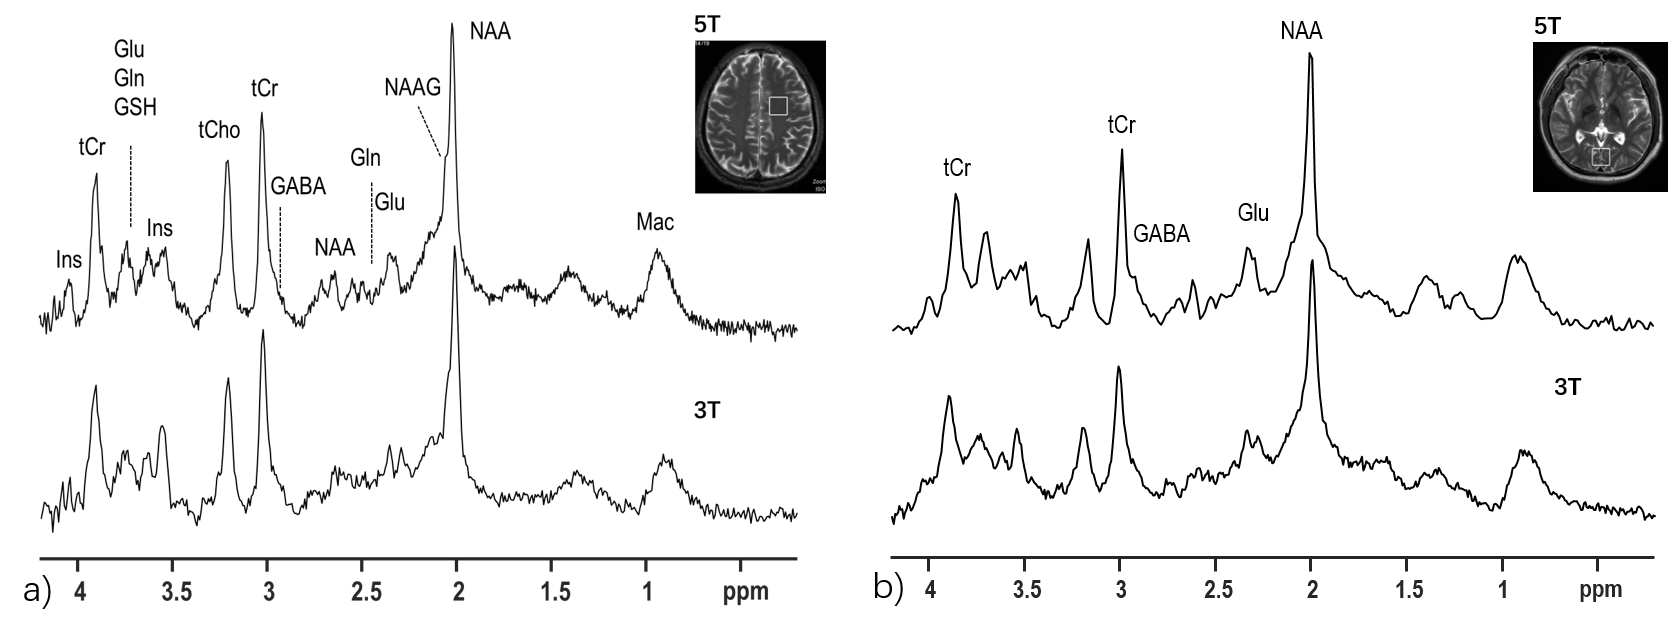
Figure 1 Typical MR spectroscopy of human white matter (a) from one volunteer and occipital lobe (b) from another volunteer at both 3T and 5T. STEAM, TE=10ms, TR=2.5s, VOI=8 cm3, NEX=96/128. At 5T, some metabolites are visually observable, as indicated with the corresponding abbreviations. Abbreviations: tCr, total creatine; Glu, glutamate; Gln, glutamine; GSH, glutathione; Ins, myo-inositol; GABA, g-aminobutyric acid; NAA, N-acetylaspartate; NAAG, N-acetylaspartylglutamate; Mac, macromolecule.
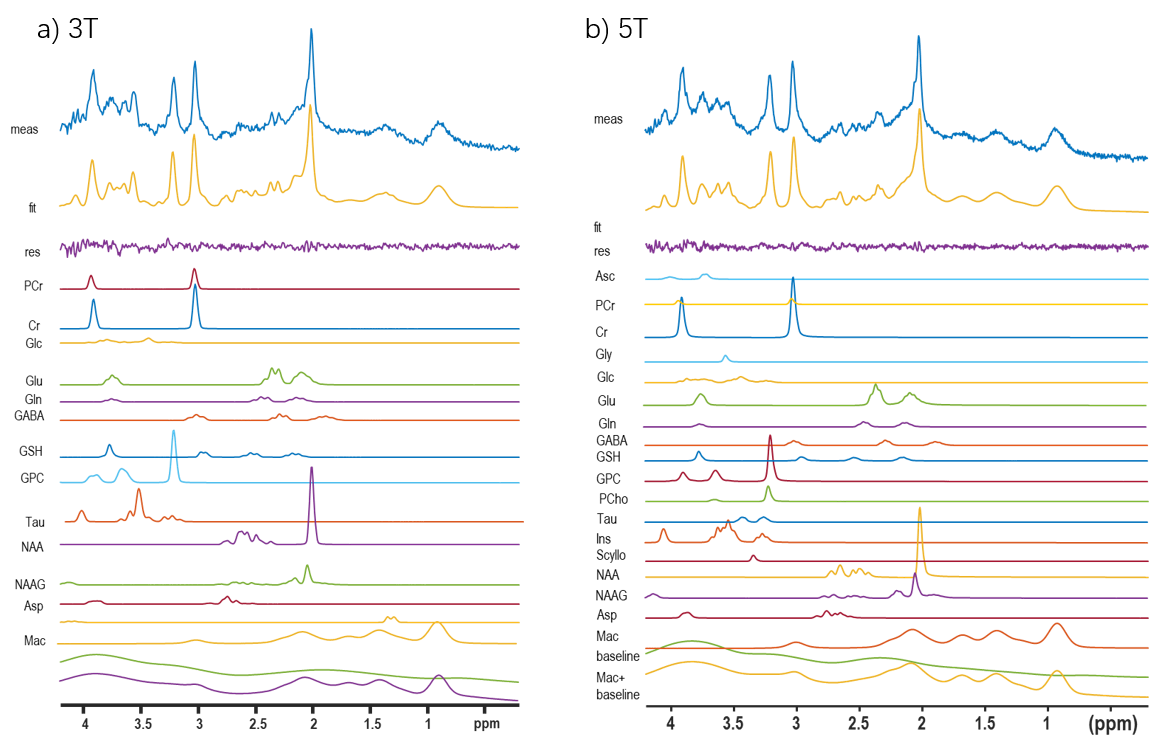
Figure 2 Fitted curves using LCModel for the human brain spectra acquired at 3T (a) and 5T (b) from Fig. 1a for the range of 0.2 to 4.2 ppm. Note the excellent agreement between the data (“meas”) and the fit (“fit”) also illustrated by the very flat and fit residual (“res”) at noise levels seen below the fit. In addition, LCModel output 0f 5T for metabolite signals, macromolecule (Mac) contributions, and baseline are shown for each spectrum. Additional abbreviations are listed in methods
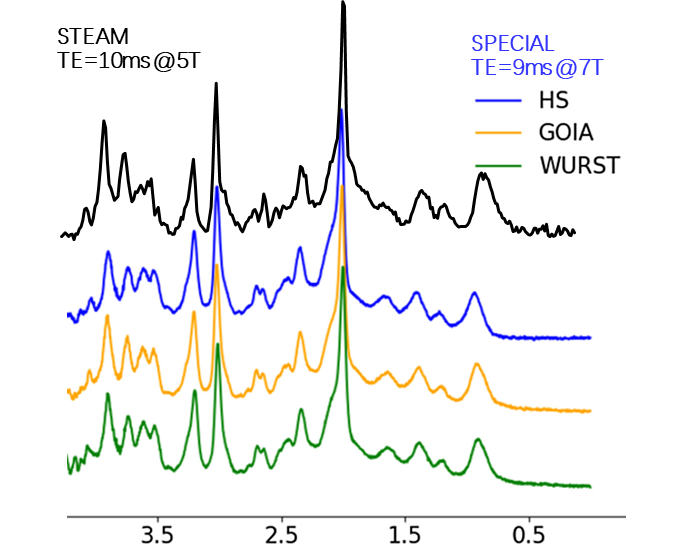
Figure 3. A direct spectral comparison between 5T and 7T (12). Typical STEAM spectrum at 5T (solid black line, top spectrum) from human occipital lobe exhibits similar spectral patterns to those of 7T, a reproducibility study (blue, orange and green lines, the bottom three spectra, 12).
