4838
Enabling reproducible measurements of Fat Fraction and Iron content using an SI traceable reference phantom1National Physical Laboratory, Teddington, United Kingdom, 2National Measurement Laboratory, LGC, Teddington, United Kingdom, 3AOU Careggi, Firenze, Italy, 4Belfast Health and Social Care Trust, Belfast, United Kingdom, 5Istituto Nazionale di Ricerca Metrologica, Torino, Italy, 6National Measurement Laboratory, Teddington, United Kingdom, 7Institute of Metrology of Bosnia and Herzegovina, Sarajevo, Bosnia and Herzegovina, 8Brighton and Sussex Medical School, Brighton, United Kingdom, 9TÜBİTAK, Ankara, Turkey, 10TÜBİTAK, Ankara, United Kingdom, 11University College London, London, United Kingdom, 12University Hospitals Bristol and Weston NHS Foundation Trust, Bristol, United Kingdom, 13VERLAB, Sarajevo, Bosnia and Herzegovina
Synopsis
Keywords: Phantoms, Phantoms, Metrology, Traceability
Motivation: Quantitative MRI is a powerful tool for measuring a variety of biological parameters, with two common biomarkers of interest being fat fraction and Iron content.
Goal(s): We present here a test object for these parameters which is supported by fundamental metrology and traceable to the SI system.
Approach: Initial scan data taken at 1.5T is compared with traceable measurements of phantom properties
Results: We see significant variation seen in clinical results of the same phantom even with standardised protocols, outside the range of phantom validation.
Impact: We demonstrate a new gold standard and verified phantom for fat and iron measurement, traceable to primary standards. We present results using standardised MRI protocols which is vital for understanding and improving standards and best practice guidelines in the future.
Introduction
To support the increased use and development of quantitative MRI (qMRI) techniques, it is vital that phantoms and measurement science advances proportionally. The understanding and validation of phantoms is of key importance, and knowledge of their fundamental material properties is the foundation upon which confidence in the measurement process is based1,2. Two notable biological parameters in qMRI are Iron content, such as for assessment of haemochromatosis3, and fat content, for example in the investigation of fatty liver4. Fat measurement is also a valuable tool in evaluating the progression of Duchenne Muscular Dystrophy5 where age and mortality can restrict the size of clinical trial sample size, and therefore restrict the statistical power of data5. One way to bring confidence into clinical evaluation of pathology is in developing robust test objects, which is impossible without traceable validation methods. Such methods already exist for relaxometry6, and here we present an extension of this metrological rigour to fat and iron. The iMet-MRI project has developed an MRI phantom for the measurement of Proton Density Fat Fraction (PDFF) and Iron content, where each of these has a traceable link to the SI system. This then provides a gold standard from which it is possible to characterise scanner hardware capability, analysis techniques, and work towards robust confidence for in vivo qMRI measurements.Methods
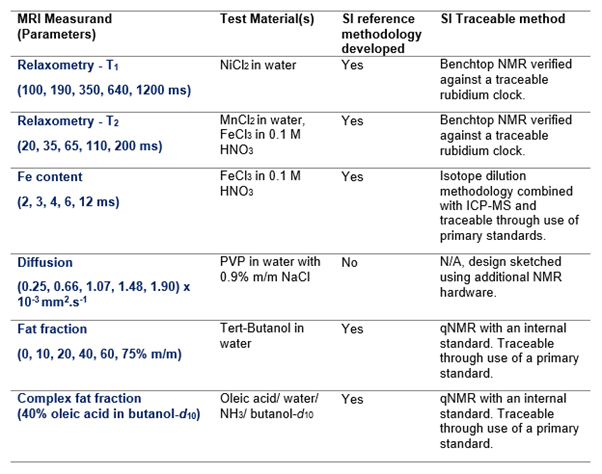
Contrast solutions were synthesised to represent key qMRI measurands, including PDFF and iron content. The manufacture of the contrast solutions was controlled to generate target solution concentrations that were verified by MRI-independent SI traceable measurements. A summary of these and traceable methods developed to characterise the solutions is shown in Figure 1, however this work focuses only on the Iron and Fat measurement. A tert-butanol (t-butanol) solution in water was chosen as a fat mimic as the route to traceable concentration measurements is straightforward. As the spectral complexity of t-butanol is significantly simpler than that of human adipose tissue, a more complex oleic-acid water solution at 40% was also produced to facilitate bridging the gap to clinically relevant phantoms. FeCl3 was used as the basis for the iron vials, as the oxidation state corresponds to that used in human iron storage mechanisms. Traceable measurement for t-butanol content was determined through qNMR isotope dilution mass spectrometry, using dimethyl sulfone as an internal standard. T2* data for the iron vials was obtained using a traceable benchtop NMR spectrometer at 1.4T. Initial multi-site trial data was taken using a standardised procedure; measurements for T2* were taken using a 2D single echo GRE with TE of 4-24 ms in 2 ms increments. For PDFF results 2-point Dixon sequences were acquired, along with 2D Gradient Echo at six TE values: 3.93, 4.78, 7.17, 9.56, 11.95, and 14.34ms at 1.5T, and 3.37, 3.45, 4.60, 5.75, and 8.10 ms for 3T. Initial data currently covers Siemens Prisma, Skyra, Aera, Avanto, and Sola models, with GE and Philips 1.5 and 3T results still undergoing analysis.Results
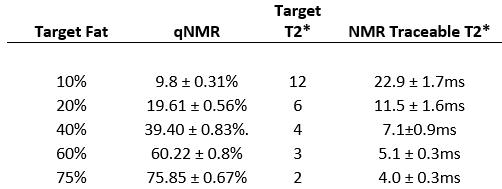
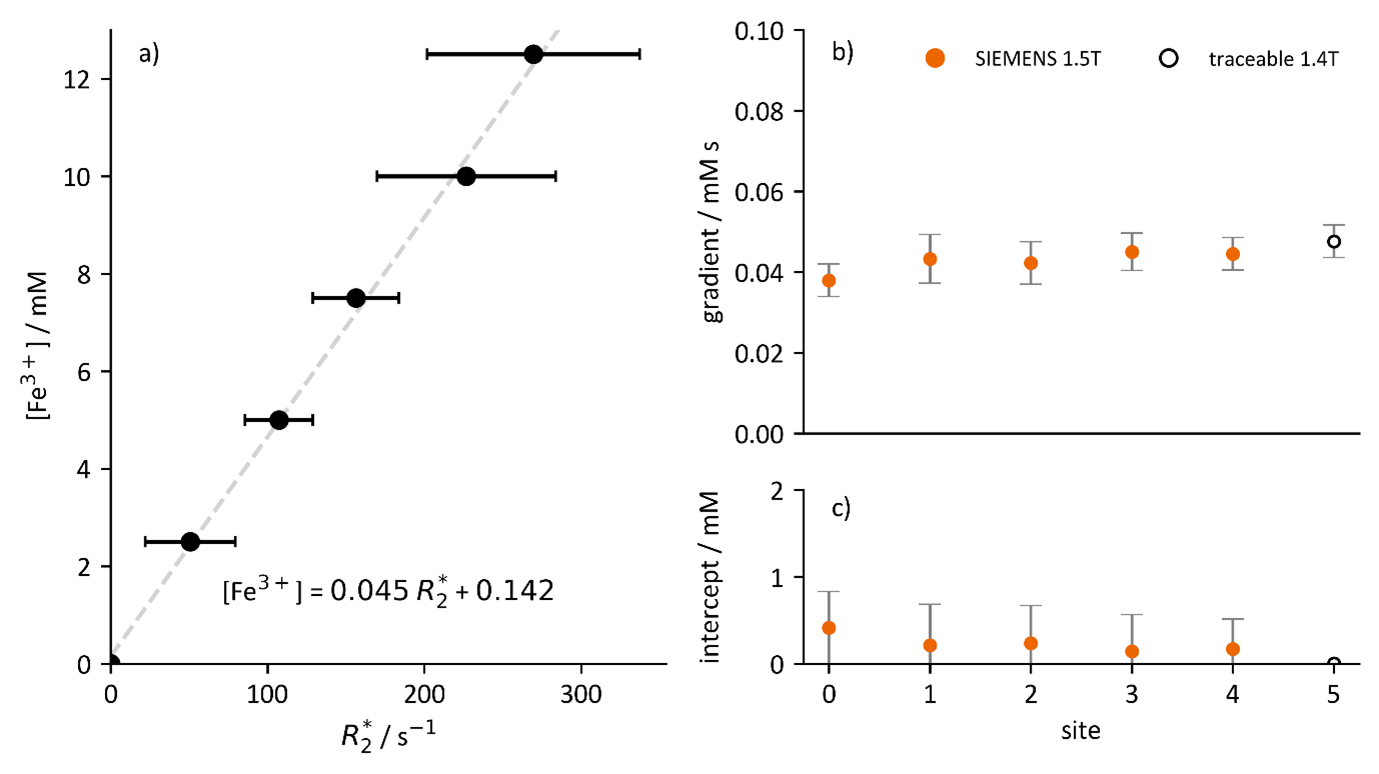
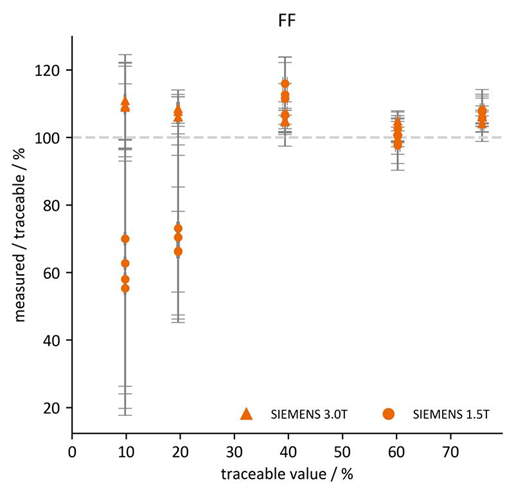
The target values and traceably measured values for the t-butanol concentrations and T2* values for Iron vials can be found in Figure 2. For measurement of Iron content the traceable T2* measurements were used as the basis of a comparison against clinical 1.5T data by fitting a linear correlation of R2* with iron content.7 Figure 3 shows good agreement between the observed 1.5T MR data, with the discrepancy for field strength lying within uncertainties, and no significant differences across all sites against reference measurements with a p-value of >0.05. Future work will involve calibrating the T2*-Iron curve with traceable iron concentration, and applying a field correction so that 1.5T and 3T data can be compared equivalently. Figure 4 shows the wide range of results we see on clinical scans of the fat vials. Whilst there is a broad degree of agreement for high fat concentrations, at low values we see significant variability within the results, far in excess of the range of uncertainties on the SI measurement.Conclusions
A phantom suitable for use as a ground truth for Fat and Iron content is presented, along with traceable reference values, for quantitative MR measurement of Fat and Iron content. We show results from an indicative multi-site trial over varying sites, which shows good agreement between sites for iron measurements, but notable variation in results across different individual scanners for PDFF measurements. This highlights the challenges faced in standardisation efforts, as even with a traceable series of test objects and standardised protocols, differences in practical implementation of scanner acquisition and analysis protocols may contribute to inconsistent results.Acknowledgements
This project 20NRM05 iMet-MRI has received funding from the EMPIR programme co-financed by the Participating States and from the European Union's Horizon 2020 research and innovation programme.References
[1] Cashmore MT, McCann AJ, Wastling SJ, McGrath C, Thornton J, Hall MG. Clinical quantitative MRI and the need for metrology. The British Journal of Radiology 2021 94:1120 https://doi.org/10.1259/bjr.20201215
[2] Keenan, K.E., Ainslie, M., Barker, A.J., Boss, M.A., Cecil, K.M., Charles, C., Chenevert, T.L., Clarke, L., Evelhoch, J.L., Finn, P., Gembris, D., Gunter, J.L., Hill, D.L.G., Jack, C.R., Jr., Jackson, E.F., Liu, G., Russek, S.E., Sharma, S.D., Steckner, M., Stupic, K.F., Trzasko, J.D., Yuan, C. and Zheng, J. (2018), Quantitative magnetic resonance imaging phantoms: A review and the need for a system phantom. Magn. Reson. Med, 79: 48-61. https://doi.org/10.1002/mrm.26982
[3] Henninger B, Alustiza J, Garbowski M, Gandon Y. Practical guide to quantification of hepatic iron with MRI. Eur Radiol. 2020 Jan;30(1):383-393. doi: 10.1007/s00330-019-06380-9. Epub 2019 Aug 7. PMID: 31392478; PMCID: PMC6890593.
[4] Starekova, J, Hernando, D, Pickhardt, Perry J, Reeder, Scott B. Quantification of Liver Fat Content with CT and MRI: State of the Art, Radiology, vol301, no2. https://doi.org/10.1148/radiol.2021204288
[5] Al-Khalili Szigyarto C, Spitali P. Biomarkers of Duchenne muscular dystrophy: current findings. Degener Neurol Neuromuscul Dis. 2018;8:1-13 https://doi.org/10.2147/DNND.S121099
[6] Boss, M. , Dienstfrey, A. , Gimbutas, Z. , Keenan, K. , Splett, J. , Stupic, K. and Russek, S. (2018), Magnetic Resonance Imaging Biomarker Calibration Service: Proton Spin Relaxation Times, Special Publication (NIST SP), National Institute of Standards and Technology, Gaithersburg, MD, [online], https://doi.org/10.6028/NIST.SP.250-97 (Accessed November 1, 2023)
[7] Amin K, Mileto A, Kolokythas O. MRI for Liver Iron Quantification: Concepts and Current Methods. Seminars in Ultrasound, CT and MRI 2022;43:364–70. https://doi.org/10.1053/j.sult.2022.03.006.
Figures