4837
Does the stability assessment of an MRI scanner depend on the phantom used?1Brain Repair and Rehabilitation, UCL Queen Square Institute of Neurology, London, United Kingdom, 2NMR Research Unit, UCL Queen Square Institute of Neurology, London, United Kingdom, 3Gold Standard Phantoms, Sheffield, United Kingdom
Synopsis
Keywords: Phantoms, Phantoms, Reproducibility, Test-Retest
Motivation: The demonstration of the independence of fBIRN QA metrics on the phantom used would enable an easy cross-scanner comparison of scanner stability, thus improving such QA for clinical use (e.g., presurgical mapping).
Goal(s): The goal of this study was to assess the variance measured using such metrics across phantoms.
Approach: Nine identical phantoms were scanned on a single 3T scanner. Relaxometry and fBIRN scanning was performed on all phantoms and compared to those measured on a single phantom scanned 15 times.
Results: No significant difference was found between phantoms on either their relaxivities, or their QA fBIRN parameters.
Impact: The independence of fBIRN QA metrics on the phantom used found in this work enables the use of generalised QA across MRI scanners to assess their capacity at providing high quality fMRI for presurgical mapping, thereby ensuring optimal patient outcomes.
Introduction
Functional MRI (fMRI) has long been an established method to assess eloquent brain areas prior to surgical interventions. When used for such presurgical mapping, testing and ensuring the stability of fMRI scanners is not a mere technicality but a safeguard for the brain's cartography. The functional Biomedical Informatics Research Network (fBIRN) provides a rigorous approach to evaluate MRI stability1; however, the dependency of such evaluations on the type of phantom used remains an underexplored area. This study aims to investigate the phantom dependency of scanner stability when assessed using the fBIRN methodology. A phantom-independent stability would enable better standardization across MRI systems and improve inter-scan comparisons, obviating the variability brought by phantom properties. The assessment of such variability will therefore help advancing fMRI applications to their full potential in the clinical context, ensuring that patient outcomes are not confounded by unacknowledged technical variables.Methods
Study DesignNine identical 18-cm in diameter spherical gel phantoms were used in this study. Each phantom was made of a proprietary water-based synthetic gel doped for physiologically relevant T1/T2 values (aiming to be 460ms/60ms at 3 Tesla at 20°C). The shell was made of high-density polyethylene, the filling plug was made of nylon and the plug gasket was made of nitrile. All these phantoms were manufactured in Autumn 2019 by Gold Standard Phantoms (Sheffield, UK). All the phantoms were scanned using a Philips 3.0T Ingenia CX MRI scanner (Best, The Netherlands) during Spring 2023. All nine phantoms were scanned within a period of two weeks, with three of them rescanned in a second session, two weeks apart. One of the phantoms was purposefully chosen to be scanned 15 times over a period of 1 month to compare the variance measured between phantoms to that of the MRI scanner itself.
MRI Protocol
Each phantom was scanned using a variable flip angle (VFA) method2, to assess T1 relaxation time using a 3D-spoiled gradient-echo sequence (repetition time (TR)/echo time (TE)/flip-angle (FA)1/FA2=29ms/2.3ms/4°/24°), field-of-view (FOV)=256x256mm2, voxel size= 1x1x1mm3; an eight-echo gradient-echo to assess T2* with TR/TE1/ΔTE/FA=29ms/2.3ms/3.3ms/24°, FOV=256x256mm2, voxel size=1x1x1mm3; finally a B1 mapping sequence based on a modified ‘Actual Flip Angle Method’ method3, was also acquired with the following parameters: TR1/TR2/TE/FA=30ms/180ms/2.2ms/60°, FOV=256x256mm2, voxel size=4x4x4mm3.
For the assessment of scanner stability, an fBIRN scan was run using the following acquisition protocol: gradient-echo echo-planar imaging, with TR/TE/FA=2000ms/30ms/90°, FOV=220x220mm2, voxel size=3.4x3.4x4mm3, 200 dynamic scans. The protocol was run after a 15min warm up of the MRI system to ensure adequate gradient stability.
Image Analysis
The fBIRN quality assurance (QA) pipeline was employed to calculate QA parameters for each imaging session1. The QA parameters used here were standard deviation (STD) over time1, signal-fluctuation-to-noise ratio (SFNR)4, and radius of decorrelation (RDC)5. Batch-to-batch variations in relaxation times (T1/T2*), phantom tests reproducibility and statistical variations between fBIRN metrics were assessed by Student t-tests, while the relationship between relaxation times and fBIRN properties was assessed by Pearson’s correlation analysis.
Results
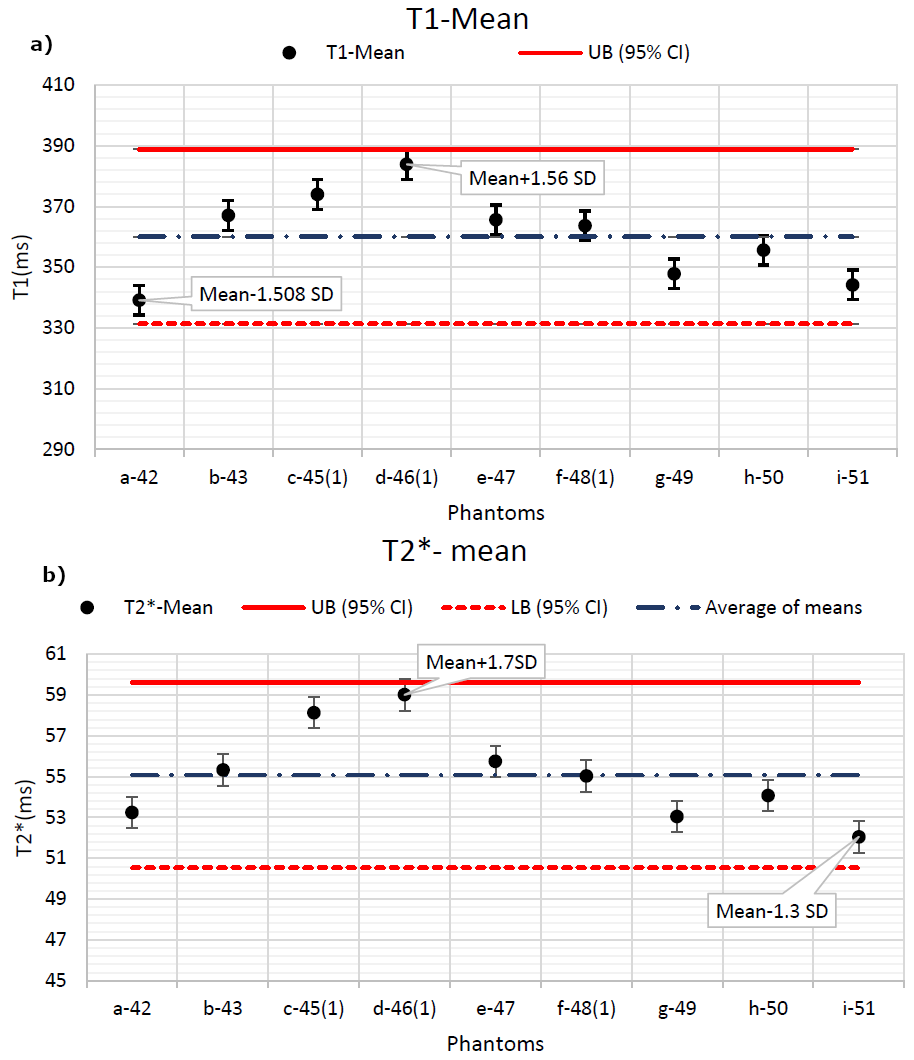
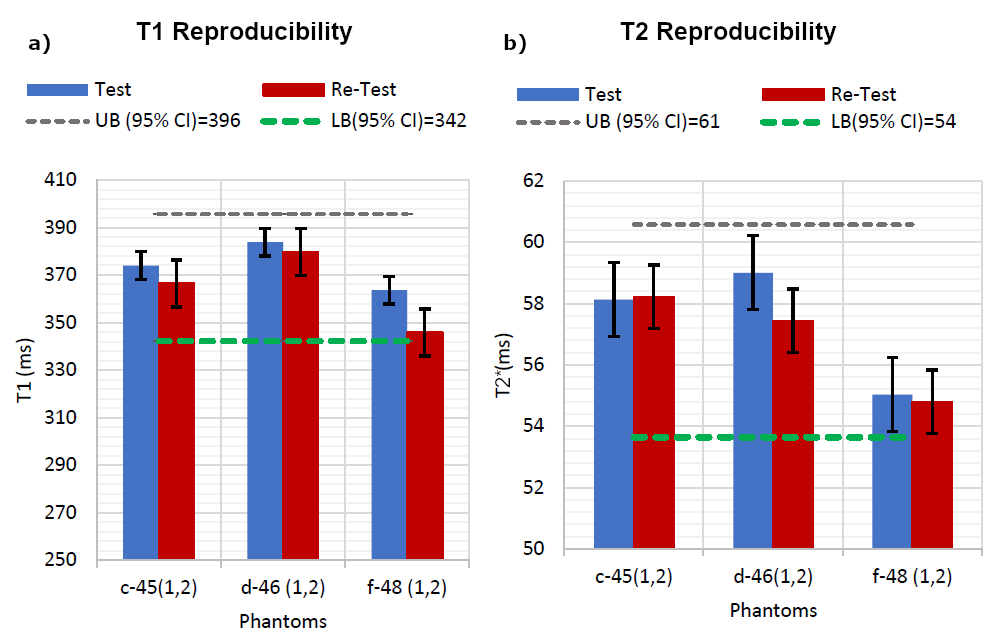
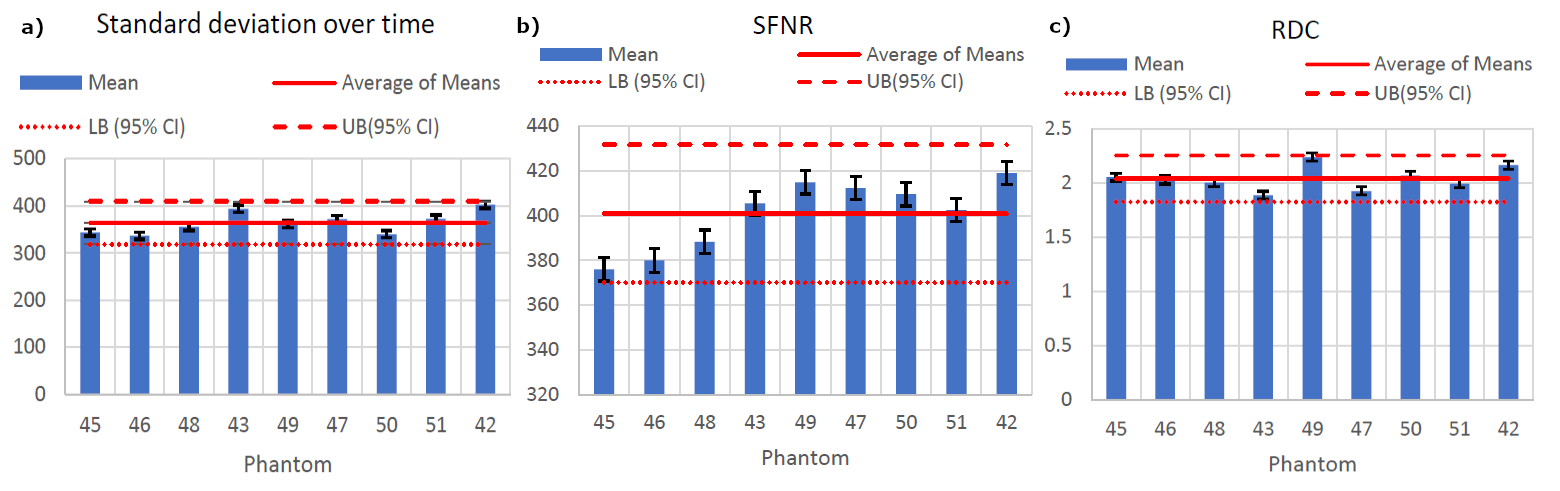
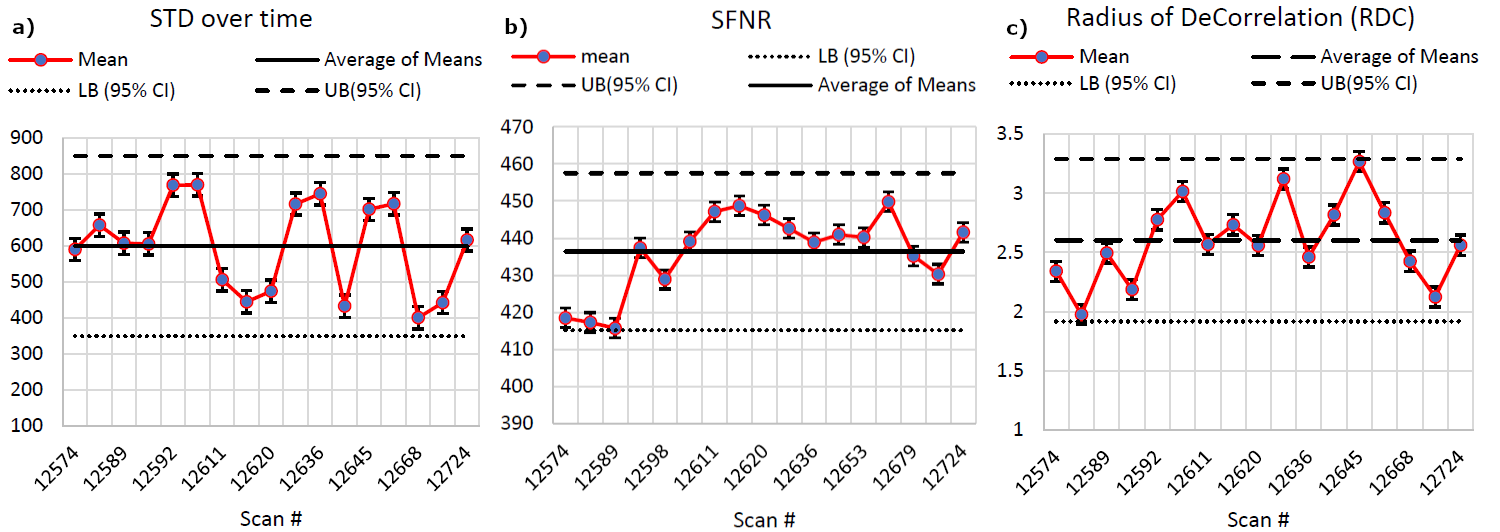
Figure 1 shows the T1 and T2* values of all phantoms. No significant difference was found between all these values across all phantoms, and all measured averaged values were within a very narrow mean±std range (i.e., T1=361±14ms; T2*=55±2ms). Figure 2 shows the scan-rescan measurements of these relaxation estimations on three phantoms. From this Figure, it can be postulated that at least some of the variance seen across phantoms can be attributed to scanner instabilities (the repeatability was assessed two weeks apart). Figure 3 shows the STD over time, SFNR and RDC for all nine phantoms, while Figure 4 shows the variance for the same parameters across 15 measurements of the same phantom. The variations in fBIRN metrics for all phantoms did not vary as a function of phantom. Except for SFNR, the variation observed in fBIRN metrics of an individual phantom over time showed a higher variation compared to the variations between fBIRN metrics of 9 phantoms.Discussion and Conclusion
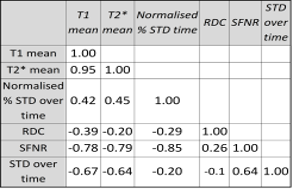
From this study, the following observations can be derived. First, it appears that all phantoms, made in four different batches, present with very reproducible relaxation times, indicating a very consistent gelling process. Moreover, a more thorough analysis of the interconnections between parameters (Table 1), shows that the phantoms relaxation values are correlated with fBIRN metrics, hinting at common origin for all variations, most likely SNR of the VFA acquisition and scanner instabilities themselves. An inverse correlation between T1 and T2* values and fBIRN metrics would otherwise have been found. In conclusion, this study opens the door to using such tests for direct inter-scanner comparison and independent assessment of stability from the phantom used.Acknowledgements
No acknowledgement found.References
- Glover GH, Mueller BA, Turner JA, et al. (2012) Function biomedical informatics research network recommendations for prospective multicenter functional MRI studies. J Magn Reson Imaging, 36, 39-54.
- Volz S, Noth U, Jurcoane A, et al. (2012) Quantitative proton density mapping: correcting the receiver sensitivity bias via pseudo proton densities. Neuroimage, 63, 540-52.
- Yarnykh VL (2007) Actual flip-angle imaging in the pulsed steady state: a method for rapid three-dimensional mapping of the transmitted radiofrequency field. Magn Reson Med, 57(1), 192-200.
- Friedman L, Glover GH, fBIRN Consortium (2006) Reducing interscanner variability of activation in a multicenter fMRI study: controlling for signal-to-fluctuation-noise-ratio (SFNR) differences. Neuroimage, 33, 471-81.
- Weisskoff RM. (1996) Simple measurement of scanner stability for functional NMR imaging of activation in the brain. Magn Reson Med, 36, 643-5.
Figures