4833
Simultaneous R2* Relaxometry and Dixon Imaging of Liver and Kidney at 3T Using Bilateral Orthogonality Generative Acquisitions Method1UT Southwestern Medical Center, Dallas, TX, United States
Synopsis
Keywords: Whole Body, Body, liver, kidney, parallel transmission, Dixon imaging
Motivation: Improving the quality of body R2*( T2* ) images by removing transmit field inhomogeneity while utilizing Dixon imaging in body at 3T.
Goal(s): Implementation of Bilateral Orthogonality Generative Acquisitions method for simultaneously obtaining homogeneous R2*( T2* ) and Dixon imaging fro kidney and liver at 3T.
Approach: Bilateral Orthogonality Generative Acquisitions method was improved to include phase effect that enables the use of Dixon Imaging. Multi-echo acquisitions are utilized for R2* estimation.
Results: Implementation of Bilateral Orthogonality Generative Acquisitions method enables the simulataneous R2*( T2* ) and Dixon imaging and eliminates the central brightnening effect.
Impact: Simultaneous homogeneous R2*( T2* ) and Dixon imaging is implemented within same scan time required for Dixon imaging while removing the central brightening effect in body imaging at 3T.
Introduction
R2*(T2*) contrast is commonly utilized for diagnostics in liver and kidney using-multi echo gradient echo (GRE) acquisitions1-5. Previously, Dixon imaging along with the R2*(T2*) relaxometry was utilized for liver imaging3-5.In this work, Bilateral Orthogonality Generative Acquisitions (BOGA) method6 was implemented at a 3T scanner with a dual channel transmit body coil and adapted for simultaneous R2*(T2*) relaxometry and Dixon imaging in order to obtain homogeneous images without the central brightening effects due to the transmit field, B1+, inhomogeneity.
Theory
The original BOGA method6 requires 4 small angle GRE acquisitions denoted as circularly polarized (CP) mode image $$$S_1={\rho}E^*_{2,2}(q_1+q_2)\beta$$$ , adding a transmit phase of 180° to the first transmit channel to achieve an orthogonal excitation pattern $$$S_2={\rho}E^*_{2,2}(-q_1+q_2)\beta$$$ and two single channel transmit acquisitions $$$S_{3,4}={\rho}E^*_{2,1}(q_{1,2})\beta$$$. For Dixon encoding two GRE images with a phase difference between water and fat, is required. Combining both methods introducing an optimum $$${\Delta}TE$$$ for water and fat separation between S1,2 and S3,4 two intermediate images can be computed as follows6:$$C=\begin{bmatrix}C_1\\C_2\end{bmatrix}=\begin{bmatrix}S_3^*&S_4\\S_4^*&-S_3\end{bmatrix}\begin{bmatrix}S_1\\S_2^*\end{bmatrix}={\rho}^2E^*_{2,1}E^*_{2,2}\begin{bmatrix}q_1^*{\beta}&q_2{\beta}\\q_2{\beta}^*&-q_1{\beta}\end{bmatrix}\begin{bmatrix}e^{i\gamma}&0\\0&e^{-i\gamma}\end{bmatrix}\begin{bmatrix}q_1&q_2\\q_2^*&-q_1^*\end{bmatrix}\begin{bmatrix}{\beta}\\{\beta}\end{bmatrix}={\rho}^2E^*_{2,1}E^*_{2,2}{\beta}^2\begin{bmatrix}{|q_1|^2e^{i\gamma}+|q_2|^2e^{-i\gamma}+(e^{i\gamma}-e^{-i\gamma})q_1^*q_2}\\{|q_1|^2e^{-i\gamma}+|q_2|^2e^{i\gamma}+(e^{i\gamma}-e^{-i\gamma})q_1q_2^*}\end{bmatrix}$$Similarly, a complimentary set of intermediary images can also be written as follows:$$D=\begin{bmatrix}D_1\\D_2\end{bmatrix}=\begin{bmatrix}S_3^*&-S_4\\S_4^*&S_3\end{bmatrix}\begin{bmatrix}S_1\\S_2^*\end{bmatrix}={\rho}^2E^*_{2,1}E^*_{2,2}\begin{bmatrix}q_1^*{\beta}&-q_2{\beta}\\q_2{\beta}^*&q_1{\beta}\end{bmatrix}\begin{bmatrix}e^{i\gamma}&0\\0&e^{-i\gamma}\end{bmatrix}\begin{bmatrix}q_1&q_2\\q_2^*&-q_1^*\end{bmatrix}\begin{bmatrix}{\beta}\\{\beta}\end{bmatrix}={\rho}^2E^*_{2,1}E^*_{2,2}{\beta}^2\begin{bmatrix}{|q_1|^2e^{i\gamma}-|q_2|^2e^{-i\gamma}+(e^{i\gamma}+e^{-i\gamma})q_1^*q_2}\\{-|q_1|^2e^{-i\gamma}+|q_2|^2e^{i\gamma}+(e^{i\gamma}+e^{-i\gamma})q_1q_2^*}\end{bmatrix}$$ $$$\gamma=2\pi{\Delta}B_0{\Delta}TE$$$ is the phase accumulated between echoes, $$${\Delta}B_0$$$ denotes the main field inhomogeneity, $$${\Delta}TE$$$ denotes the difference between echo times, $$$q$$$ denotes the channel effects, $$$\beta$$$ is the flip angle and $$$E_2^*$$$ is the $$$T_2^*$$$ decay. Using these intermediate images C and D and defining $$$E=S_3^*S_3+S_4^*S_4$$$ , homogeneous final images $$$I$$$ with accumulated phase can be calculated as $$$F=0.25(C_1+D_1+C_2+D_2+(C_1-D_1+C_2-D_2)^*)$$$ and $$$I=F/E$$$.For Dixon imaging, a normalized complex ($$$F^N$$$ ) combined image, represents the phase encoding acquired to distinguish water and fat due to their chemical shift difference. Complex water and fat masks, denoted as $$$WM$$$ and $$$FM$$$ respectively, are then calculated as $$$WM=0.5(1+F^N)$$$ and $$$FM=0.5(1-F^N)$$$ . Since fat and water content does not change between echoes and same masks can be used for every echo for obtaining water only and fat only images and R2* images.
By applying BOGA method to every echo except the first one and the logarithmic identities, R2* is estimated without exponential fitting as follows using N echoes. $$$M_k$$$ denotes the mask for water only and fat only images, for the joint image it is 1. $$$K=0.5N(N-1)$$$ is the total duration for the R2* decay from all echoes.$$R^*_{2,s}=\frac{1}{K}\sum^N_{i=2}-(i-1)(ln(|M_kF_i|)-ln(|M_k|^2E|))$$
Methods
For the acquisition of the data, a 3T Philips Healthcare Achieva human MRI system with two transmit channel body coil is used along with the large body surface receive coil. For a healthy volunteer, two multi-echo 3D spoiled GRE acquisitions with breath holding were acquired with voxel size of 2x2x5 mm, 224x224x5 acquisition matrix and 5o flip angle. $$$TE1/{\Delta}TE/TR=1.1/1.2/16$$$ ms with 2 averages and 12 echoes. Transversal and coronal slice orientation is used for liver and kidney acquisitions respectively. Total scan time for the data is 30 seconds. First echoes of each GRE acquisitions are used for calculating S3 and S4,whereas other echoes used as S1 and S2.Results
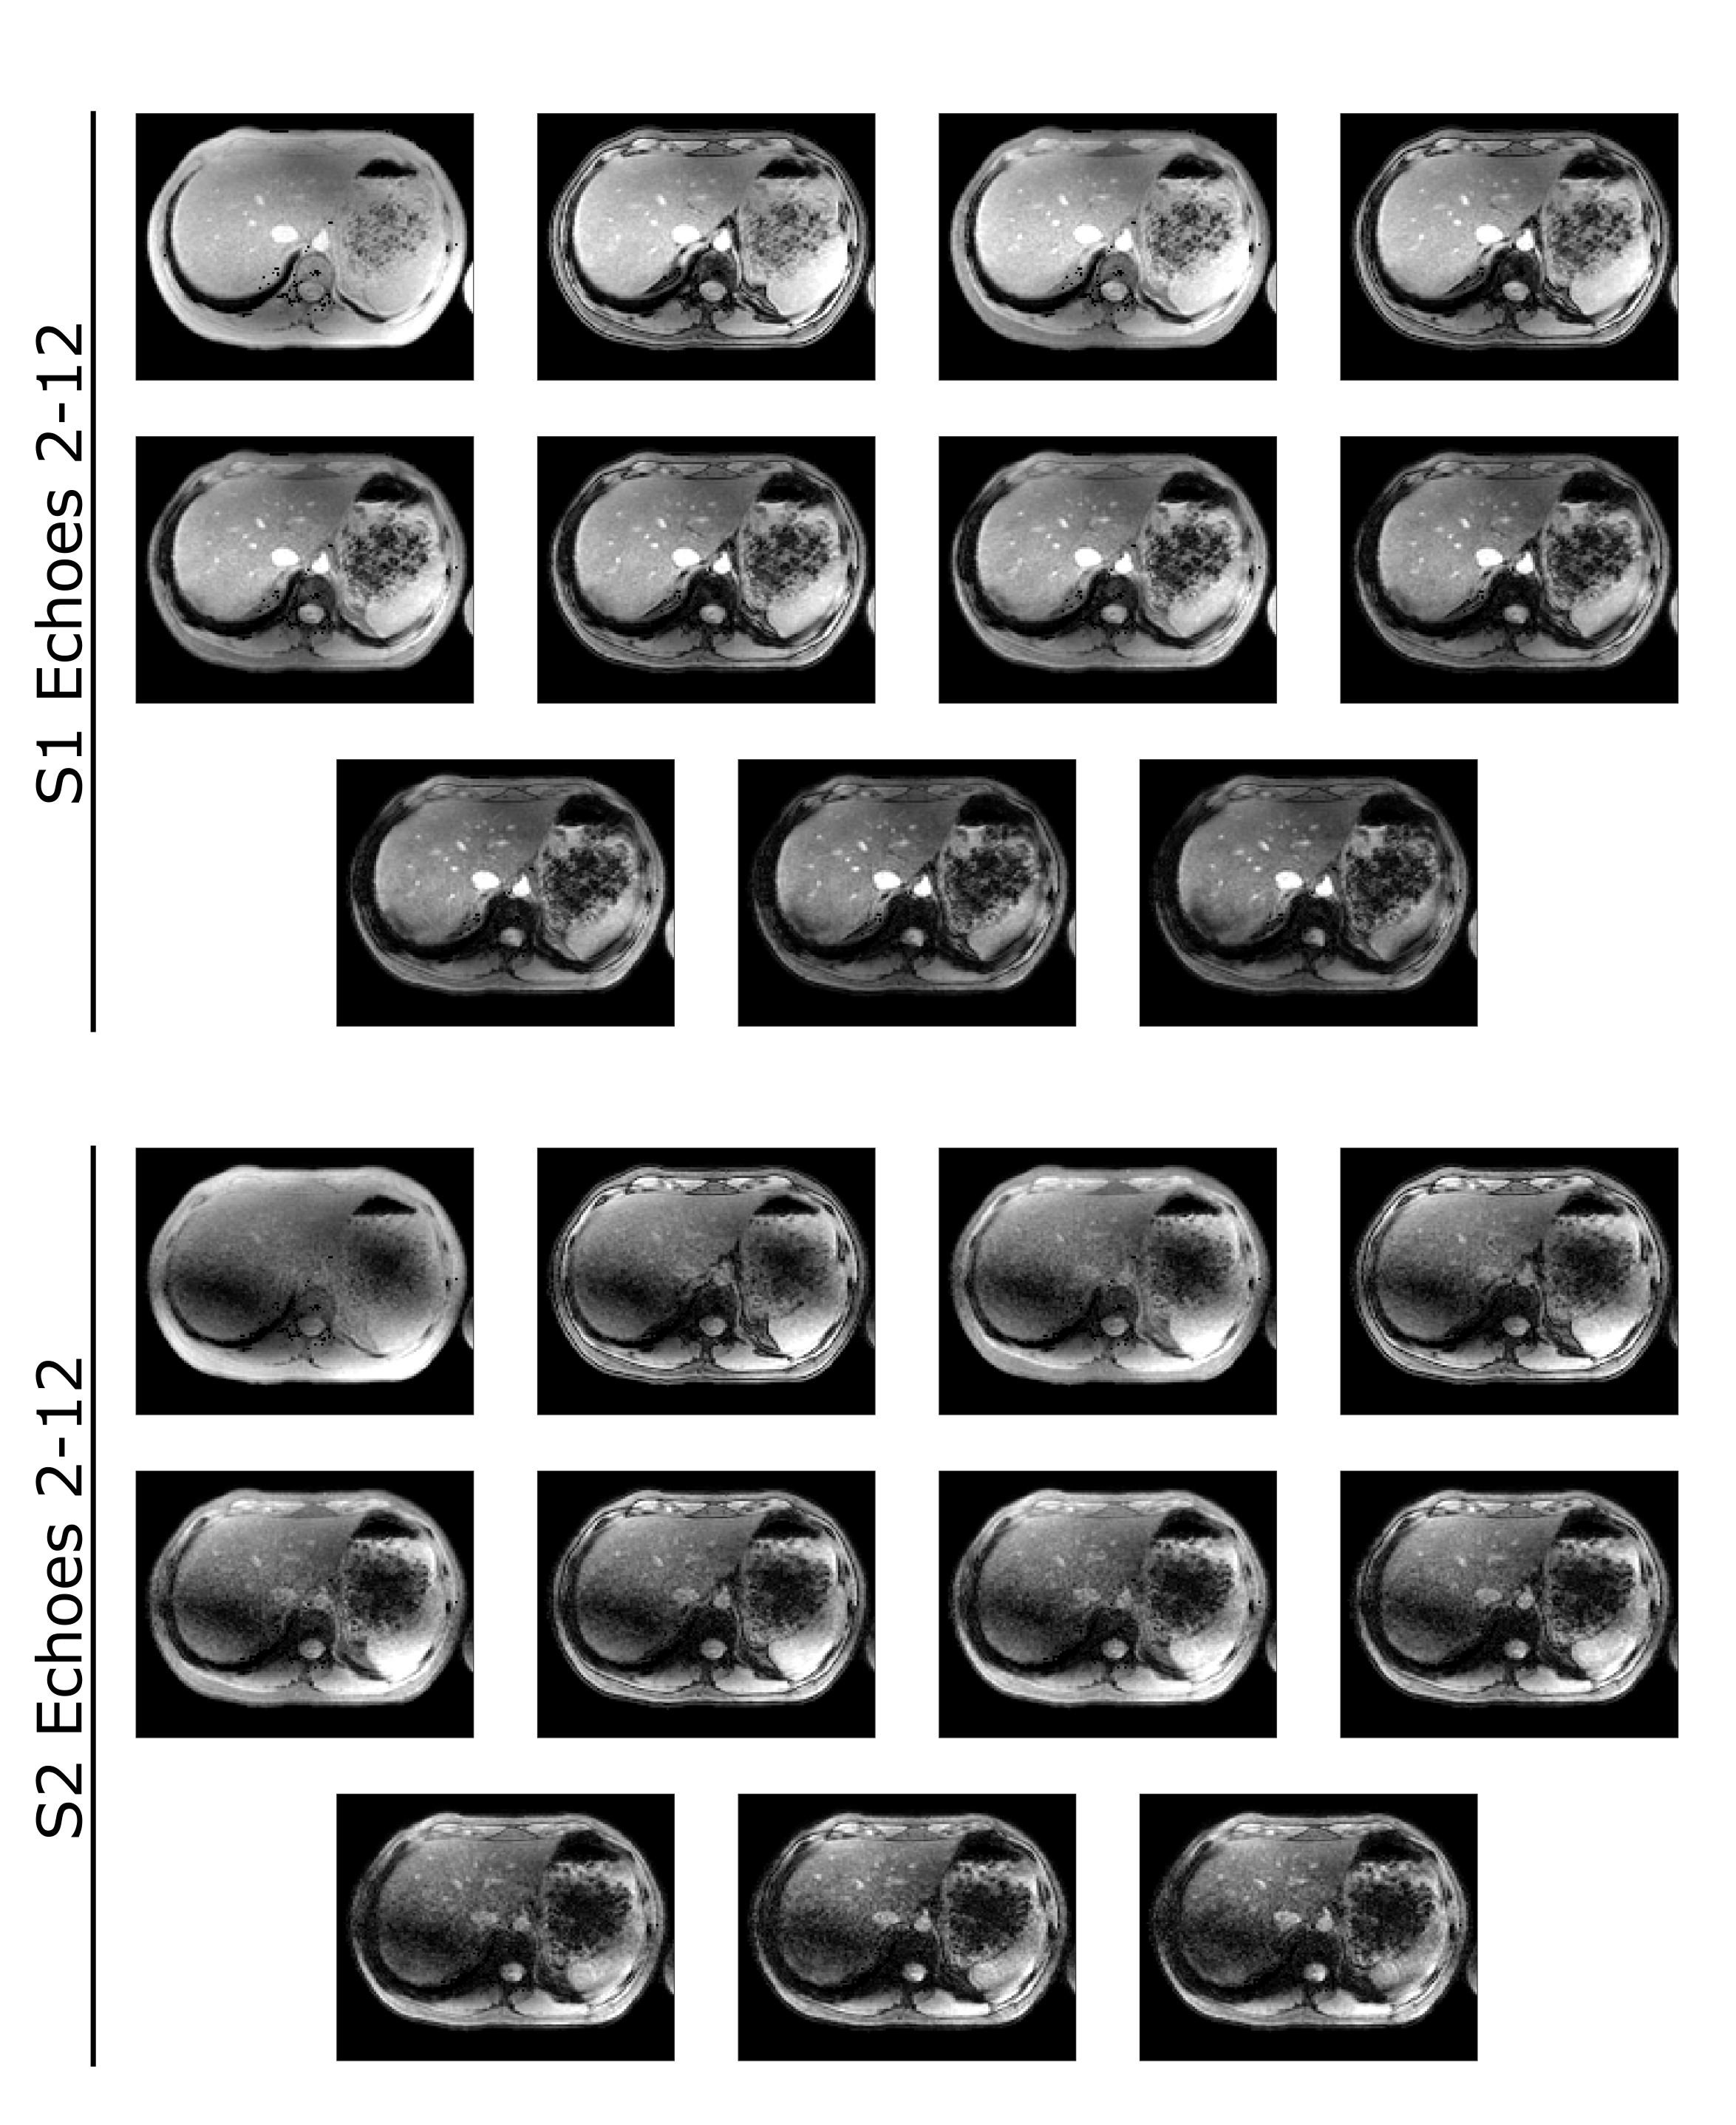
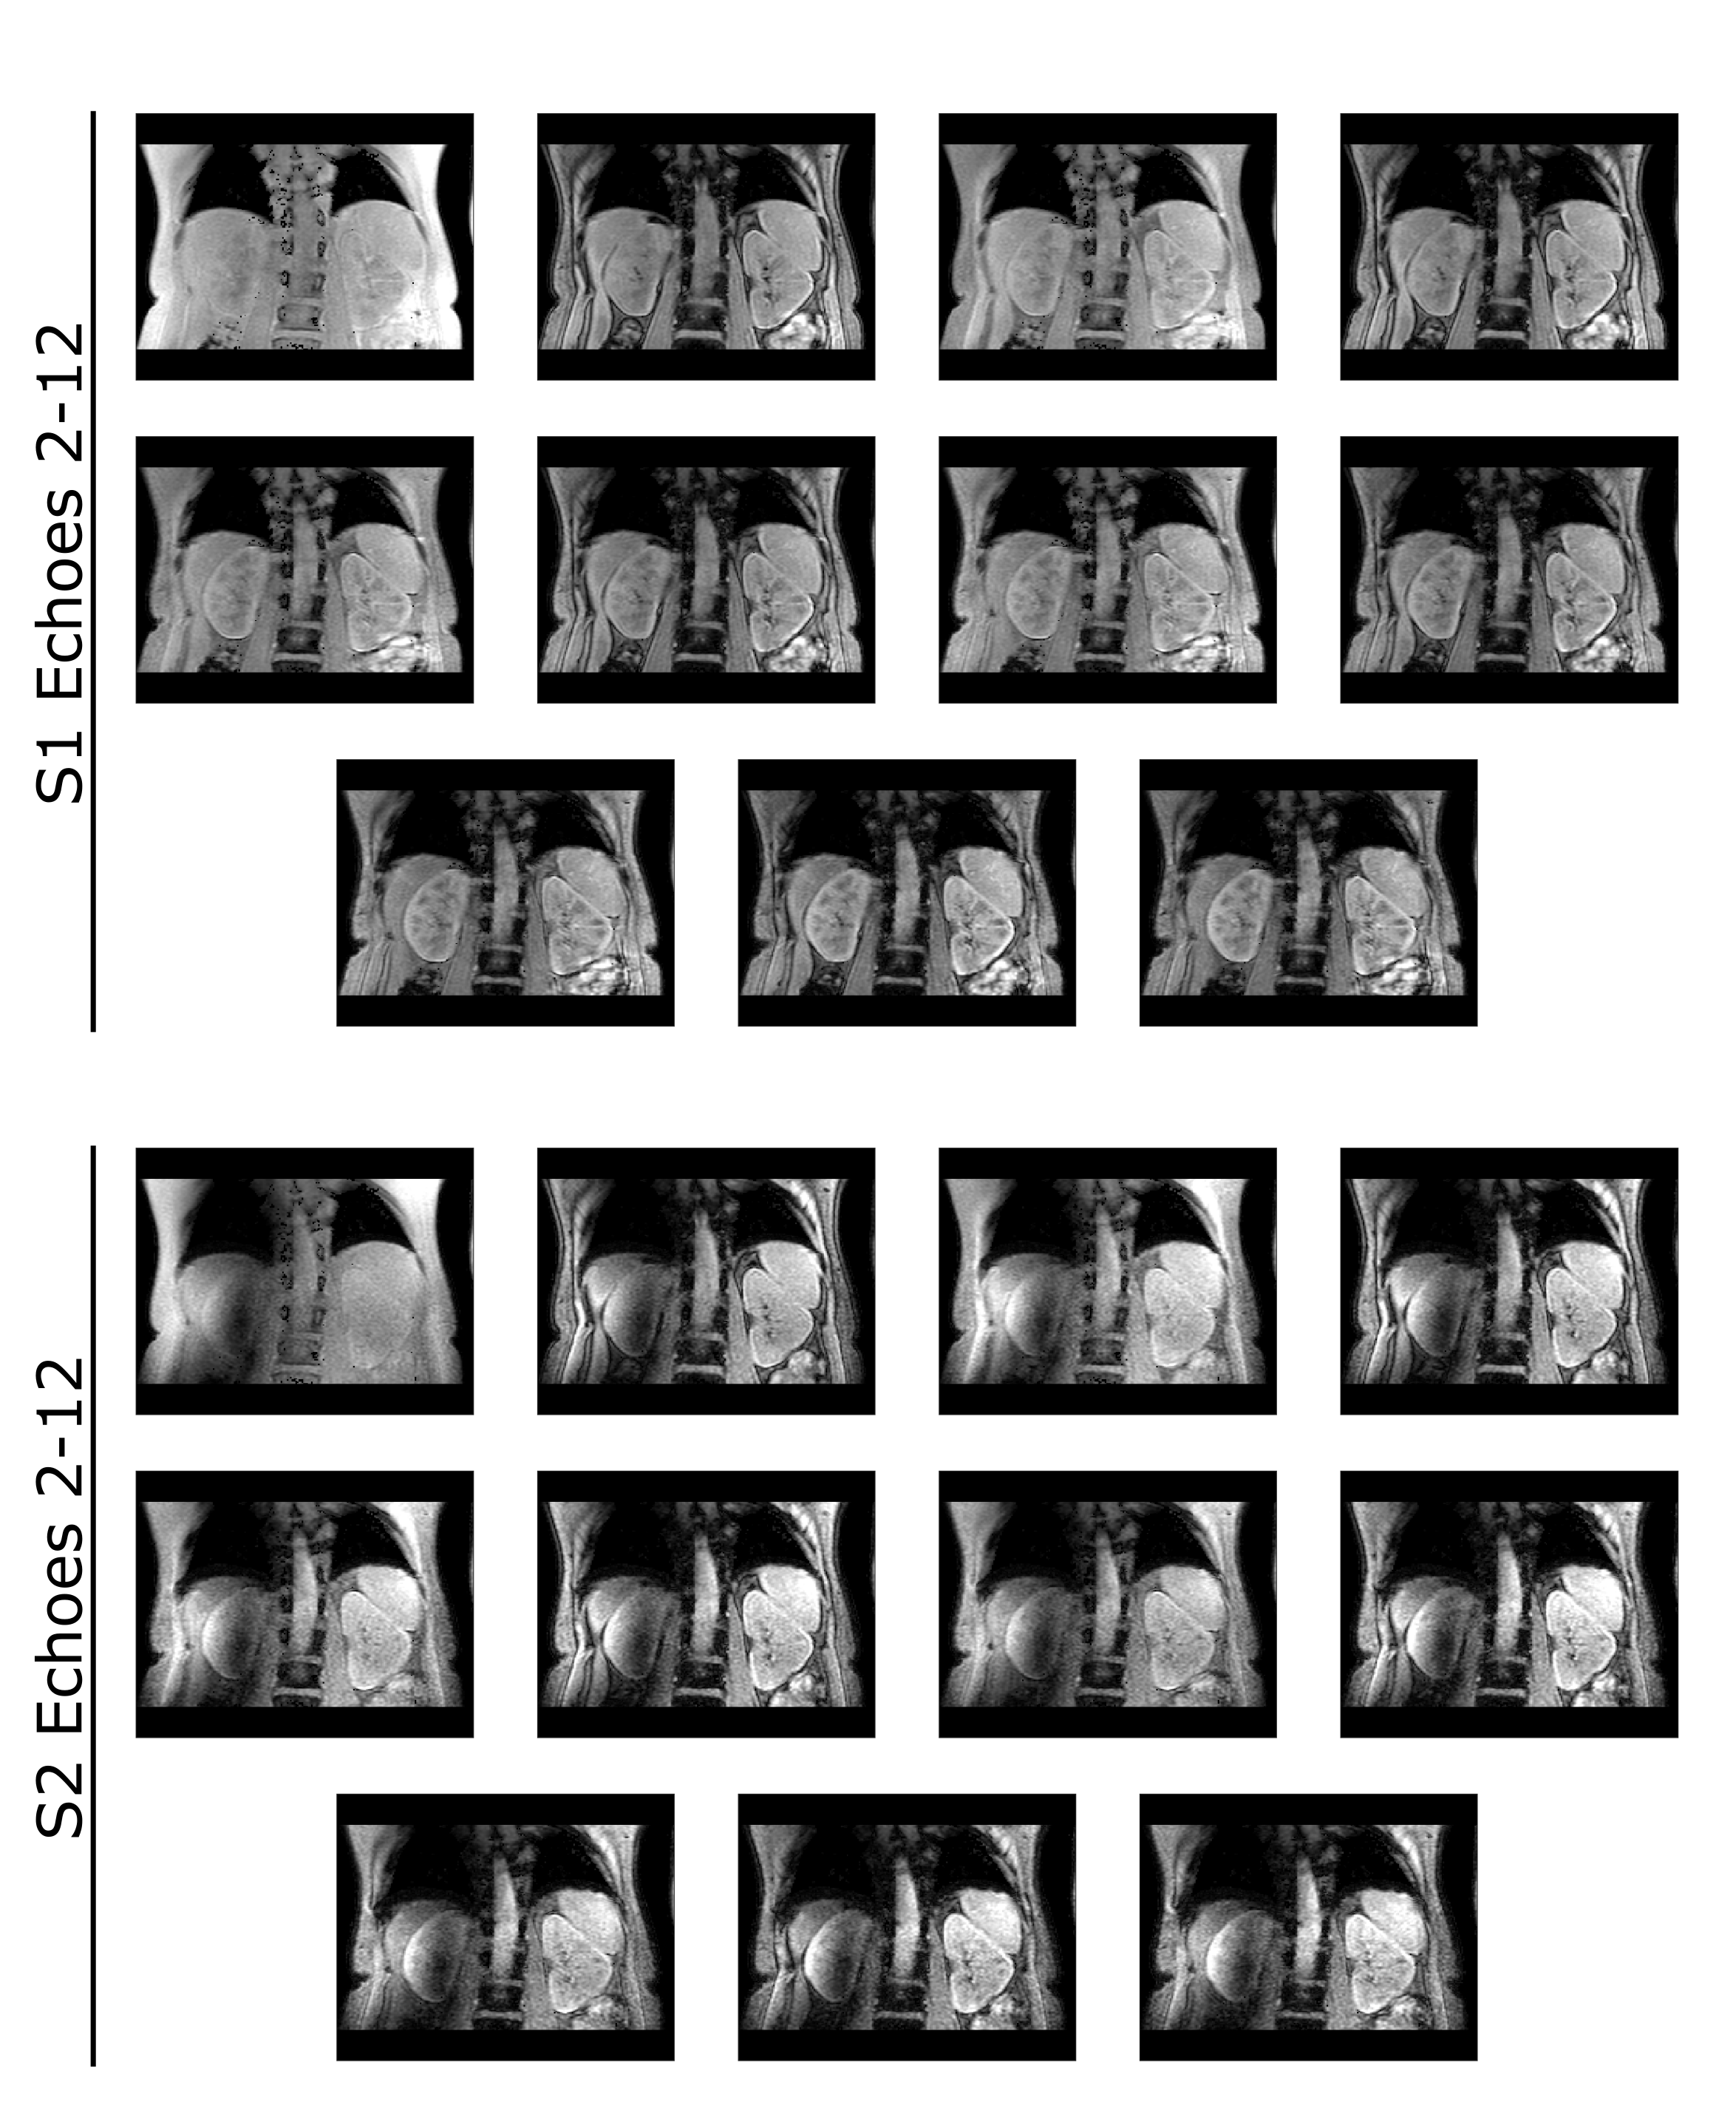
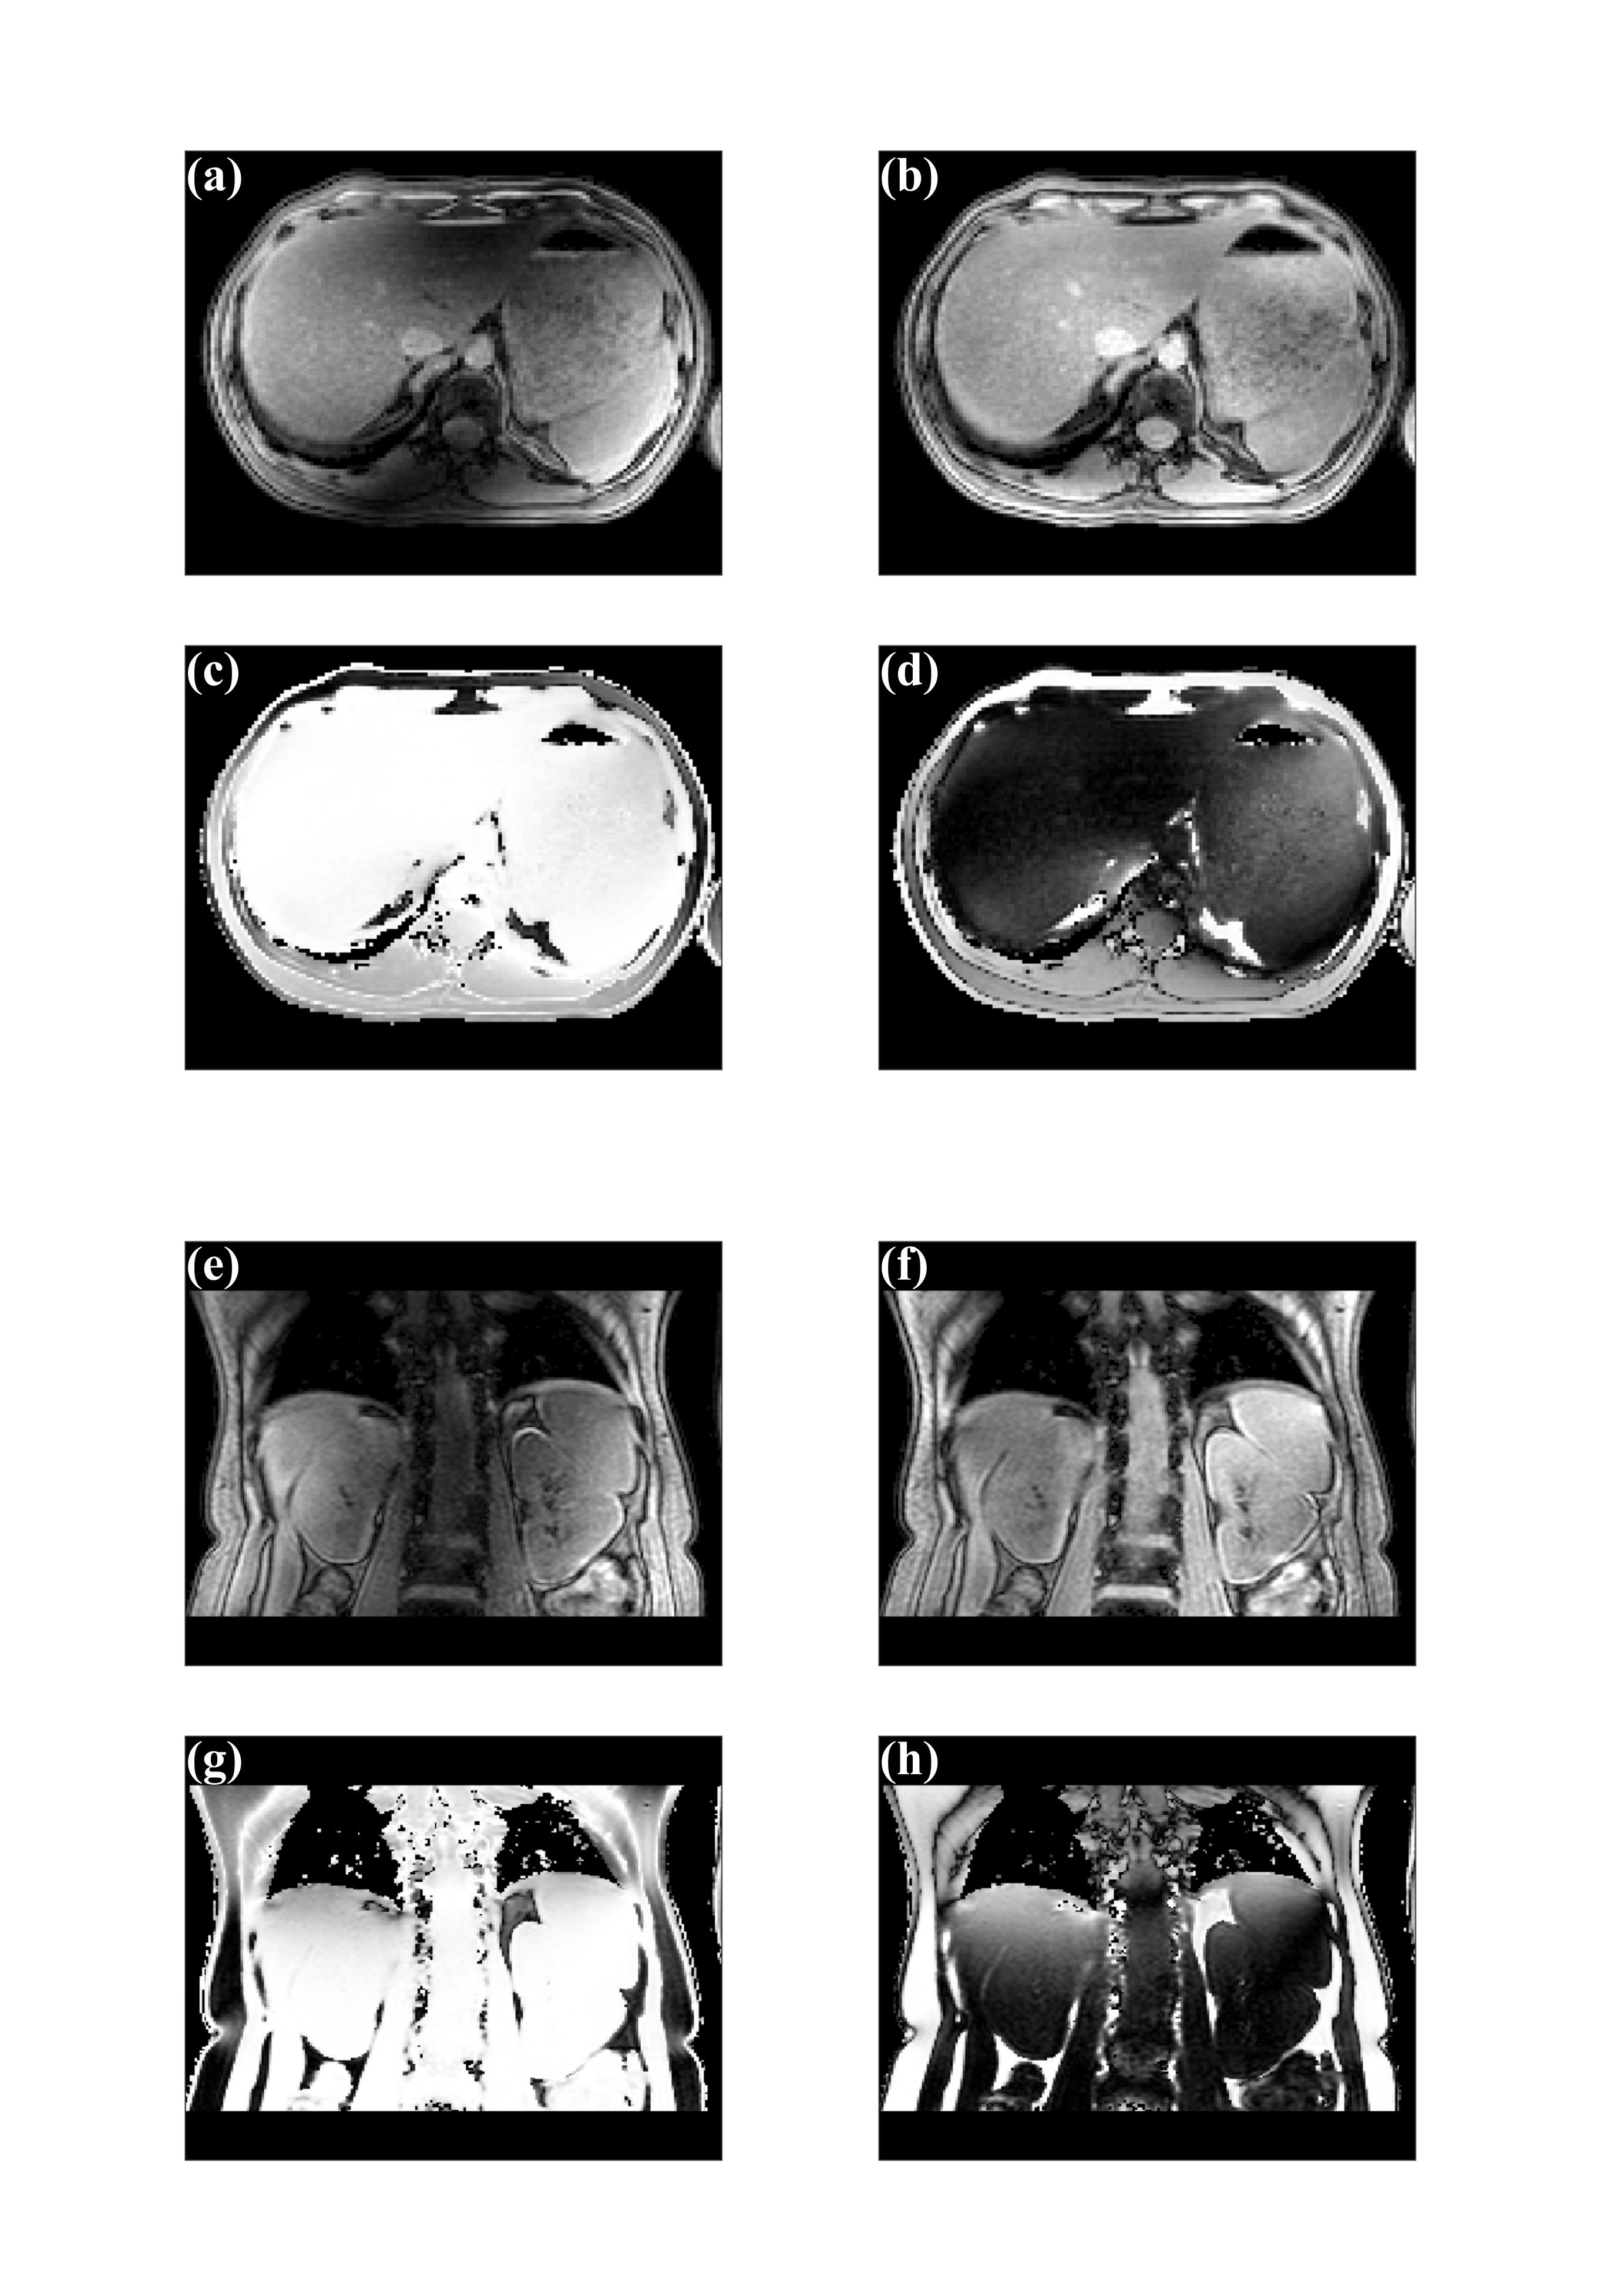
In Figure 1 and 2, 11 echoes of the GRE acquisitions that are used as S1 and S2 for the BOGA method are given. Using these images homogeneous T2* images are obtained and R2* are estimated. Figure 3, illustrates the single channel images S3 (a, e) and S4 (b, f) (shortest TE) used for obtaining the homogeneous images in combination with S1 and S2. Calculated water only and fat only masks for Dixon imaging are presented in (c) and (d) respectively. These figures indicate a shimming problem prominent in the right side of the body, which results inaccuracies in the water and fat masks.In Figure 4, magnitude of the homogeneous T2* images are shown for echoes 2 to 12. Compared to the conventional CP mode images in Figure 1 block, images in Figure 3 are free of central brightening and present pure T2* weighted contrast.
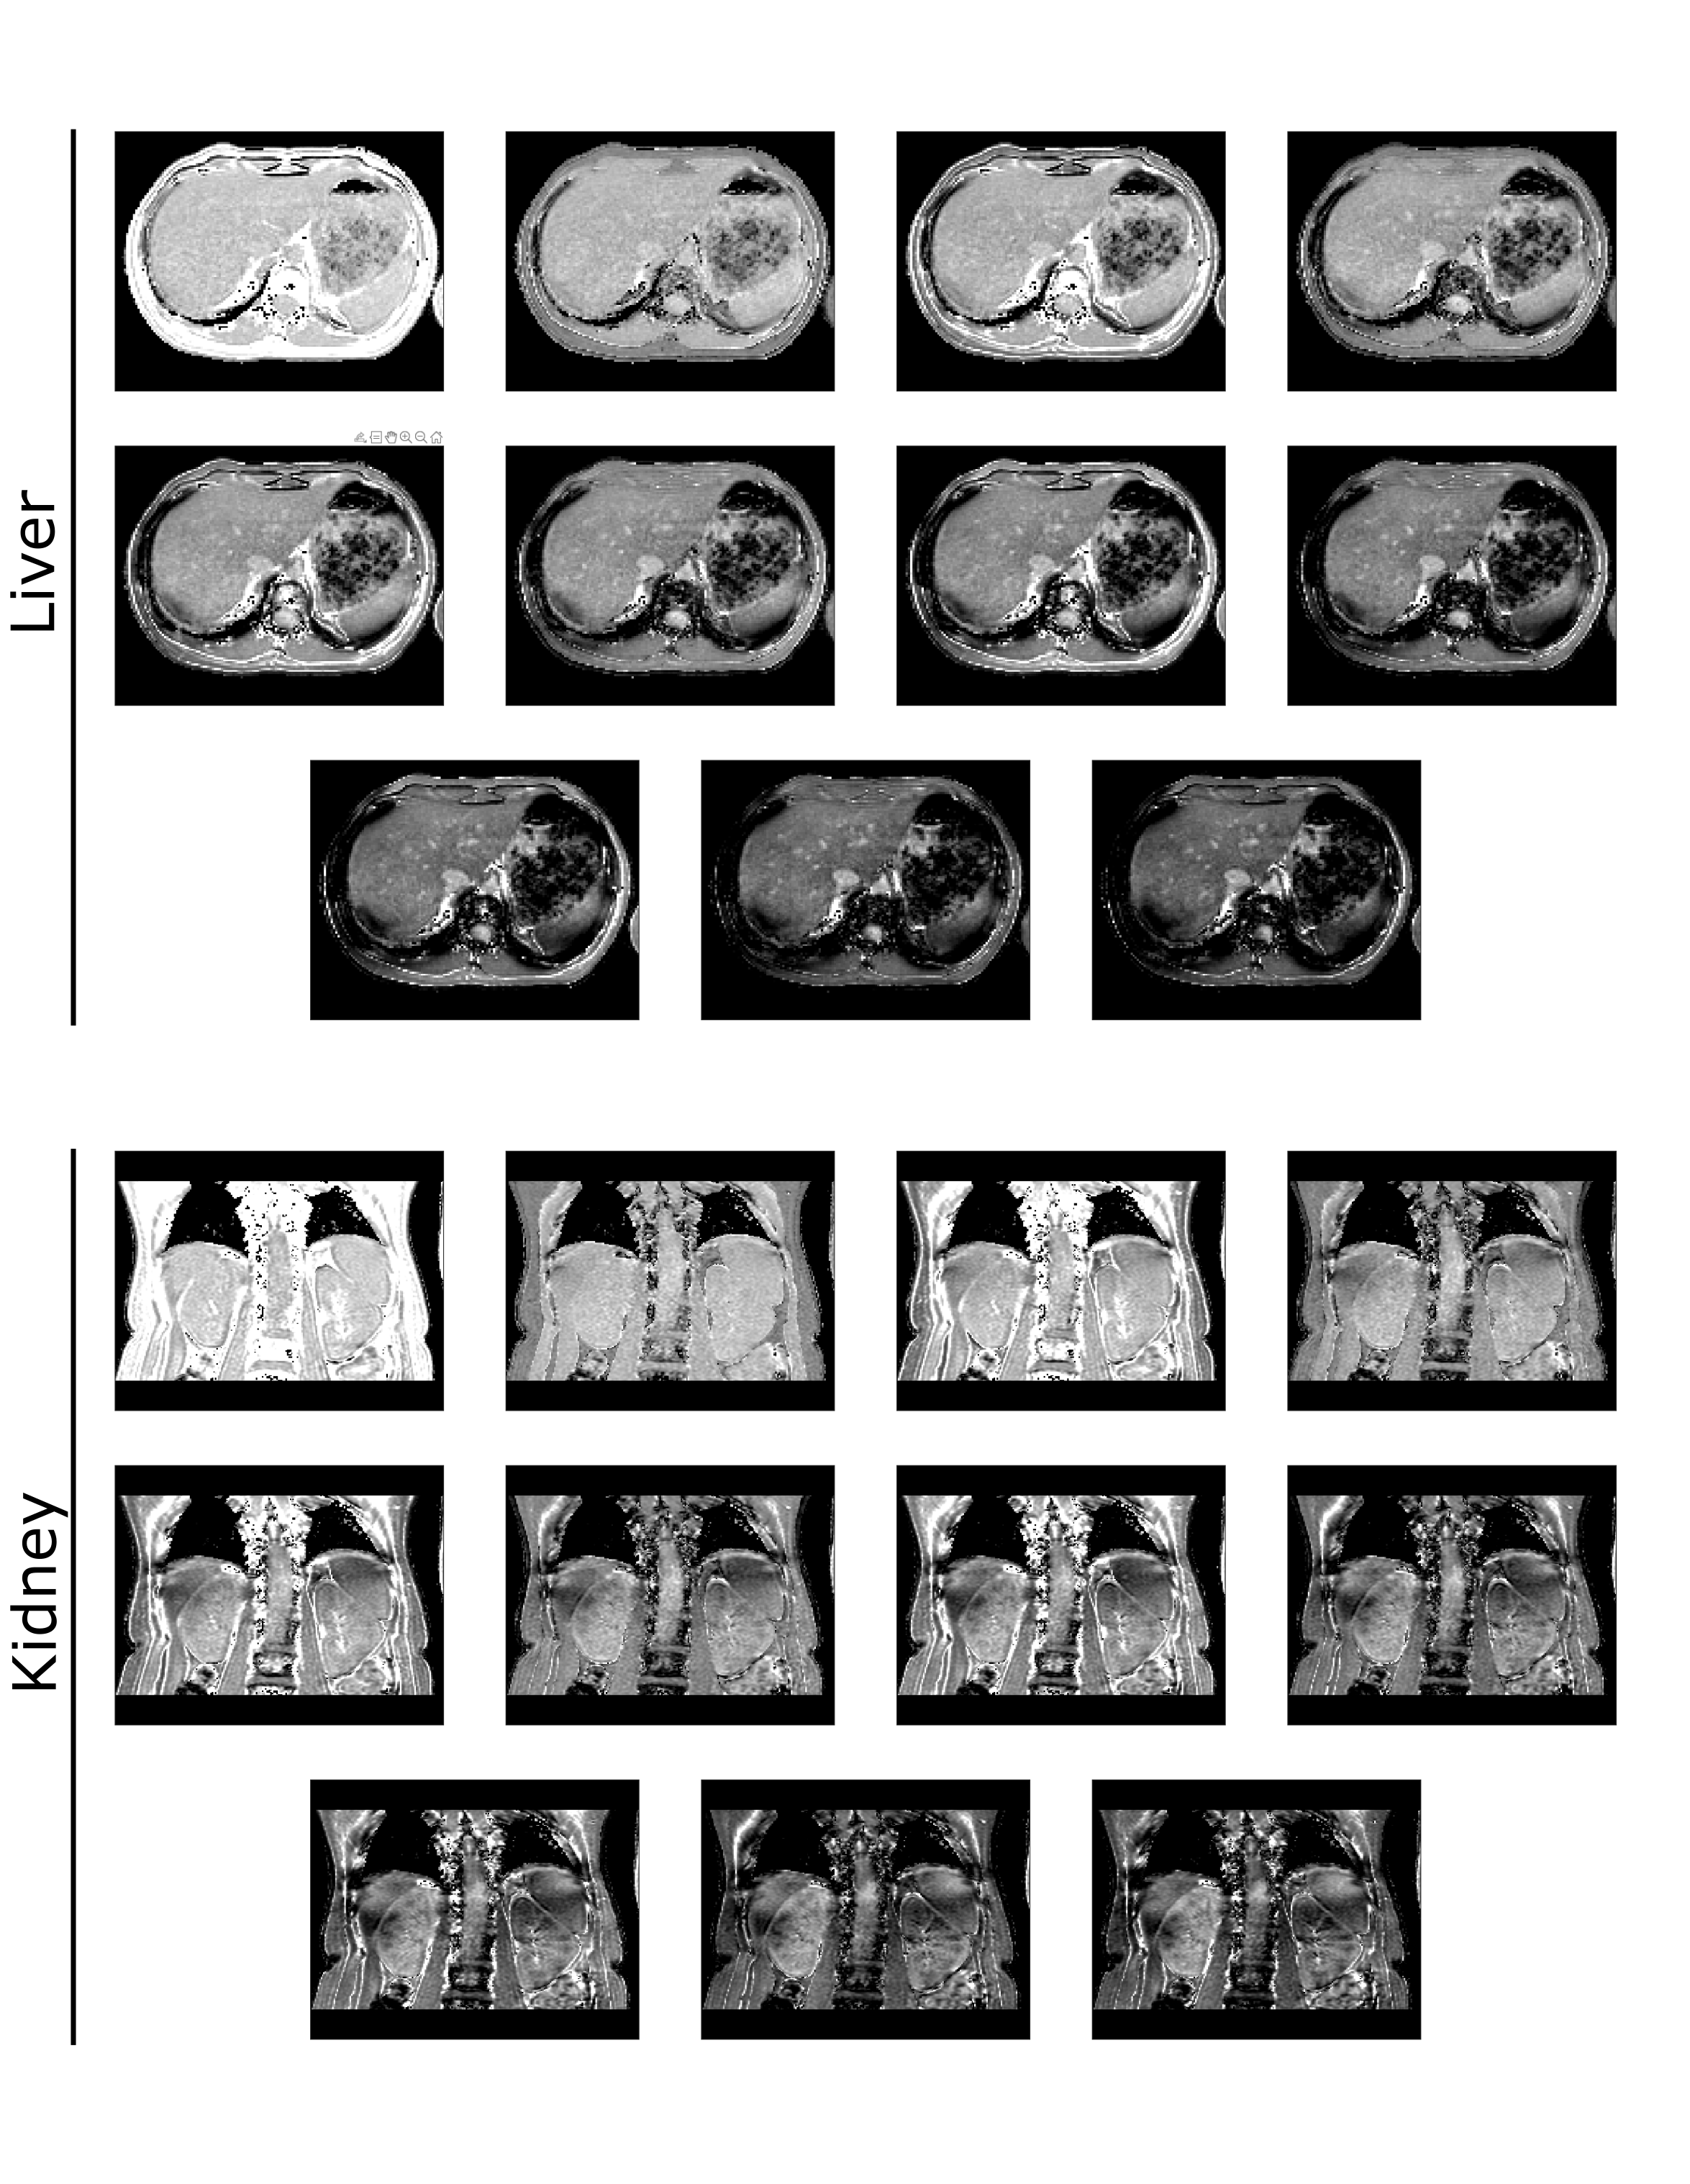
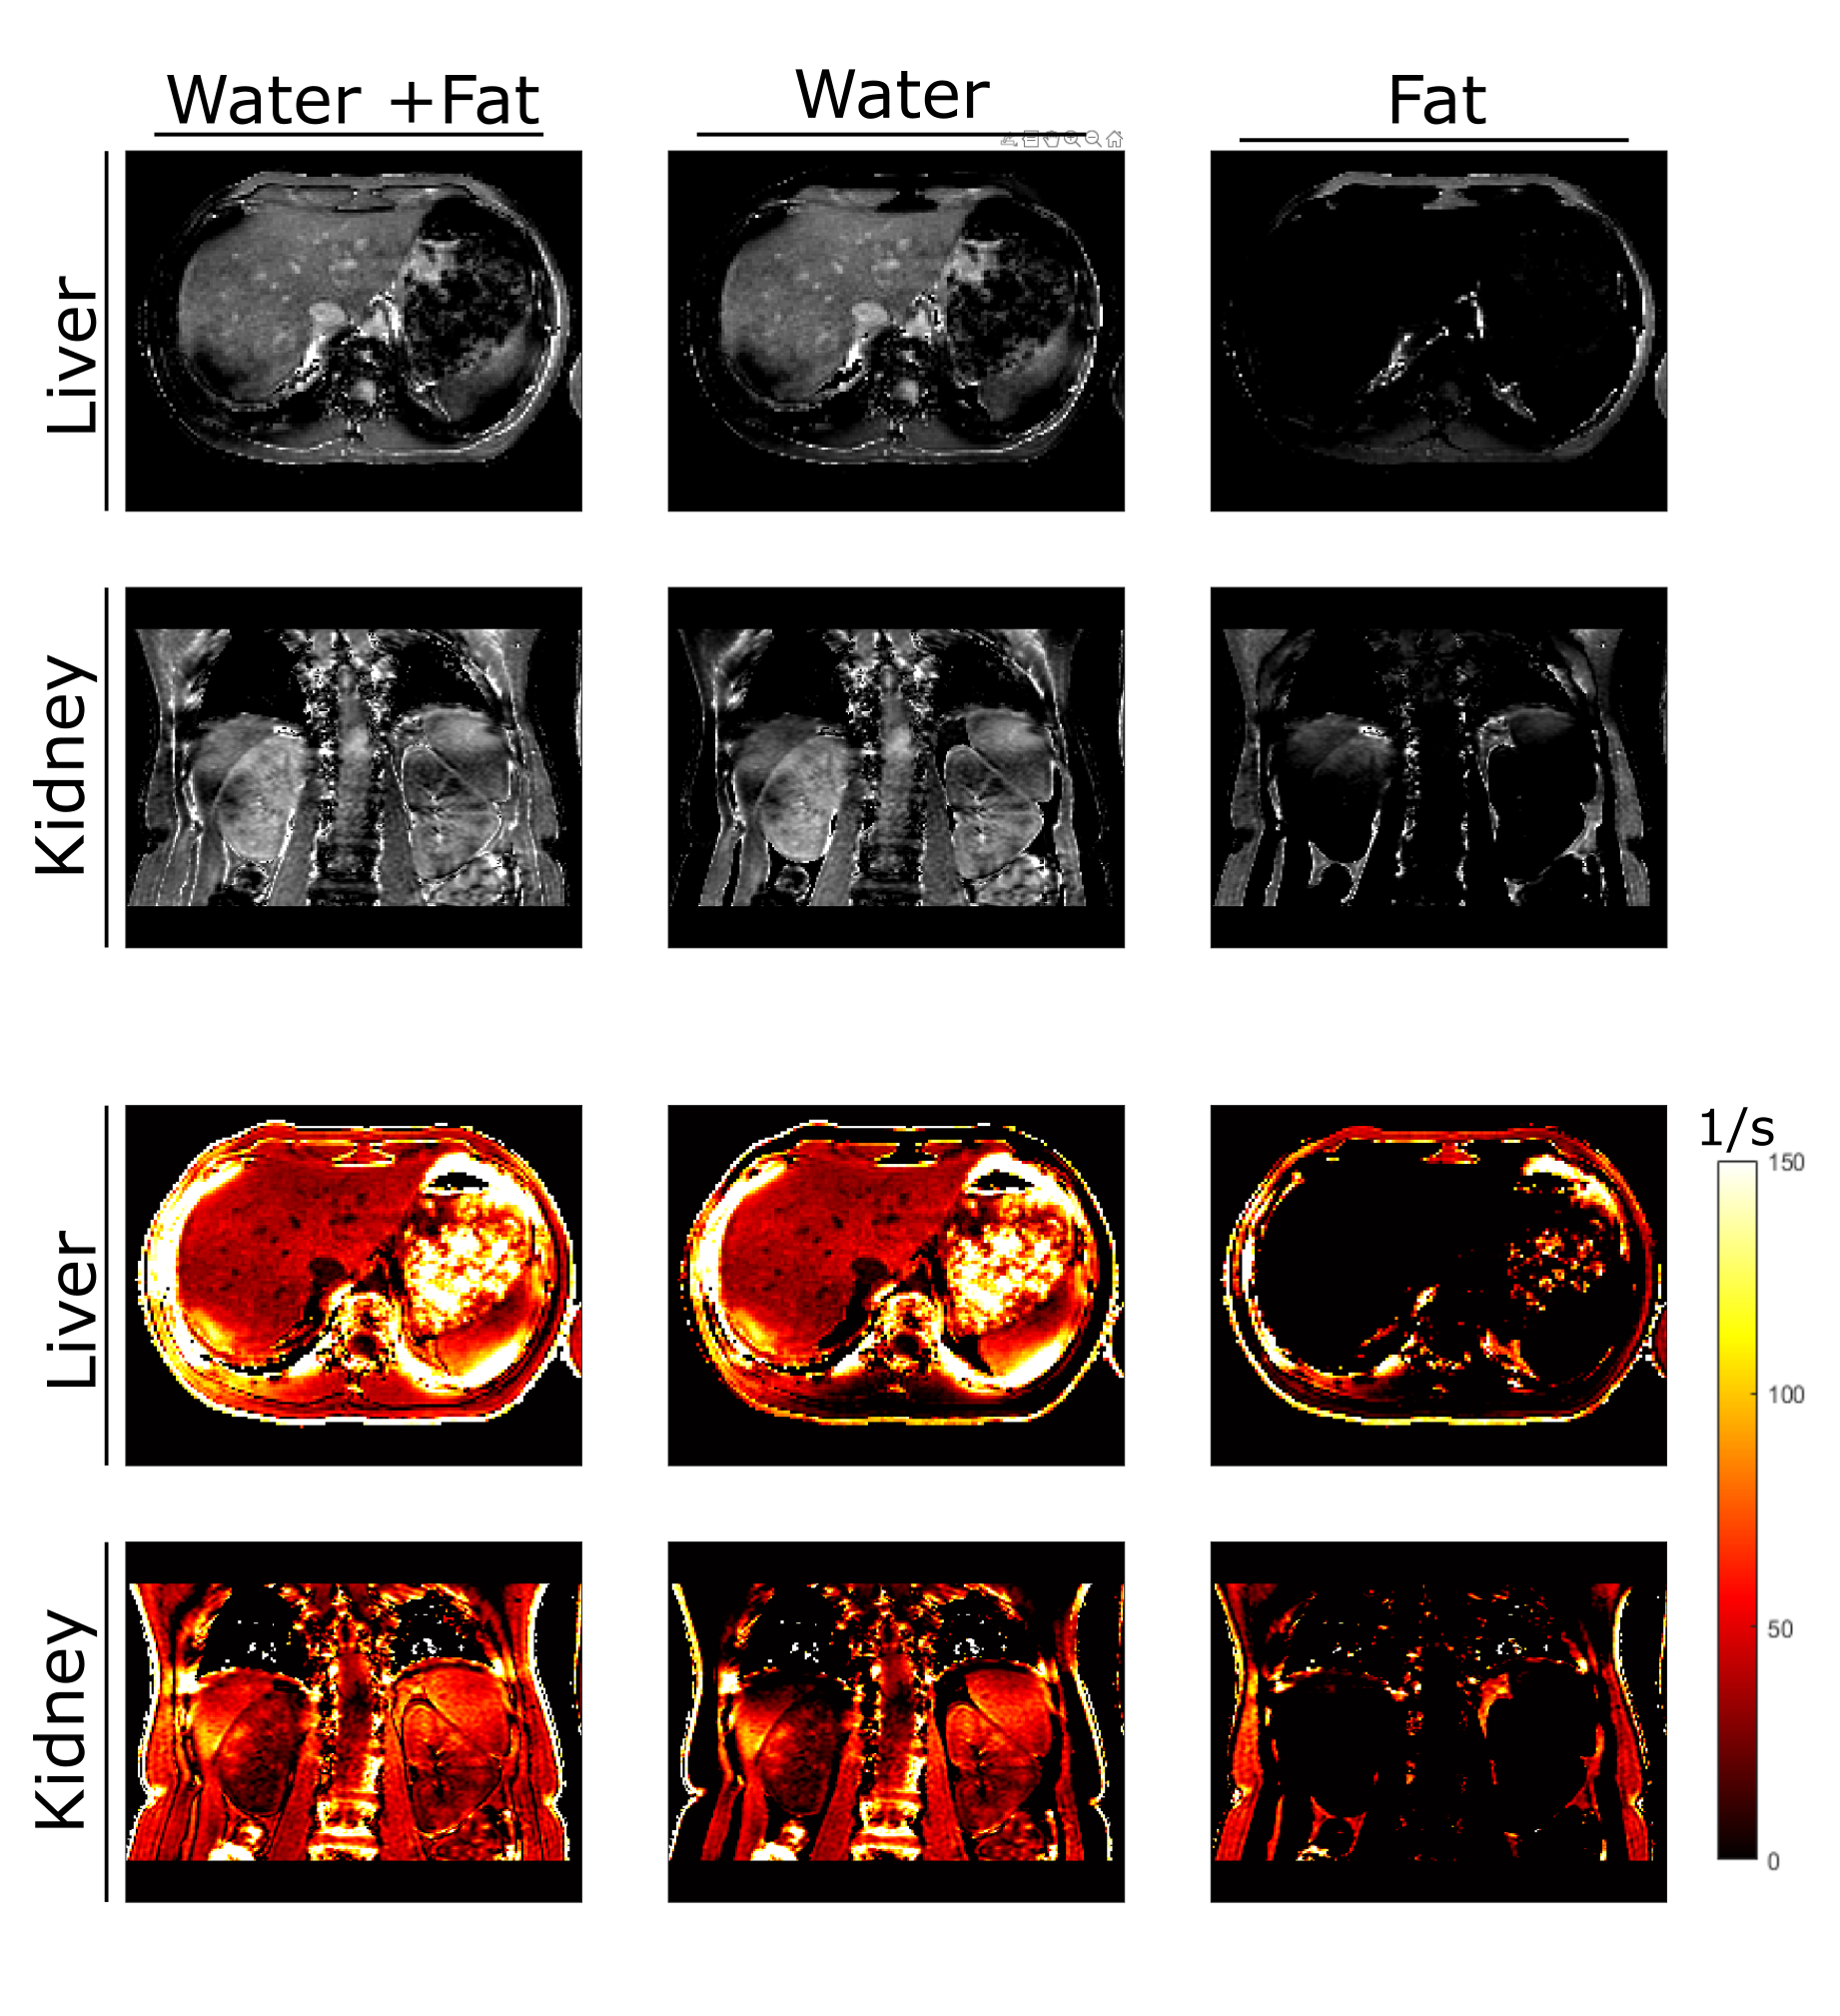
In Figure 5, images without Dixon imaging, water only and fat only images are presented for liver and kidneys using the 12th echo.Clear difference between water only and fat only images can be observed. Calculated R2* images, with and without Dixon imaging, using the 11 echoes for each slice are shown in Figure 5 second block.
Discussion and Conclusion
In this work, it is shown that the BOGA method, which was introduced for 7T MRI system and used for whole brain imaging, can be utilized in body imaging at a 3T system with a dual channel body coil for homogeneous T2* image contrast, R2* estimation and Dixon imaging as it is demonstrated in liver and kidneys. As future work, shimming will be improved to counteract the inaccuracies in the water and fat masks.Acknowledgements
This work was performed in the Advance Imaging Research Center at University of Texas Southwestern Medical center Dallas. This work was supported by Cancer Prevention and Research Institute of Texas (CPRIT) grant / RR180056.References
1. Li C, Liu H, Li X, Zhou L, Wang R, Zhang Y. Application of BOLD-MRI in the classification of renal function in chronic kidney disease. Abdominal Radiology. 2018;44(2):604-611. doi:https://doi.org/10.1007/s00261-018-1750-6
2. Li L, Thacker J, Li W, et al. Medullary Blood Oxygen Level-Dependent MRI Index (R2*) is Associated with Annual Loss of Kidney Function in Moderate CKD. American Journal of Nephrology. 2020;51(12):966-974. doi:https://doi.org/10.1159/000512854
3. Serai SD, Smith EA, Trout AT, Dillman JR. Agreement between manual relaxometry and semi-automated scanner-based multi-echo Dixon technique for measuring liver T2* in a pediatric and young adult population. Pediatric Radiology. 2017;48(1):94-100. doi:https://doi.org/10.1007/s00247-017-3990-y
4. Sudhir Bhimaniya, Arora J, Sharma P, Zhang Z, Khanna G. Liver iron quantification in children and young adults: comparison of a volumetric multi-echo 3-D Dixon sequence with conventional 2-D T2* relaxometry. Pediatric Radiology. 2022;52(8):1476-1483. doi:https://doi.org/10.1007/s00247-022-05352-4.
5. Hu F, Yang R, Huang Z, et al. 3D Multi-Echo Dixon technique for simultaneous assessment of liver steatosis and iron overload in patients with chronic liver diseases: a feasibility study. Quantitative imaging in medicine and surgery. 2019;9(6):1014-1024. doi:https://doi.org/10.21037/qims.2019.05.20
6. Boga C and Henning A. “Bilateral Orthogonality Generating Acquisitions Method for Homogeneous T2* Images Using Dual Channel Parallel Transmission at 7T” In Proceedings of the 31th Annual Meeting of ISMRM, Toronto, Canada, 2023
Figures