4831
An In-Depth Analysis of Liver Fat Quantification Using 5T MRI: A Comparative Study with 1.5T MRI MRS-PDFF1Shandong Provincial Third Hospital, Jinan, China, 2United Imaging Research Institute of Intelligent Imaging, Beijing, China, 3Shanghai United Imaging Healthcare Co., Shanghai, China, 4Shenzhen Institutes of Advanced Technology, Chinese Academy of Sciences, Shenzhen, China
Synopsis
Keywords: High-Field MRI, High-Field MRI, Fat & Fat/Water Separation
Motivation: Nonalcoholic fatty liver disease (NAFLD) is an escalating health issue, necessitating precise noninvasive measurement of hepatic steatosis.
Goal(s): To evaluate the feasibility and accuracy of 5T magnetic resonance spectroscopy (MRS) for in vivo liver fat quantification.
Approach: The study utilized phantoms with controlled fat content and 20 volunteers, comparing proton density fat fraction (PDFF) values measured by 5T MRS against those from 1.5T MRS.
Results: The 5T MRS demonstrated strong consistency with 1.5T measurements, validating its potential in clinical diagnostics despite technical challenges associated with ultra-high-field MRI applications.
Impact: The study's validation of 5T MRS for liver fat quantification could enhance diagnostic precision for liver conditions, influencing clinical practices and guiding future technological advancements in MRI diagnostics.
Introduction
The liver is central to lipid metabolism, and its dysfunction, evidenced by abnormal triglyceride storage, is the crux of nonalcoholic fatty liver disease (NAFLD)—a growing precursor to liver cancer in China. Magnetic resonance spectroscopy (MRS) has advanced as a premier, noninvasive tool for quantifying liver lipids, standing out for its accuracy when compared to liver biopsies. Particularly, 1H-MRS at clinical field strengths (1.5-3.0 T) is celebrated for its ability to detect and quantify hepatic fat. Despite some resolution limits, ultra-high-field MRS promises greater detail but introduces technical complexities. This study leverages 5T ultra-high-field 1H-MRS to determine the proton density fat fraction (PDFF) in the liver against phantom models, with a focus on how the 5T system's measurements compare to those at 1.5T, thereby evaluating its efficacy for liver fat quantification.Method
This study utilized phantoms and 20 healthy volunteers, encompassing a balanced gender distribution, aged 19-68, with BMIs from 17.9 to 31.4. Phantoms were prepared with varying water-to-fat ratios, from 0% to 30% in 5% increments. Participants were recruited from the Third Hospital of Shandong Province, excluding those with MRI contraindications, liver abnormalities, prior surgeries, or conditions affecting liver metabolism. Ethical approval and informed consent were secured.MRI exams were conducted on 5T (uMR-Jupiter, United Imaging Healthcare) and 1.5T (uMR-588, United Imaging Healthcare) systems using the STEAM sequence, detailed in Table 1, within one hour. Volumes of Interest (VOIs) were strategically placed in the liver, avoiding interference from large vessels. Data from phantoms were processed with jMRUI software, and liver data with both UIH workstation and jMRUI, incorporating advanced post-processing techniques for accurate PDFF calculation. Statistical analyses, including normality tests, consistency, and agreement assessments, were conducted using SPSS 26.0, employing ICC and Bland-Altman analyses, with an ICC above 0.75 indicating good agreement and a significance threshold at p<0.05.
Result
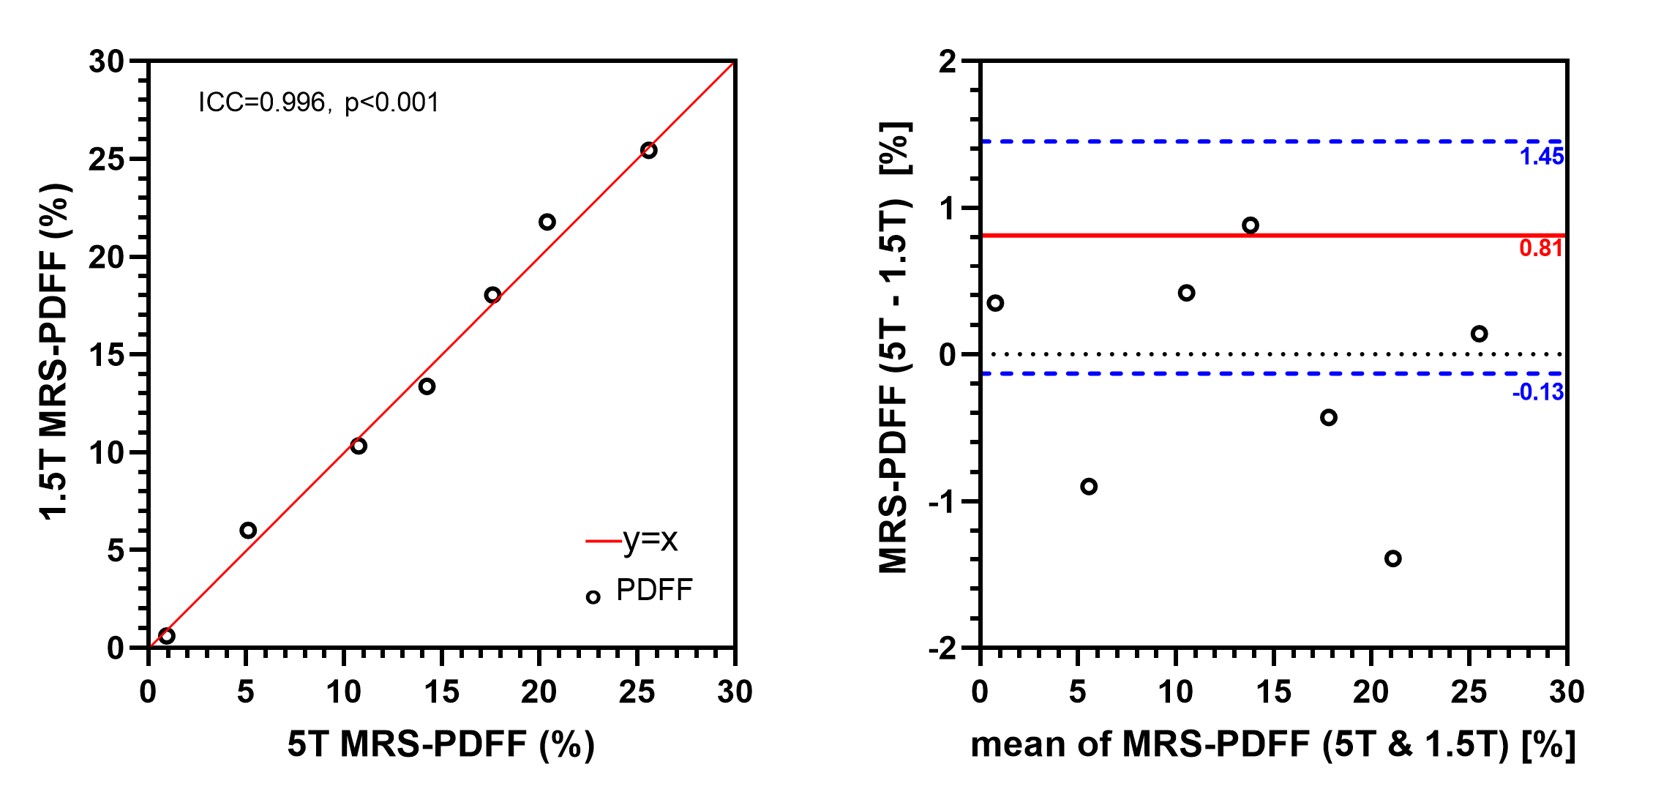
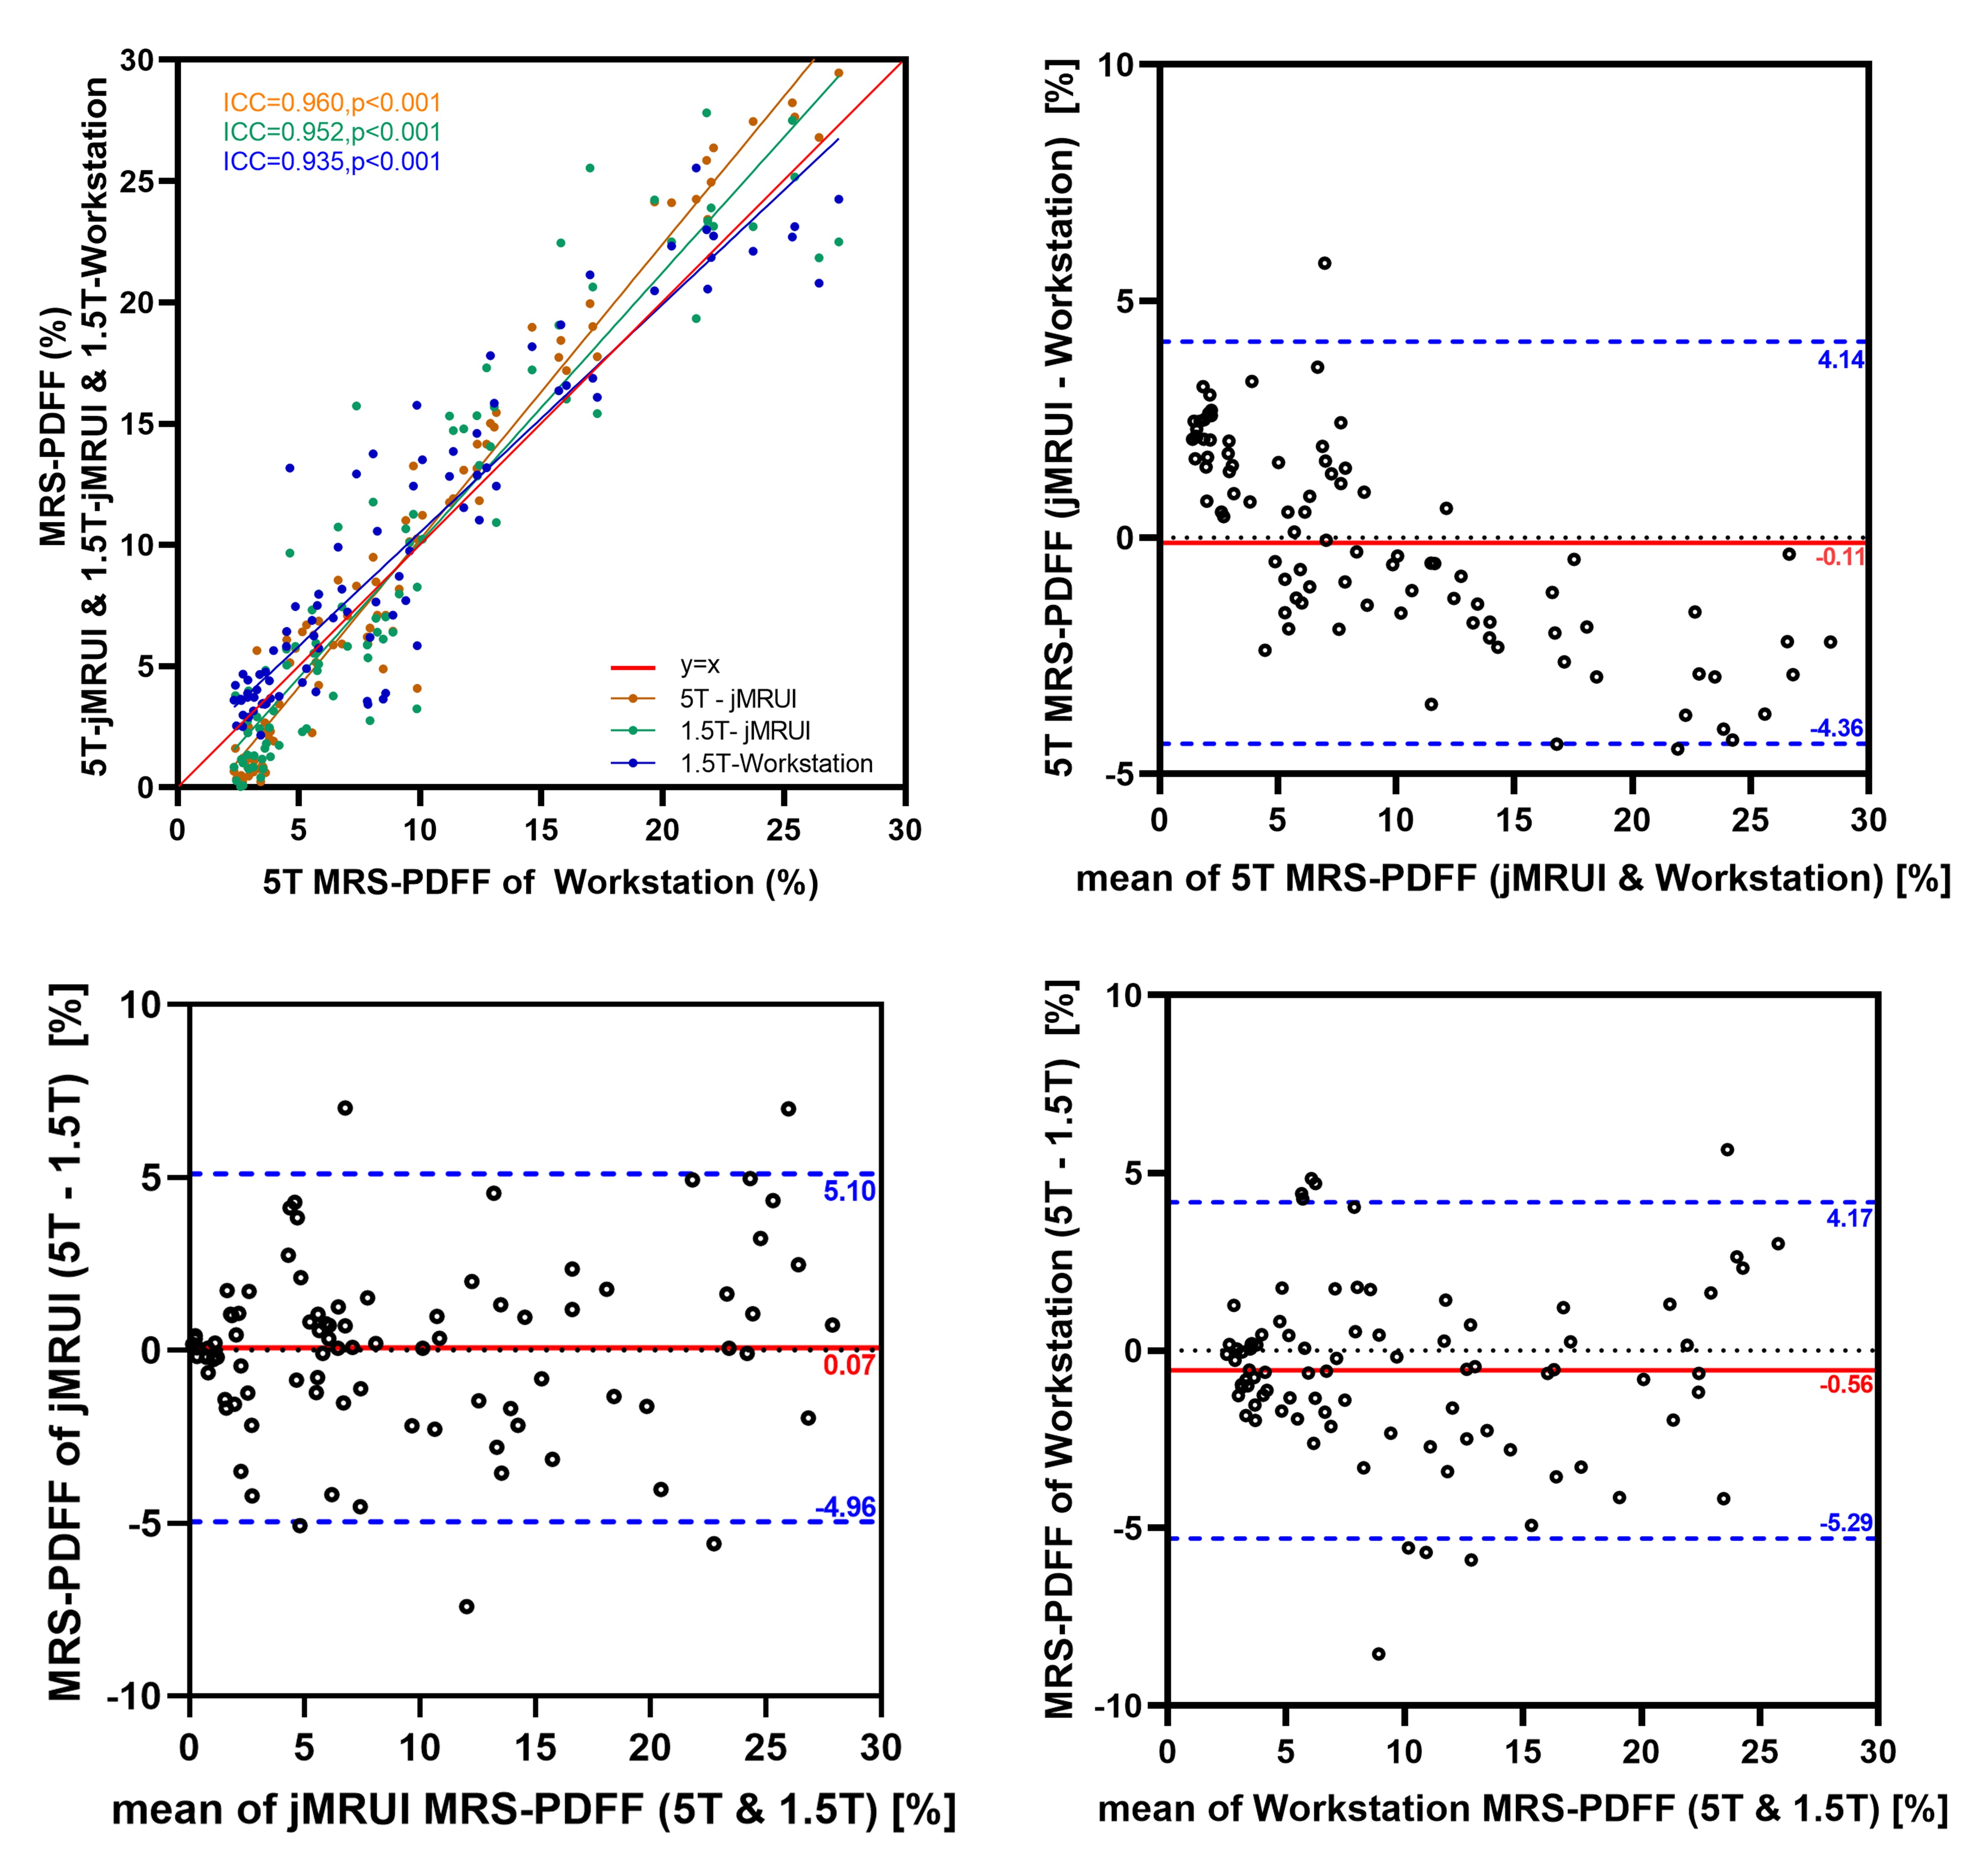
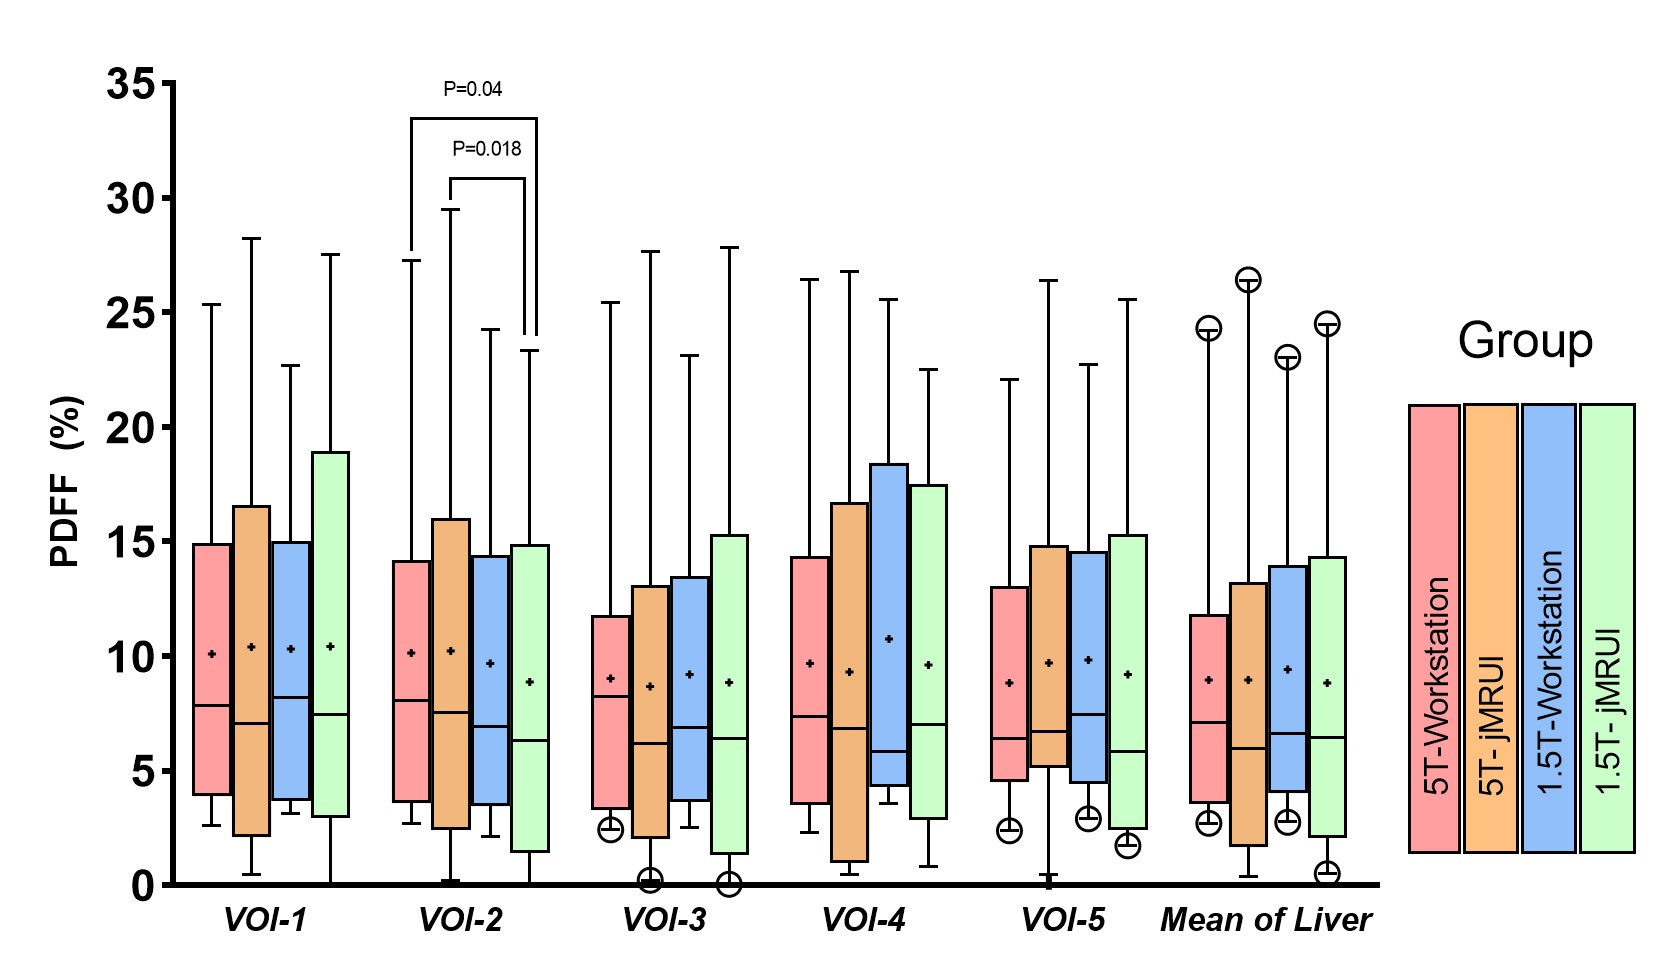
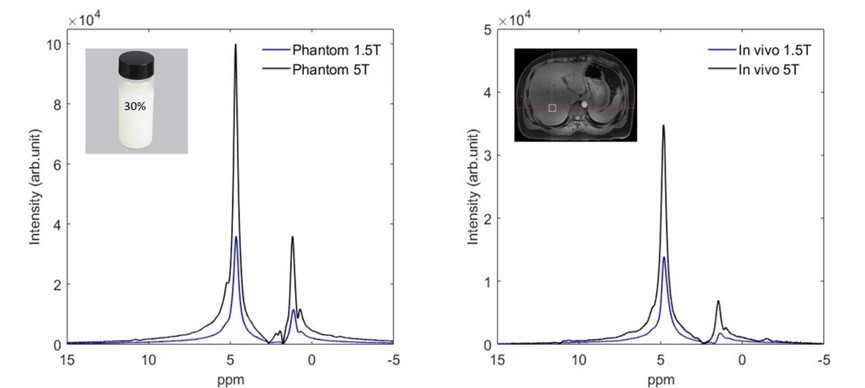
In this study, spatial localization challenges due to minor movements and physiological processes resulted in the exclusion of some VOI data, leaving 89 VOIs for analysis. The population consisted of 11 males and 9 females with an average age of 33.35 years and an average BMI of 25.02.Phantom analysis revealed PDFF measurements with strong agreement across different field strengths, as shown in Figure 1. The consistency between actual values and jMRUI measurements was high, with an ICC of 0.935 (p<0.001).Consistency across field strengths and analytical techniques was also high, as illustrated in Figure 2. Measurements from 5T and 1.5T MR devices in vivo, analyzed with both jMRUI software and MR workstations, showed significant agreement (ICC values > 0.93, p<0.001). Bland-Altman analysis confirmed the lack of significant differences between jMRUI and workstation measurements.Spatial consistency within liver lobes was excellent, as shown in Figure 3, with ICC values ranging from 0.817 to 0.973. A notable difference was observed in one lateral VOI of the right lobe (p=0.018 and p=0.04). Spectrograms for the highest lipid content phantoms and a higher BMI volunteer highlighted the superior spectral resolution at 5T (Figure 4).Discussion
This study evaluated the utility of 5T MRS-PDFF in assessing hepatic fat content, a task challenging due to physiological movements and field inhomogeneities. Despite these challenges, the 5T MRS showed excellent agreement with the established 1.5T measurements in both phantoms and liver tissue, confirming its potential for clinical application. The results were consistent across various analytical methods, with minimal bias between the advanced algorithms of the UIH MR Adaptive Workstation and the jMRUI software. While lower PDFF values were observed in high lipid content phantoms, this was attributed to the water-lipid exchange influencing the separation process. However, 5T MRS offered a smaller standard deviation in PDFF values, suggesting a precision advantage over 1.5T. The study also highlighted the impact of physiological factors on the left lobe's measurement consistency, pointing to the need for careful VOI placement and consideration of the liver's heterogeneity. Despite the robustness of the 5T MRS technique, the study's limitations include a small sample size and the absence of pathological controls. Future studies with larger cohorts and biopsy comparisons are necessary to establish the full clinical efficacy of 5T MRS-PDFF.Conclusion
In conclusion, the study affirmed that 5T MRI can align with 1.5T in measuring hepatic fat, yet it faces unique challenges due to increased sensitivity and field inhomogeneities. Optimizing scanning protocols and post-processing is crucial to leverage the potential of ultra-high-field MRI in clinical settings and advance the capabilities of magnetic resonance technology.Acknowledgements
First of all, I would like to give my heartfelt thanks to all the people who have ever helped me in this paper. My sincere and hearty thanks and appreciations go firstly to my supervisor, Mr. Gan Jie, whose suggestions and encouragement have given me much insight into these studies. I am also extremely grateful to all my friends and coworkers, some Doctors form United Imaging Research Institute of Intelligent Imaging and Chinese Academy of Sciences, who have kindly provided me assistance and companionship in the course of preparing this paper. In addition, many thanks go to my family for their unfailing love and unwavering support. Finally, I am really grateful to all those who devote much time to reading this thesis and give me much advice, which will benefit me in my later study.References
- Shmueli K, Dodd S J, Van Gelderen P, et al. Investigating lipids as a source of chemical exchange‐induced MRI frequency shifts[J]. NMR in Biomedicine, 2017, 30(4): e3525.
- Kobayashi S. Hepatic pseudolesions caused by alterations in intrahepatic hemodynamics. World J Gastroenterol. 2021 Dec 14;27(46):7894-7908.
- Mancini M, Summers P, Faita F, Brunetto MR, Callea F, De Nicola A, Di Lascio N, Farinati F, Gastaldelli A, Gridelli B, Mirabelli P, Neri E, Salvadori PA, Rebelos E, Tiribelli C, Valenti L, Salvatore M, Bonino F. Digital liver biopsy: Bio-imaging of fatty liver for translational and clinical research. World J Hepatol. 2018 Feb 27;10(2):231-245.
- Gajdošík M, Chmelík M, Just-Kukurová I, Bogner W, Valkovič L, Trattnig S, Krššák M. In vivo relaxation behavior of liver compounds at 7 Tesla, measured by single-voxel proton MR spectroscopy. J Magn Reson Imaging. 2014 Dec;40(6):1365-74.
- Kořínek R, Pfleger L, Eckstein K, et al. Feasibility of Hepatic Fat Quantification Using Proton Density Fat Fraction by Multi-Echo Chemical-Shift-Encoded MRI at 7T[J]. Frontiers in physics, 2021, 9: 665562.
- Pasanta D, Htun KT, Pan J, Tungjai M, Kaewjaeng S, Kim H, Kaewkhao J, Kothan S. Magnetic Resonance Spectroscopy of Hepatic Fat from Fundamental to Clinical Applications. Diagnostics (Basel). 2021 May 7;11(5):842.
- Peng H, Cheng C, Wan Q, et al. Fast multi‐parametric imaging in abdomen by corrected dual‐flip angle sequence with interleaved echo acquisition[J]. Magnetic Resonance in Medicine, 2022, 87(5): 2194-2208.
Figures