4830
Comparison of Stiffness Measurement Variability in MRE Phantoms using Different Passive Drivers1Department of Radiology, University of Wisconsin-Madison, Madison, WI, United States, 2Calimetrix, Madison, WI, United States, 3Mayo Clinic, Rochester, MN, United States, 4Resoundant, Rochester, MN, United States, 5University of Wisconsin-Madison, Madison, WI, United States
Synopsis
Keywords: Phantoms, Phantoms, Elastography, Stiffness
Motivation: Quantitative quality assurance (QA) methods for magnetic resonance elastography (MRE) are needed for clinical care but are currently unavailable.
Goal(s): Evaluate stiffness measurement variability from two phantoms of different stiffness using four types of passive drivers: two commercial drivers, a custom stand-style driver, and a novel driver integrated into the phantom housing.
Approach: Stiffness measurements were quantified in ten acquisitions in two phantoms of differing stiffness by four passive drivers. Measurement variability was compared by standard deviations and Whisker-and-Box plots.
Results: The integrated driver achieved the best performance with the highest repeatability, ie: lowest variability, compared to the other drivers.
Impact: An MRE phantom equipped with an integrated passive driver could improve repeatability in MRE quality assurance, potentially enhancing the reliability of QA processes in both clinical trials and patient care.
Introduction
Metabolic-dysfunction associated steatotic liver disease (MASLD) is the most common cause of liver disease, affecting approximately 25-30% of the global population1,2. Up to 25% of MASLD patients develop its aggressive subtype, metabolic-dysfunction associated steatohepatitis (MASH) with associated liver injury, inflammation and scar (fibrosis)3.Accurate diagnosis, staging, and treatment monitoring of fibrosis is essential to the management of MASLD/MASH3,4. Magnetic resonance elastography (MRE) has emerged as the non-invasive standard of care to measure liver stiffness as a biomarker of fibrosis5–7. MRE requires an active driver to produce mechanical vibrations, which are transmitted via a hose to a passive driver on the patient's abdomen.
Quality assurance (QA) of MRE measurements is beneficial for patient care and clinical trials. The manufacturer of MRE systems, Resoundant (Rochester, MN), provides a qualitative single-stiffness MRE phantom to “aid training and as an optional tool for generally confirming proper system operation (not to test accuracy)”.8 These phantoms require the user to strap a standard commercial passive driver to the phantom with a neoprene belt. This procedure can be awkward, and variability in tightness and location of the belt may introduce variability into stiffness measurements and reduce the reliability of QA.
The purpose of this study was to develop improved procedures for phantom-based MRE QA by evaluating the variability of MRE measurements acquired using four different passive driver configurations.
Methods
Two MRE phantoms were constructed by filling cylindrical plastic housings (16cm diameter x 6.4cm height) with gels made with varying concentrations of bovine gelatin designed to mimic low and high liver stiffness.Four passive drivers were used to introduce mechanical vibrations into the phantom: 1) a rigid 16cm-diameter disc placed on top of the phantom, separated from the phantom by a rubber pad, and held in place by the commercial neoprene belt (“Paddle”); 2) a commercial square flexible driver, strapped in place by the belt (“Flex”); 3) a custom-made stand-style driver9, with the phantom placed on top (“Stand”); and 4) a custom-made integrated driver (Calimetrix, Madison, WI) that can be mechanically fixed to the plastic cylindrical housing (“Integrated”) (Fig.1).
Images were acquired a total of 10 times for each passive driver. For the first five acquisitions, the phantom and the driver were removed and repositioned (“Reset”). For the subsequent five acquisitions, the driver position was unchanged, acquiring the images sequentially without any repositioning or change in prescan parameters (“No Reset”).
Imaging was performed using a clinical 3.0T MRI system (Signa Premier, GE Healthcare, Waukesha, WI). A commercial 2D spin-echo echo planar imaging MRE (2D-SE-EPI MRE) sequence was used with the following acquisition parameters: 200x200mm FOV, coronal plane, 8mm slice, TR/TE=250/56.5ms, 30° flip angle, 32x32 matrix, 2 signal averages, 60Hz MRE frequency, and 10% active driver amplitude. Stiffness maps were generated using the GE MR-Touch postprocessing software (Fig.2).
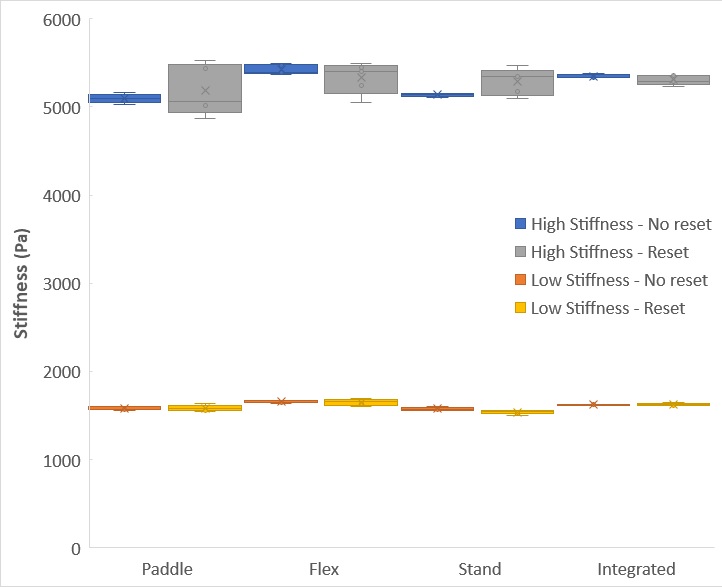
Stiffness values were calculated averaging the 5 “Reset” and 5 “No reset” acquisitions performed for each of the two phantoms, for all four drivers. The stiffness for each acquisition was measured by placing regions of interest (ROI) at the center of the phantom with a diameter equal to ~½ of the phantom’s diameter. The mean and standard deviations of stiffness measurements across each group of five acquisitions (“Reset”, “No Reset”) were calculated and plotted in Box-and-Whisker plots. Values are summarized as mean±SD.
Results
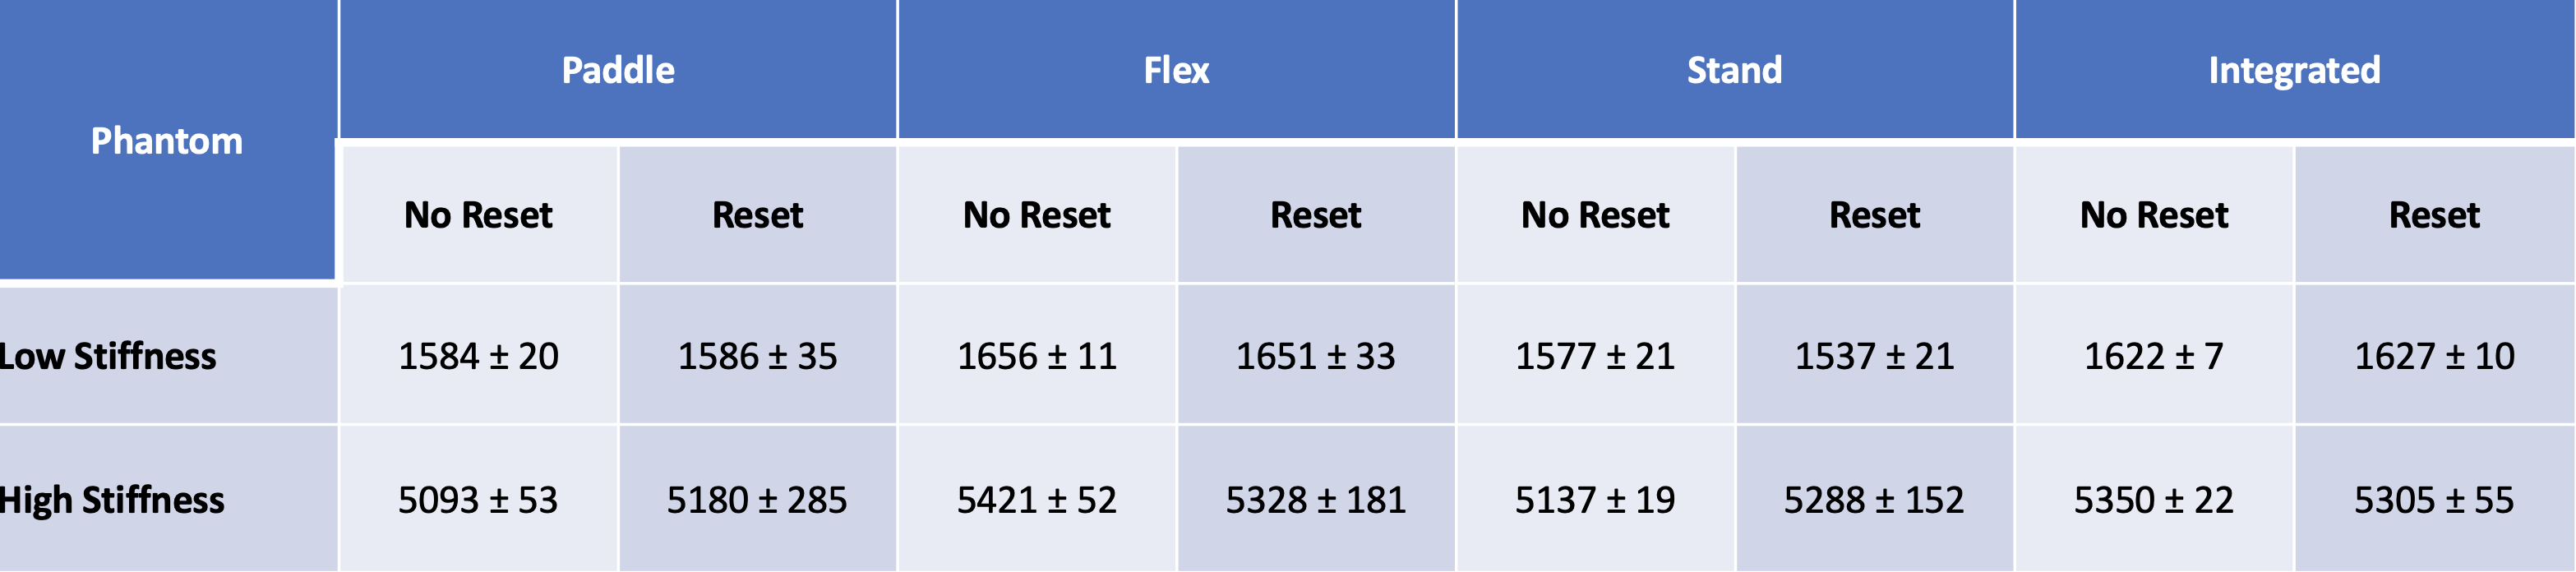
A total of 80 independent MRE acquisitions were included for the 2 phantoms with 4 drivers, repeated 10 times (5 times “Reset”, 5 times “No Reset”). Figure 3 tabulates the means and standard deviations of stiffness measurements, demonstrating the impact of different drivers on stiffness variability measurements. The highest to lowest variability for the following drivers were, respectively: Paddle driver, especially during the “Reset” acquisitions; Flex driver; Stand driver; and Integrated driver, which had the lowest (best) variability of all repeated stiffness measurements. The Box-and-Whisker plot highlights the improved precision gained by using the integrated driver, especially comparing to the user-dependent drivers that require more user-dependent positioning (Fig.4).Discussion
This study demonstrates superior precision, i.e., lower variability, in phantom stiffness measurements using drivers that minimize user-dependent driver positioning relative to the phantom. The requirement to secure a driver to the phantom using a neoprene belt introduced an increased level of stiffness measurement variability. The integrated driver achieved the best performance with the highest repeatability (lowest variability), likely due to improved wave transmission and consistency in phantom configuration between acquisitions.The main limitation of this study is the acquisition of a single system and image acquisition protocol. Further studies are needed to generalize these findings for different scanners and applications.
Acknowledgements
The authors acknowledge support from the NIH (R41-EB033717). The authors also acknowledge support from GE Healthcare and Bracco Diagnostics who provide research support to the University of Wisconsin. Dr. Reeder is the John H. Juhl Endowed Chair of Radiology. The authors also wish to acknowledge Resoundant for providing the Paddle and Flex drivers used in this study as well as Calimetrix for providing the phantoms and the Stand and Integrated drivers used in the study.References
1. Younossi ZM, Koenig AB, Abdelatif D, Fazel Y, Henry L, Wymer M. Global epidemiology of nonalcoholic fatty liver disease-Meta-analytic assessment of prevalence, incidence, and outcomes. Hepatol Baltim Md. 2016;64(1):73-84. doi:10.1002/hep.28431
2. Ahmed A, Wong RJ, Harrison SA. Nonalcoholic Fatty Liver Disease Review: Diagnosis, Treatment, and Outcomes. Clin Gastroenterol Hepatol Off Clin Pract J Am Gastroenterol Assoc. 2015;13(12):2062-2070. doi:10.1016/j.cgh.2015.07.029
3. Rinella ME. Nonalcoholic fatty liver disease: a systematic review. JAMA. 2015;313(22):2263-2273. doi:10.1001/jama.2015.5370
4. Strassburg CP, Manns MP. Approaches to liver biopsy techniques--revisited. Semin Liver Dis. 2006;26(4):318-327. doi:10.1055/s-2006-951599
5. Jayakumar S, Middleton MS, Lawitz EJ, et al. Longitudinal correlations between MRE, MRI-PDFF, and liver histology in patients with non-alcoholic steatohepatitis: Analysis of data from a phase II trial of selonsertib. J Hepatol. 2019;70(1):133-141. doi:10.1016/j.jhep.2018.09.024
6. Castera L, Friedrich-Rust M, Loomba R. Noninvasive Assessment of Liver Disease in Patients With Nonalcoholic Fatty Liver Disease. Gastroenterology. 2019;156(5):1264-1281.e4. doi:10.1053/j.gastro.2018.12.036
7. Piazzolla VA, Mangia A. Noninvasive Diagnosis of NAFLD and NASH. Cells. 2020;9(4):1005. doi:10.3390/cells9041005
8. QIBA Profile: Magnetic Resonance Elastography of the Liver; 2019.
9. Arunachalam SP, Rossman PJ, Arani A, et al. Quantitative 3D magnetic resonance elastography: Comparison with dynamic mechanical analysis. Magn Reson Med. 2017;77(3):1184-1192. doi:10.1002/mrm.26207
Figures
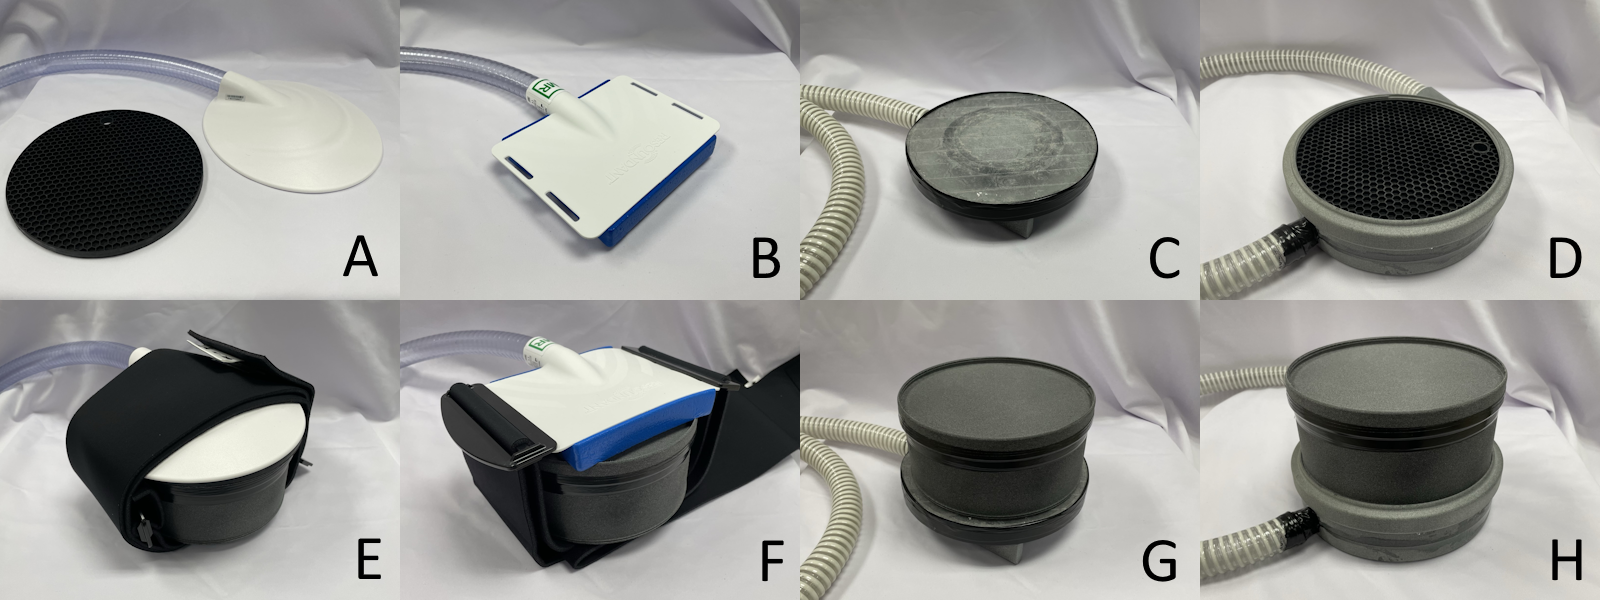
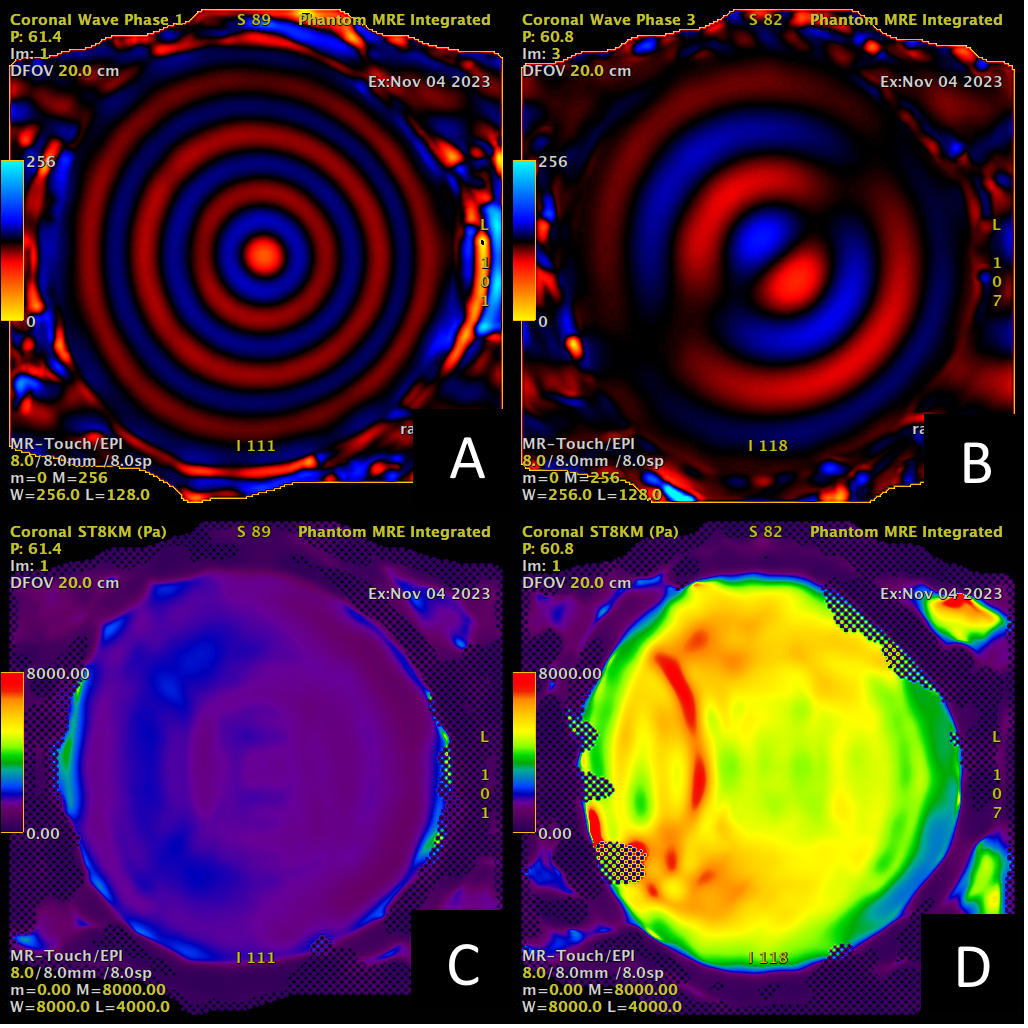
Figure 2 - Excellent illumination of shear waves introduced by the integrated driver was observed through the phantoms. A) representative example of the MRE acquisition on the Low (A) and High (B) Stiffness phantoms. Stiffness maps are also represented in the Low (C) and High (D) Stiffness phantoms.