4826
A realistic in-silico brain phantom for magnetic susceptibility-separation algorithm validation1NeuroPoly Lab, Institute of Biomedical Engineering, Polytechnique Montreal, Montreal, QC, Canada, 2Department of Computer and Software Engineering, Polytechnique Montreal, Montreal, QC, Canada, 3CHU Sainte-Justine Research Center, Montreal, QC, Canada, 4Department of Electrical Engineering, Polytechnique Montreal, Montreal, QC, Canada
Synopsis
Keywords: Susceptibility/QSM, Quantitative Imaging, Phantoms, QSM, Simulation, Susceptibility, Anisotropy
Motivation: Positive and negative susceptibility mapping is an emerging method that can benefit from the availability of validation tools.
Goal(s): To create an in-silico brain phantom for positive and negative susceptibility and to assess the impact of white matter’s anisotropic susceptibility on susceptibility-separation techniques.
Approach: Simulate positive and negative susceptibility maps and gradient-echo data with/without anisotropy. Process simulated data with different susceptibility-separation algorithms. Compare the results with the ground truth.
Results: The error associated with negative susceptibility measurements is ~9% greater when anisotropy effects are present in the phantom, suggesting that a new susceptibility-separation algorithm that considers myelin’s anisotropic susceptibility may be warranted.
Impact: Researchers developing novel magnetic susceptibility-separation methods can use our proposed phantom to test different aspects of their technique, ranging from the biophysical model to image processing methods and imaging protocol parameters.
Introduction
Quantitative susceptibility mapping (QSM) has emerged as a valuable technique for evaluating iron levels within deep gray matter (GM) and investigating demyelinating lesions in white matter (WM)1. QSM seeks to measure the magnetic susceptibility (χ) of tissues, which can take on positive (χ+) or negative (χ-) values, and describes the degree to which a material will become magnetized when exposed to a magnetic field. However, QSM measurements reflect bulk susceptibility. This means that one can not determine whether a change in measured susceptibility is due to a decrease in χ+ or increase in χ-, or vice versa. To address this, several susceptibility-separation algorithms have been proposed to quantify χ+ and χ-2–4. Both QSM and susceptibility-separation rely upon complex image processing steps and biophysical modeling that may impact the accuracy of the final susceptibility maps. To validate QSM processing algorithms, an in-silico QSM validation phantom was recently proposed5. Here we sought to extend this phantom so that it could be used to validate susceptibility-separation algorithms. Our phantom offers the option of considering the anisotropic nature of WM susceptibility6, a feature that is not incorporated in the susceptibility-separation algorithms proposed to-date. As a proof-of-concept, we used our phantom to perform MR simulations and applied susceptibility-separation algorithms to our simulated data. This proof-of-concept demonstrates the utility of our phantom in assessing the impact of WM’s anisotropic susceptibility on χ+and χ- measurements.Method
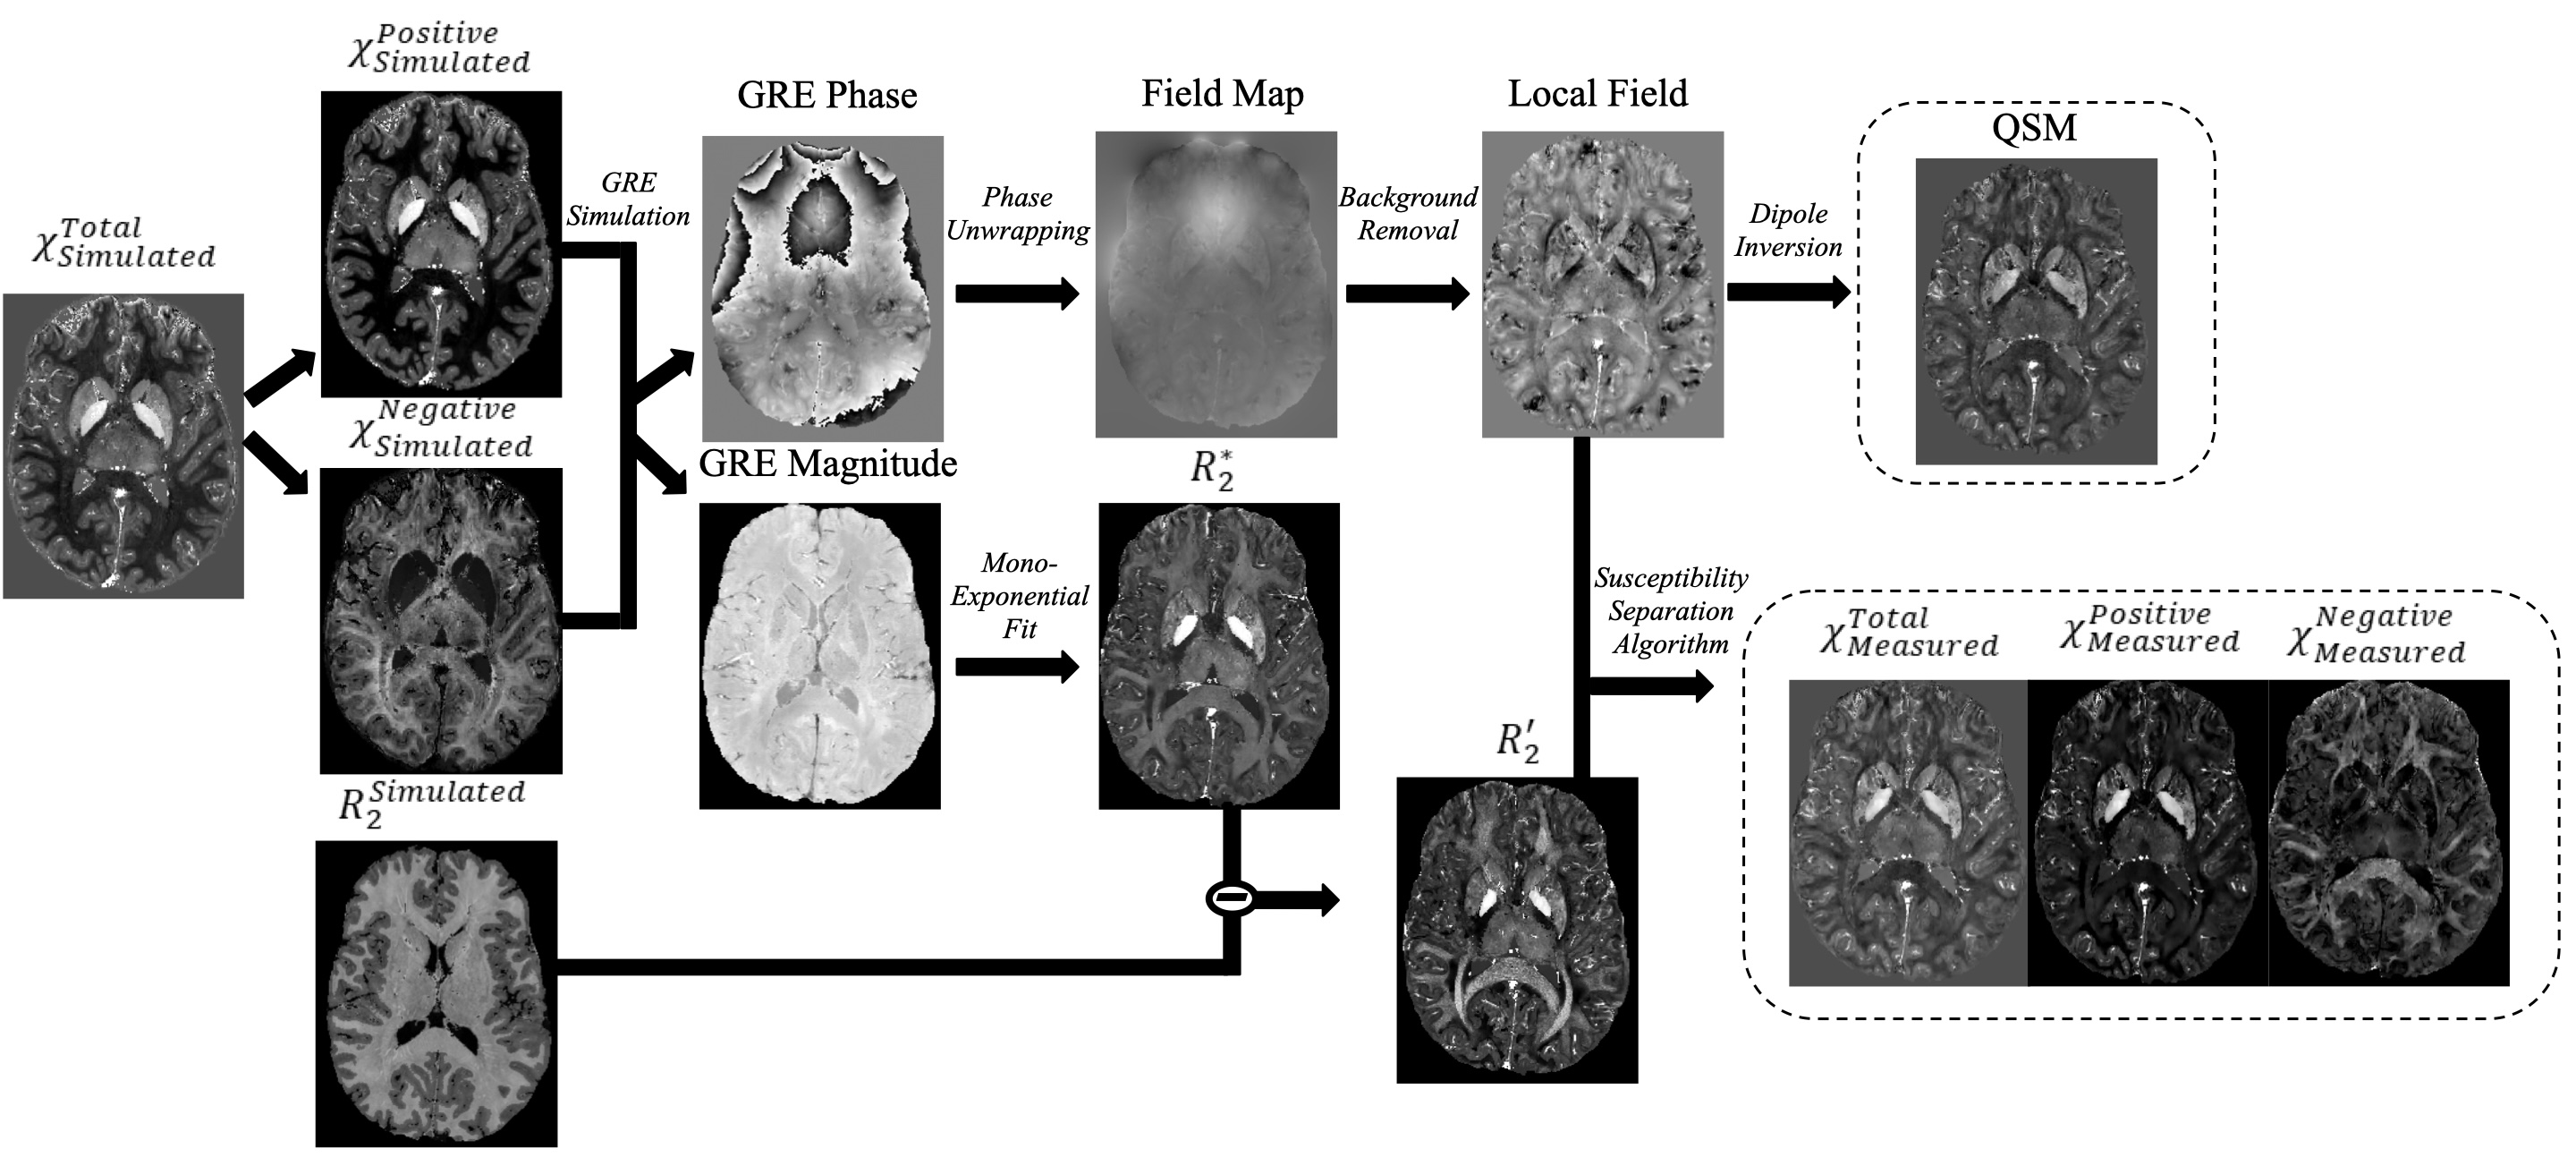
The QSM validation phantom, from which we built our proposed phantom, includes 7T quantitative R1, R2*, net magnetization (M0), and χ maps, as well as 3T diffusion tensor images (DTI). We replaced χ values with two values: χ+ and χ-. These were established using three criteria: their sum is equal to the total susceptibility of the QSM phantom and they are associated with iron and myelin concentrations from literature and with an open-access χ-separation atlas7. Our custom phantom offers the possibility of including WM’s susceptibility anisotropy by modeling χ- as (χ||-χ⊥) cos2θ+χ0, where χ|| and χ⊥ are the susceptibility of myelinated fibers along and perpendicular to their principal axis, θ is the fiber-to-field angle, and χ0 represents any orientation-independent susceptibility8. χ||, χ⊥, and χ0 maps were generated from literature values8–10 that were weighted using the R1 map and subjected to Gaussian noise. We also simulated 7T R2 maps (based on literature values that were weighted using R2* and M0) and "Dr" maps representing the proportionality between R2’ (=R2*-R2) and absolute susceptibility. Dr was modeled as $$$\tfrac{2\pi}{9\sqrt{3}}{\gamma}B_0$$$11 in GM and as $$$\tfrac{1}{2}\gamma B_0sin^2(\theta)$$$11 in WM for the version of the phantom that incorporates susceptibility anisotropy. For the version of the phantom that does not include susceptibility anisotropy, Dr was kept constant by taking an average value across θ. Both phantoms (with/without WM anisotropy) were used to simulate magnitude and phase gradient-echo (GRE) data using: $$S=M_0\sin(\alpha)\frac{1-e^{-TR{\cdot}R_1}}{1-\cos(\alpha)e^{-TR{\cdot}R_1}}e^{-TE{\cdot}(R_2+D_r(|\chi^+|+|\chi^-|))+i(\Phi_0+TE{\cdot}2\pi{\gamma}B_0(D(\chi^++\chi^-)))}$$ where D is the magnetic dipole kernel. α, TR, TE, and Φ0 were set to be 15o, 50ms, [4,12,20,28]ms, and 0o respectively. Next, magnitude and phase GRE data were used to compute χ+ and χ- maps using three open-access susceptibility-separation algorithms: χ-separation2, χ-separation GRE3, and APART-QSM4. See Figure 1 for the general workflow. Lastly, χ+ and χ- maps were compared to the ground truth (i.e., our simulated values).Results
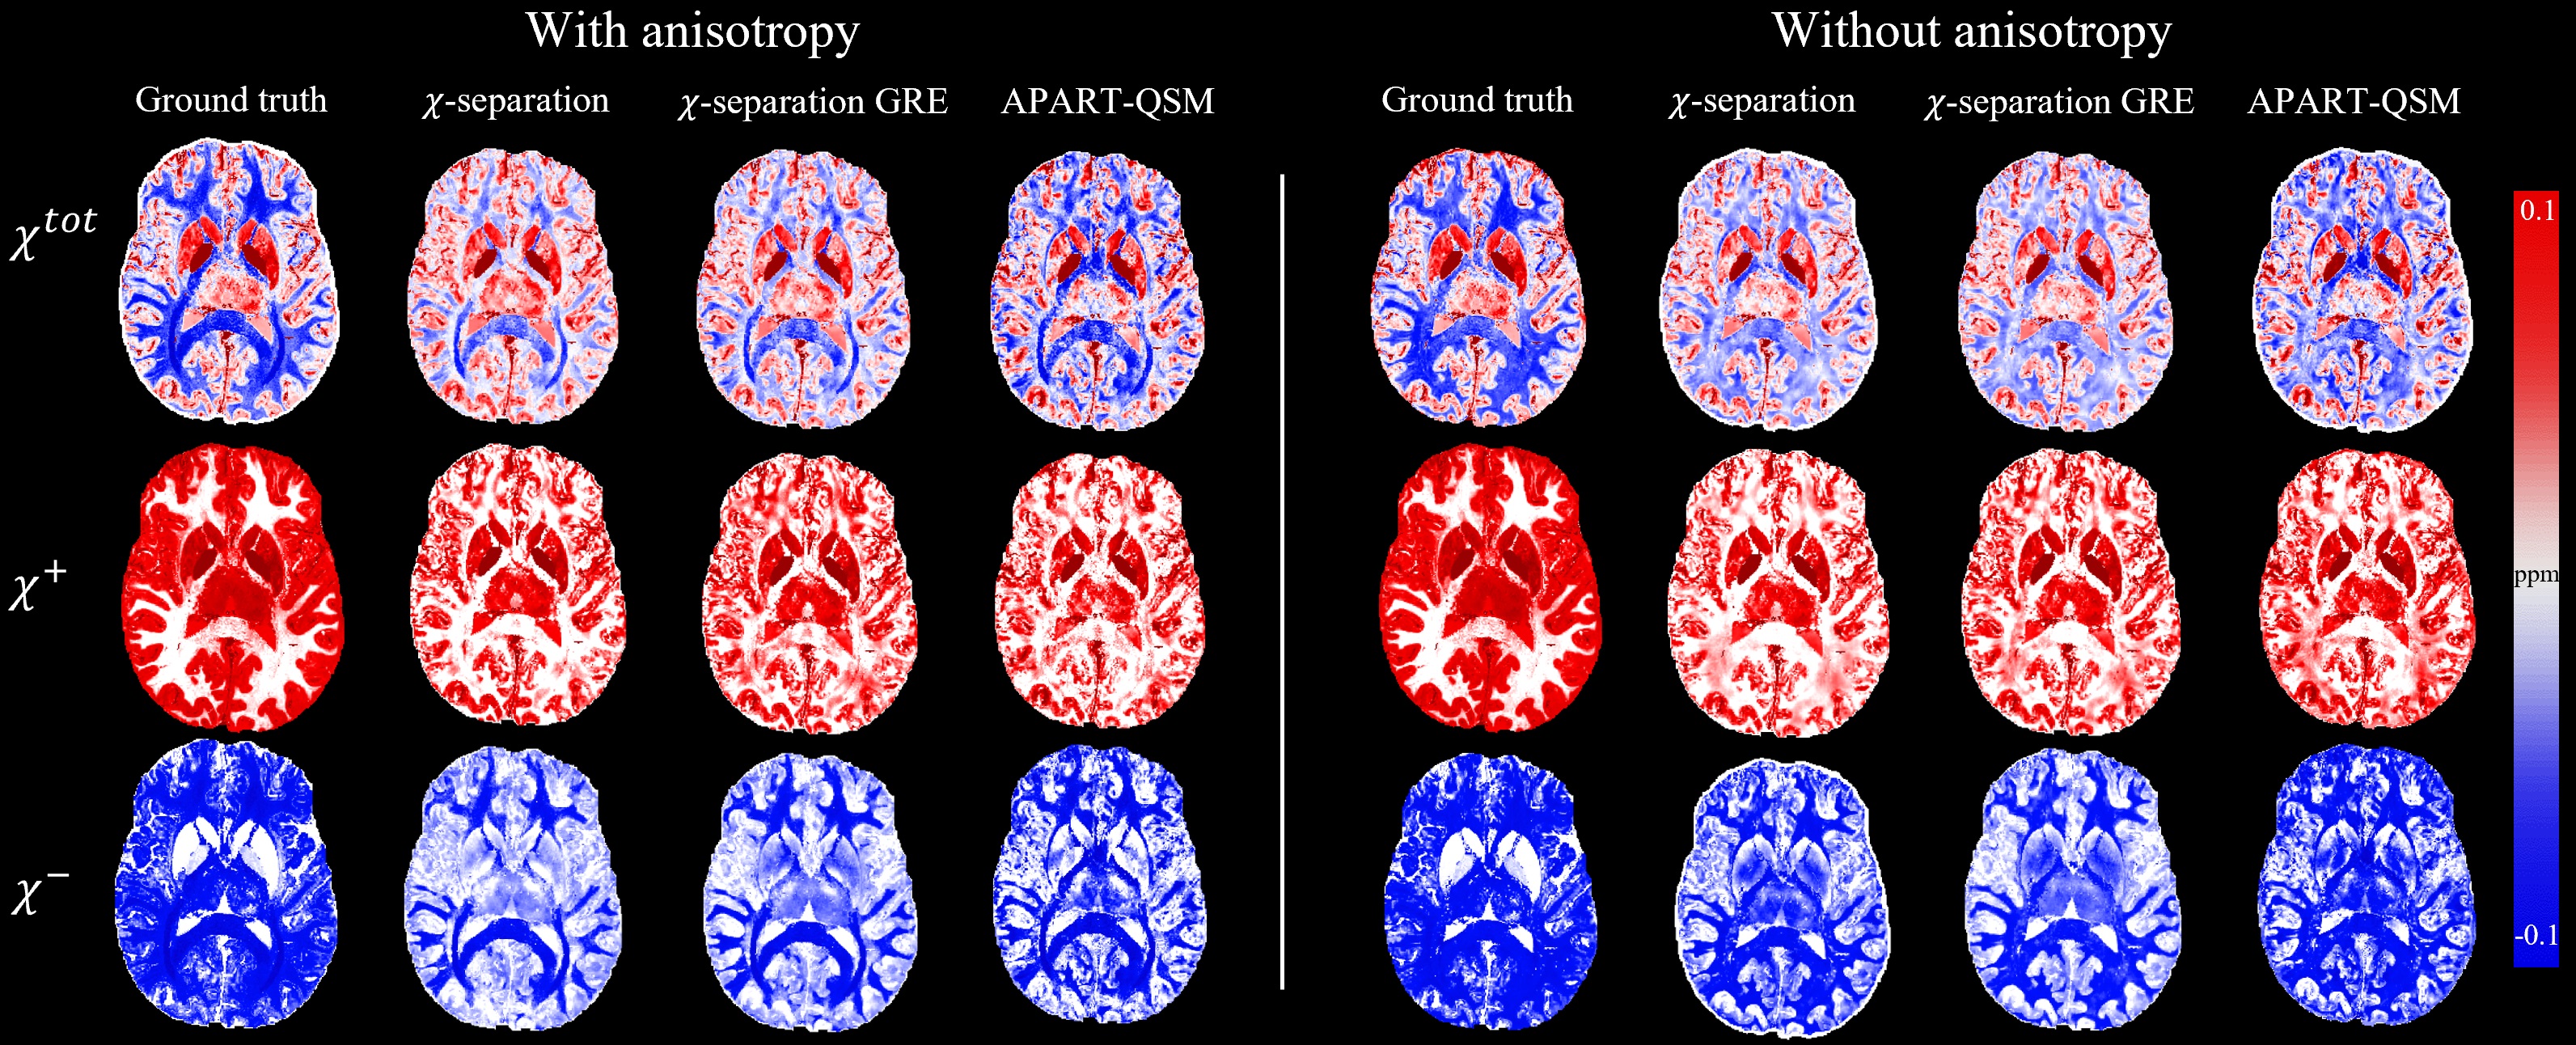
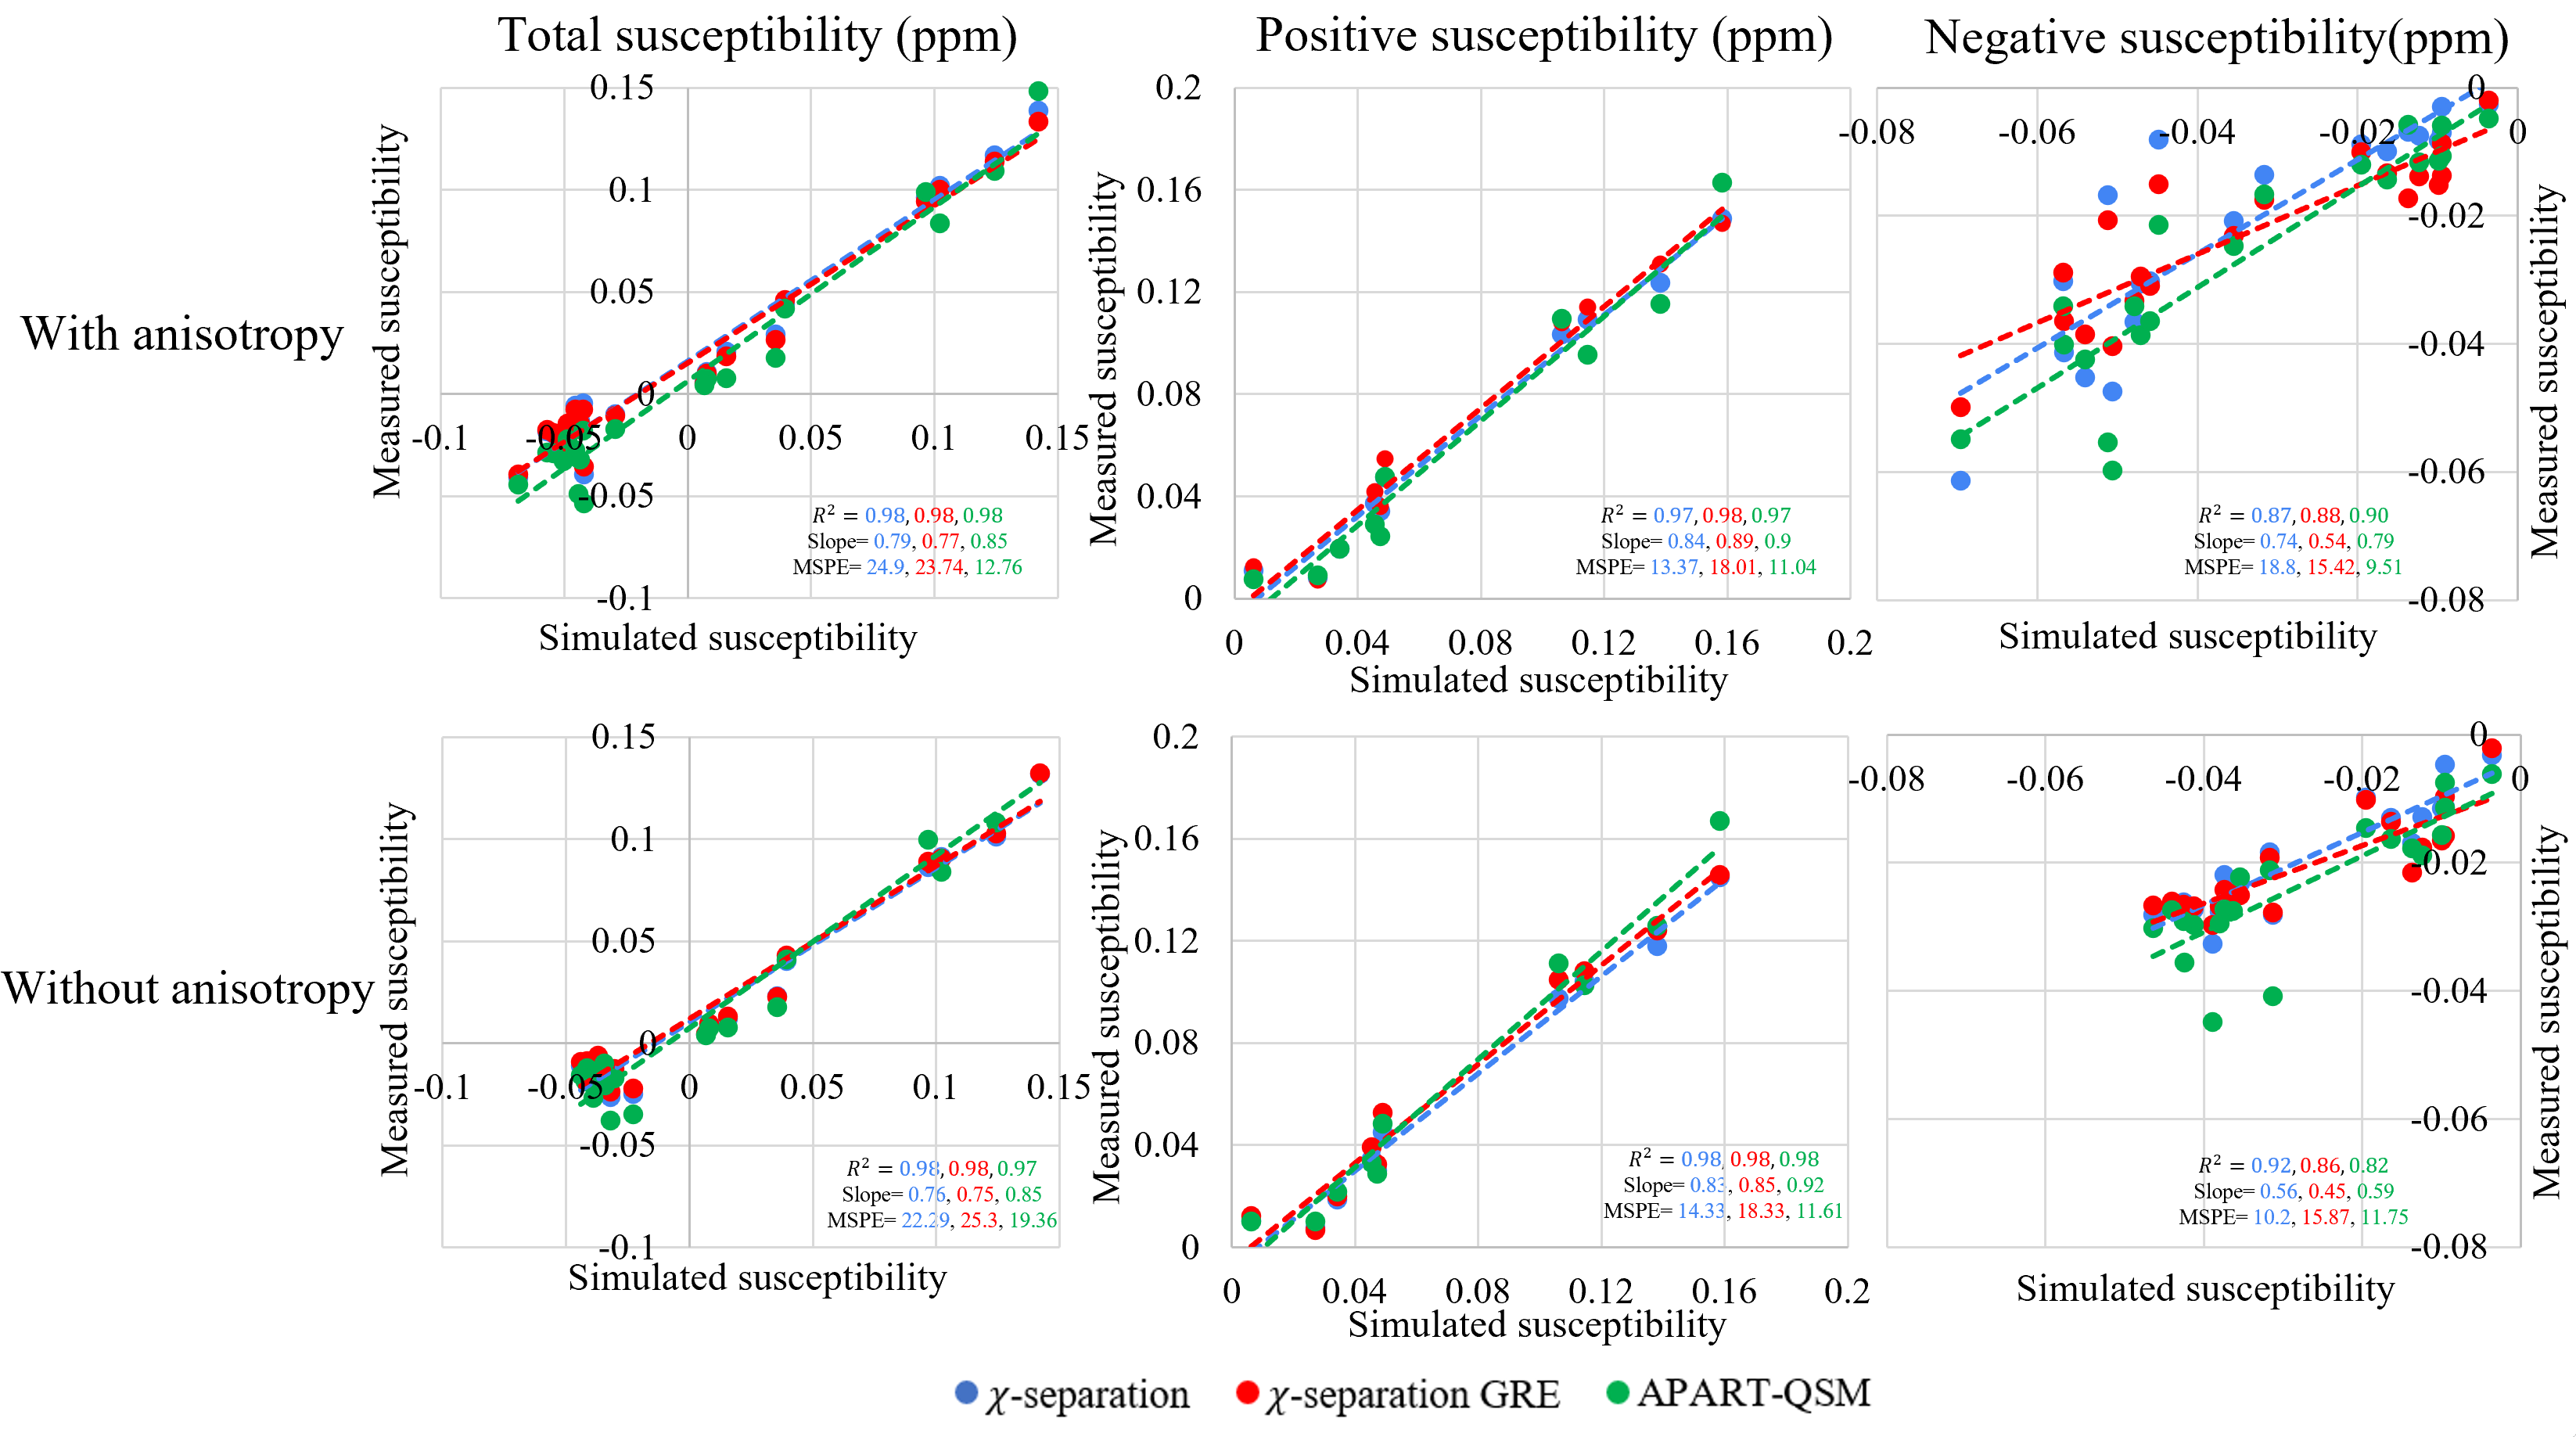
In Figure 2, one can appreciate that the introduction of susceptibility anisotropy in the phantom has a visible impact on measured χ+ and χ- values. In Figure 3 we show a linear regression analysis between simulated and measured susceptibility values. These results show that when anisotropy is included in the phantom, the mean squared percent error (MSPE) across the whole brain for χ- obtained from χ-separation increases by 8.6%. This highlights the degree to which χ-separation results may be biased due to the omission of WM’s anisotropy within the fitting model. In APART-QSM, where contrary to χ-separation, Dr is modeled as variable, the MSPE for χ- decreases by 2.25%. The voxelwise fitting of Dr in APART-QSM may account for part of WM’s anisotropy, given that Dr has an orientation effect.Discussion/Conclusion
The possibility of accurately quantifying χ+ and χ- has garnered considerable interest within the community. Within the last two years, several algorithms have been proposed. Here we propose an in-silico χ+and χ- phantom for validating susceptibility-separation algorithms. In order to demonstrate its utility, we have shown evidence that the omission of WM’s susceptibility anisotropy can lead to a measurable impact on χ- measurements at 7T. In the future, we will adapt the phantom so that 3T simulations can also be performed. The phantom code can be found at: https://github.com/neuropoly/Susceptibility-separation-phantom.Acknowledgements
This work is supported by the TransMedTech Institute, thanks to the financial support of the Canada First Research Excellence Fund and the Fonds de recherche du Québec, the Natural Sciences and Engineering Research Council of Canada (NSERC), and Polytechnique Montreal.References
- Marcille, M. et al. Disease correlates of rim lesions on quantitative susceptibility mapping in multiple sclerosis. Sci. Rep. 12, 4411 (2022).
- Shin, H.-G. et al. χ-separation: Magnetic susceptibility source separation toward iron and myelin mapping in the brain. Neuroimage 240, 118371 (2021).
- Dimov, A. V. et al. Susceptibility source separation from gradient echo data using magnitude decay modeling. J. Neuroimaging 32, 852–859 (2022).
- Li, Z. et al. APART-QSM: An improved sub-voxel quantitative susceptibility mapping for susceptibility source separation using an iterative data fitting method. Neuroimage 274, 120148 (2023).
- Marques, J. P. et al. QSM reconstruction challenge 2.0: A realistic in silico head phantom for MRI data simulation and evaluation of susceptibility mapping procedures. Magn. Reson. Med. 86, 526–542 (2021).
- Bender, B. & Klose, U. The in vivo influence of white matter fiber orientation towards B(0) on T2* in the human brain. NMR Biomed. 23, 1071–1076 (2010).
- Chi-separation atlas. GitHub https://github.com/SNU-LIST/chi-separation-atlas (2023).
- Li, X. et al. Mapping magnetic susceptibility anisotropies of white matter in vivo in the human brain at 7 T. Neuroimage 62, 314–330 (2012).
- Sibgatulin, R. et al. Magnetic susceptibility anisotropy in normal appearing white matter in multiple sclerosis from single-orientation acquisition. Neuroimage Clin 35, 103059 (2022).
- Sibgatulin, R., Güllmar, D., Deistung, A., Ropele, S. & Reichenbach, J. R. In vivo assessment of anisotropy of apparent magnetic susceptibility in white matter from a single orientation acquisition. Neuroimage 241, 118442 (2021).
- Yablonskiy, D. A. & Haacke, E. M. Theory of NMR signal behavior in magnetically inhomogeneous tissues: the static dephasing regime. Magn. Reson. Med. 32, 749–763 (1994).
Figures