4825
Synthetic MRI for the quantitative Assessment of efficacy of Immunotherapy in nasopharyngeal carcinoma.1Radiology, The First Clinical Medical College of Guangxi Medical University, Nanning, China, 2MR Research Collaboration, Siemens Healthineers., Nanning, China
Synopsis
Keywords: Other Interventional, Quantitative Imaging
Motivation: Due to the internal heterogeneity of the nasopharyngeal carcinoma, conventional treatment fails to enhance the tumor microenvironment, ultimately leading to recurrence or metastasis.
Goal(s): To investigate whether quantitative values derived from T1, T2, and PD maps can serve as an assessment index for combined immunotherapy with chemotherapy in patients with newly diagnosed locally advanced NPC.
Approach: Synthetic MRI, non-invasive technique, can generate quantitative values for intrinsic tissue features.
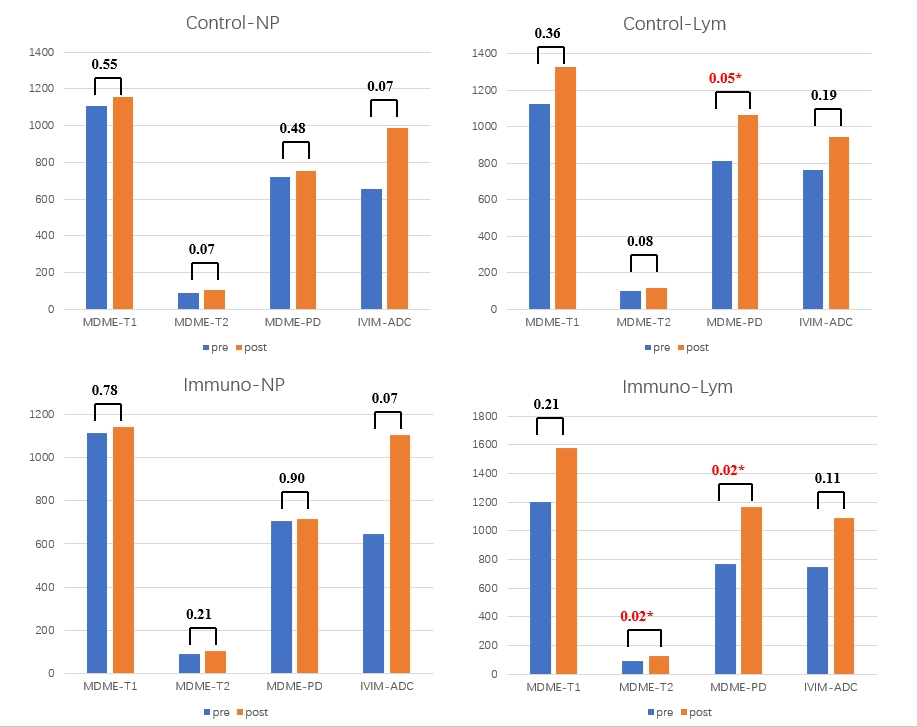
Results: The study indicate the potential of PD and T2 values in distinguishing between two treatment. A larger sample size is required to further validate the value of SyMRI in evaluating immunotherapy for NPC.
Impact: Synthetic MRI can generate longitudinal relaxation time (T1), transverse relaxation time (T2), and proton density (PD).
Introduction
Nasopharyngeal carcinoma (NPC) is closely associated with Epstein Barr virus (EBV) infection and is a heterogeneous epithelial tumor highly prevalent in East and Southeast Asia[1]. Due to the internal heterogeneity of the tumor, radiotherapy and chemotherapy as a conventional treatment fail to enhance the tumor microenvironment and may immune evasion, ultimately leading to recurrence or metastasis. Therefore, it is crucial to assess risk stratification in low-sensitive NPC patients before or during early stages of treatment. Synthetic MRI (SyMRI) is an innovative and promising technique that utilizes multi-delay and multi-echo (MDME) imaging technology to obtain quantitative and qualitative multiparametric data on tissue characteristics within approximately five to six minutes[2]. This non-invasive technique can generate quantitative values for intrinsic tissue features including longitudinal relaxation time (T1), transverse relaxation time (T2), and proton density (PD). SyMRI has demonstrated feasibility in various fields such as multiple sclerosis, prostate cancer, bladder cancer, breast cancer, etc[3-6]. A recent study found that histogram parameters of SyMRI could reflect tissue intrinsic characteristics and showed potential value in assessing histological type and tumor stage[7]. Therefore, the objective of this study is to investigate whether SyMRI quantitative values derived from T1, T2, and PD maps can serve as an assessment index for combined immunotherapy with chemotherapy in patients with newly diagnosed locally advanced NPC.Method
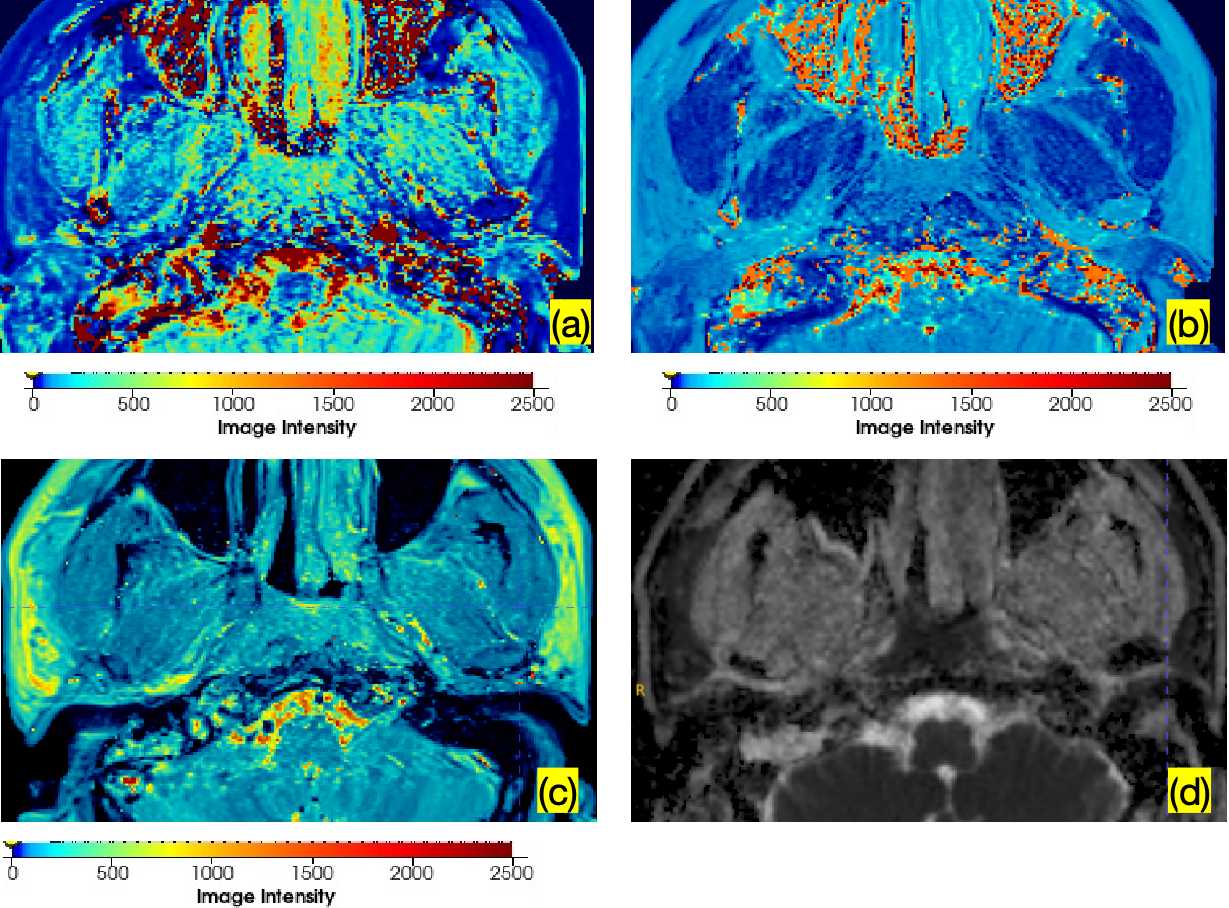
This study was approved by our institutional review board and informed consent was waived due to the retrospective nature of the study.Subject: The study included ten patients(4 females and 6 males, mean age±standard deviation: 44±1 year) diagnosed with locally advanced nasopharyngeal carcinoma who had not undergone any prior antineoplastic treatment. All the patients underwent preoperative examination with Conventional MRI sequence,SyMRI and IVIM. The participants were categorized into the immunotherapy group and the control group based on their adherence to either combined or non-combined immunotherapy regimens.Scanner: All subjects were scanned before and after the intervention using a 3.0 T MR scanner (MAGNETOM Vida, Siemens Healthcare, Erlangen, Germany).All the quantitative images and the values derived from T1, T2, PD maps and ADC map. The regions of interest (ROIs) were delineated using a post-processing software called ITK-SNAP( Figure 1).Statistics: The statistical analysis was performed using MATLAB. A total of 8 sets of data were subjected to statistical analysis.Result and discussion
Due to the limited sample size, this study temporarily only evaluated whether quantitative values before and after treatment were statistically different.It was observed that both the control group and the immune group exhibited statistically significant differences in PD results within the lymphatic region before and after treatment. However, only the immune group demonstrated statistical differences in T2 results within the lymphatic region. A value of P < 0.05 was considered significant. (Table 1)Conclusion
The results of this study indicate the potential of PD values and T2 values in distinguishing between two treatment regimens. However, to further validate the value of SyMRI quantitative measurements in evaluating immunotherapy for nasopharyngeal carcinoma, a larger sample size is required.Acknowledgements
No acknowledgement found.References
- Chen, Y.P., et al., Nasopharyngeal carcinoma. Lancet, 2019. 394(10192): p. 64-80.2.
- Warntjes, J.B., et al., Rapid magnetic resonance quantification on the brain: Optimization for clinical usage. Magn Reson Med, 2008. 60(2): p. 320-9.3.
- Hagiwara, A., et al., Synthetic MRI in the Detection of Multiple Sclerosis Plaques. AJNR Am J Neuroradiol, 2017. 38(2): p. 257-263.4.
- Arita, Y., et al., Quantitative Assessment of Bone Metastasis in Prostate Cancer Using Synthetic Magnetic Resonance Imaging. Invest Radiol, 2019. 54(10): p. 638-644.5.
- Cai, Q., et al., Investigation of Synthetic Magnetic Resonance Imaging Applied in the Evaluation of the Tumor Grade of Bladder Cancer. J Magn Reson Imaging, 2021. 54(6): p. 1989-1997.6.
- Gao, W., et al., Investigation of Synthetic Relaxometry and Diffusion Measures in the Differentiation of Benign and Malignant Breast Lesions as Compared to BI-RADS. J Magn Reson Imaging, 2021. 53(4): p. 1118-1127.7.
- Yang, F., et al., Histogram analysis of quantitative parameters from synthetic MRI: correlations with prognostic factors in nasopharyngeal carcinoma. Eur Radiol, 2023. 33(8): p. 5344-5354.
Figures