4824
Multi-Center and Multi-Vendor Platform DCE-MRI Prediction of Breast Cancer Therapy Response: A Preliminary Comparison of Imaging Biomarkers1Oregon Health & Science University, Portland, OR, United States, 2University of Washington, Seattle, WA, United States, 3University of Iowa, Iowa City, IA, United States
Synopsis
Keywords: Treatment Response, Cancer, Multi-Center and Multi-Vendor platform, DCE-MRI, Therapy Response, Ktrans
Motivation: Validate Shutter-Speed model (SSM) DCE-MRI as a robust predictor of breast cancer (BC) response to neoadjuvant chemotherapy (NAC) in a multi-center and multi-vendor platform setting.
Goal(s): Compare tumor size, semi-quantitative, and quantitative DCE-MRI for early prediction of NAC response.
Approach: BC patients treated with NAC underwent longitudinal high spatiotemporal resolution DCE-MRI at three sites using a 3T Siemens, GE, or Philips system. Semi-quantitative signal-enhancement-ratio (SER) and quantitative Tofts model (TM) and SSM pharmacokinetic (PK) parameters were derived from DCE time-course data.
Results: PK parameters outperformed size and SER while SSM was superior to TM in early prediction of pathologic response.
Impact: It is feasible to implement quantitative high spatiotemporal resolution SSM DCE-MRI in trials with multi-center and multi-vendor platform settings for robust assessment of BC response to NAC.
Introduction
Accurate early prediction of breast cancer (BC) response to neoadjuvant chemotherapy (NAC) may allow individually tailored treatment strategies. Quantitative DCE-MRI using pharmacokinetic (PK) modeling is increasingly used in research to assess BC response to NAC.1 However, such studies are often single-center and single-vendor platform investigations with spatial resolution and coverage sacrificed for high temporal resolution suitable for PK analysis. Here we report preliminary results from a multi-center (MC) and multi-vendor platform (MP) high spatiotemporal resolution DCE-MRI study and compare changes in quantitative PK parameters, a semi-quantitative metric, and imaging tumor size for early prediction of BC response to NAC.Methods
BC patients treated with NAC underwent a longitudinal DCE-MRI study at three sites using a 3T Siemens, GE, or Philips system, pre-NAC [visit 1 (V1)], after the first NAC cycle (V2), at NAC midpoint (V3), and after NAC but before surgery (V4). High spatiotemporal resolution 3D axial bilateral and full coverage DCE-MRI was performed using k-space-undersampling and view-sharing vendor sequences: TWIST2 (Siemens), DISCO3 (GE), and 4D-TRAK4 (Philips). Other acquisition parameters include 10o FA, minimal TE, 3-6 ms TR, 0.7-1.1 mm in-plane resolution and 1.0-1.5 mm slice thickness, 12-16 s temporal resolution, and 9-10 min acquisition time.5 B1 maps and variable FA (VFA, 3o, 9o, and 15o) images were acquired immediately before DCE-MRI for B1-corrected quantification of pre-contrast R1, R10. QA/QC scans of a breast phantom with ground-truth R1 values were performed regularly at the 3 sites.Tumor longest diameter (LD) was measured by local radiologists based on RECIST 1.1.6 Voxel-based DCE time-course data within tumor ROIs were subjected to centralized semi-quantitative analysis to calculate signal-enhancement-ratio (SER)7 and quantitative PK analysis using the Tofts model (TM)8 and Shutter-Speed model (SSM).9,10 The SSM accounts for water exchange kinetics across cell membrane.9,10 A population-averaged AIF from breast DCE-MRI11 and a fixed literature-reported12,13 R10 = 0.60 s-1 were used for PK analysis. The use of fixed R10 was due to >80% overestimation of phantom R1 (error under investigation) and consequent failure in PK modeling of human data using VFA-measured R10 from one scanner platform, but is nonetheless a practical approach.14 Tumor mean and interquartile range of the voxel value distribution (iqr) for SER and PK parameters were calculated from respective voxel parameter values.
Results
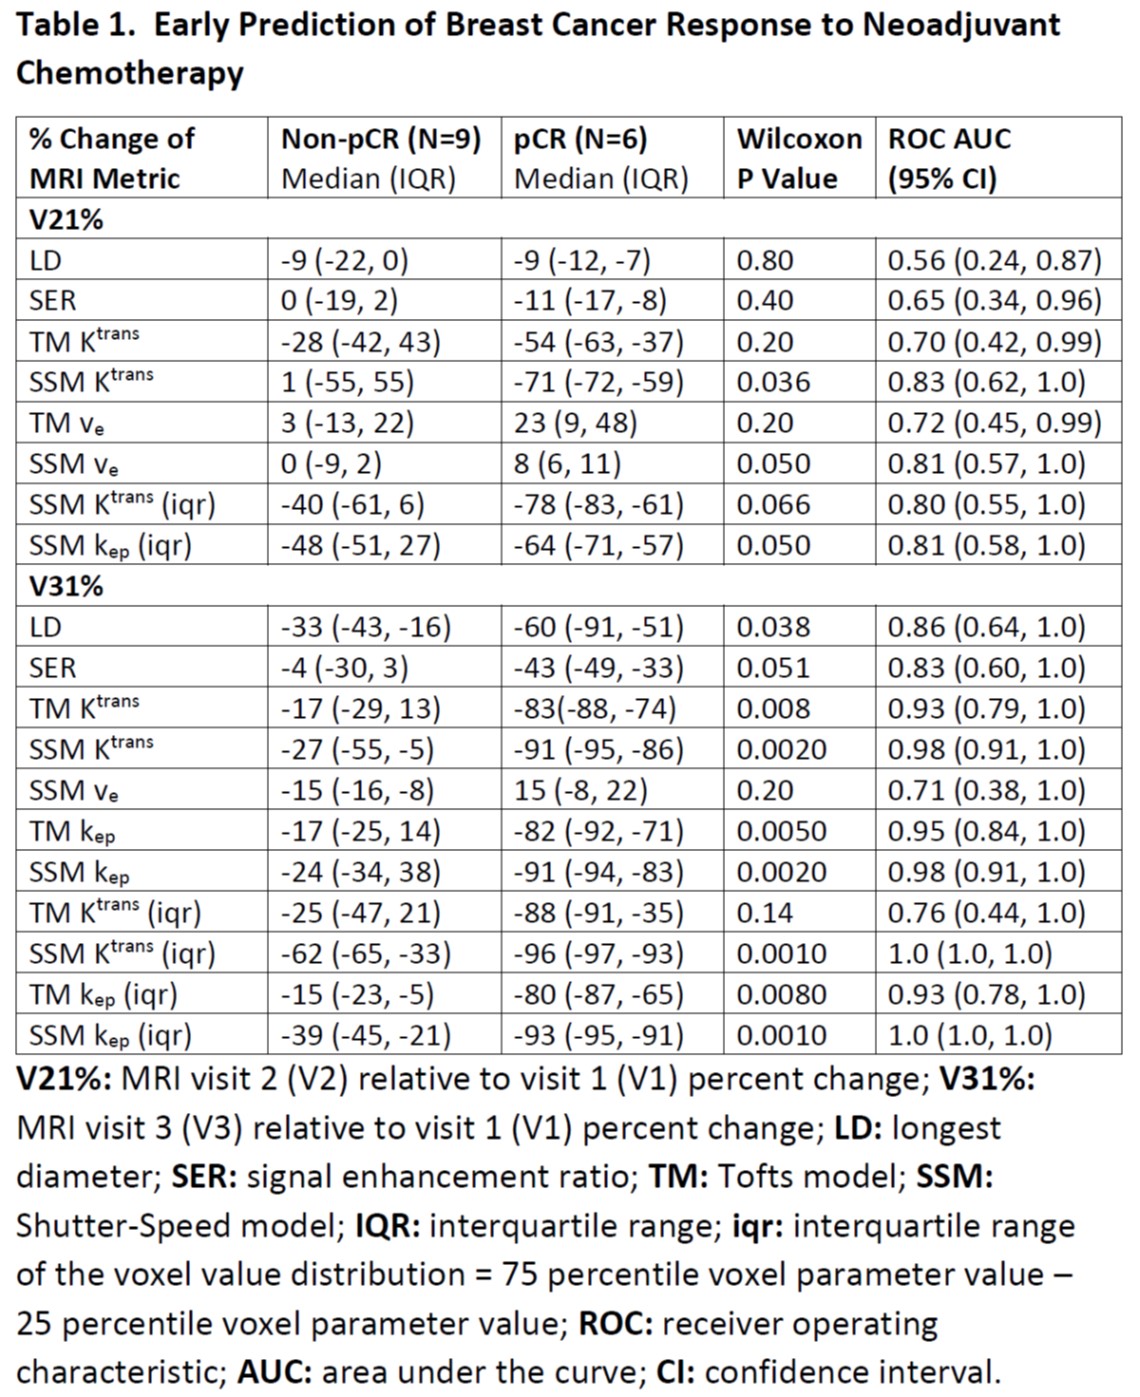
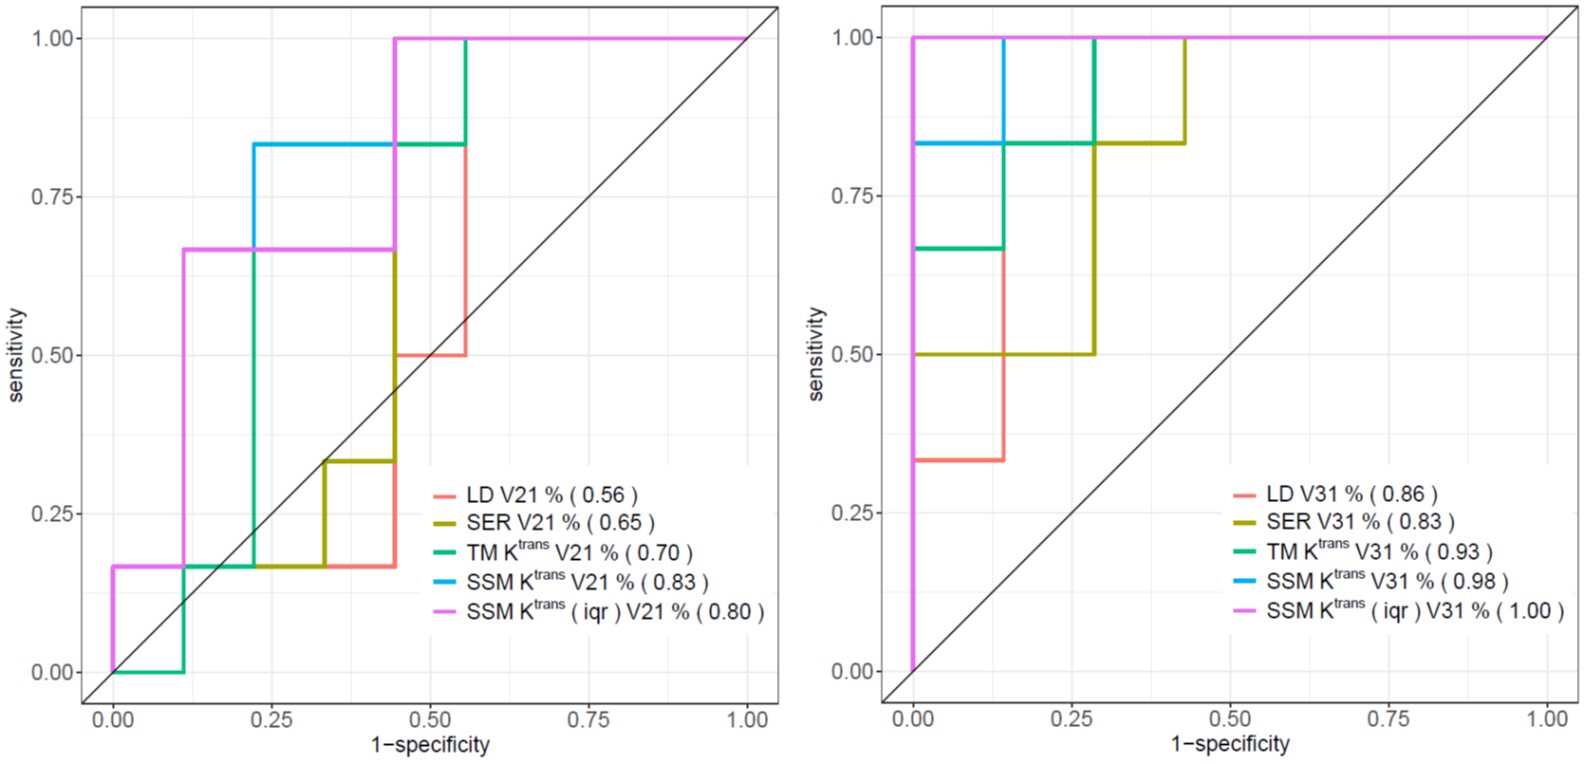
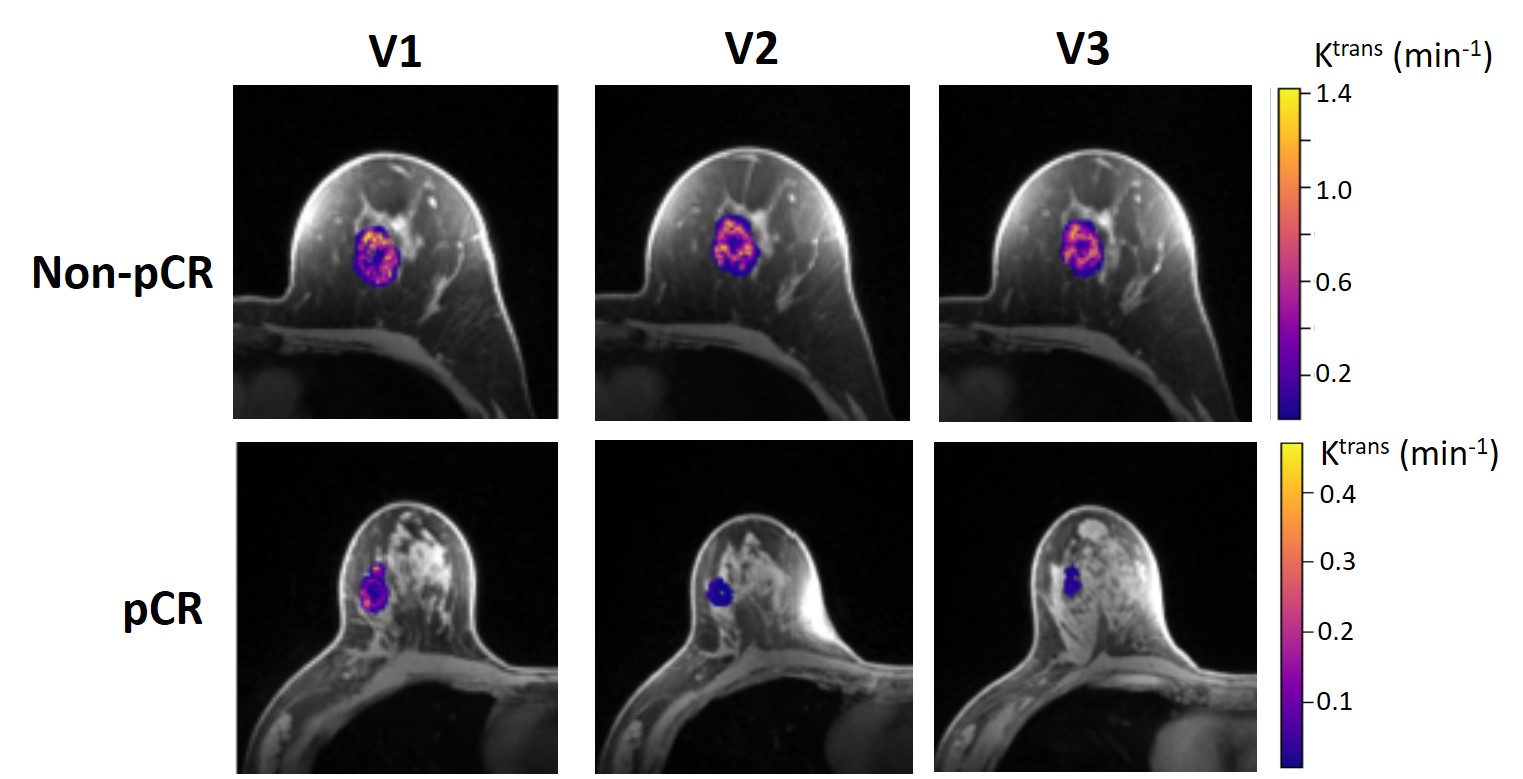
Data from fifteen patients (two missed V3 scans) who have completed the study with pathologic response outcomes to date were analyzed, with 6 patients achieving pathologic complete response (pCR). Table 1 tabulates percent changes in MRI metrics [V21% (V2 relative to V1) and V31%] of the pCR and non-pCR groups, P values from Wilcoxon test comparing the two groups, as well as ROC AUC values for early prediction of pCR vs. non-pCR. Only PK parameters with AUC ≥ 0.7 are listed. After the first NAC cycle, V21% of LD was a poor predictor of response with AUC = 0.56, while V21% of SER and PK parameters showed fair to good predictive performances with the SSM parameters Ktrans, ve, Ktrans (iqr), and kep (iqr) having AUC ≥ 0.80. At NAC midpoint, while V31% of both LD and SER demonstrated similar good predictive performances, V31% of TM and SSM parameters were excellent predictors with AUC > 0.90. In fact, both SSM Ktrans (iqr) and kep (iqr) separated the two groups completely with AUC = 1. Figure 1 shows ROC curves for V21% and V31% of LD, SER, and representative PK metrics. Figure 2 depicts tumor SSM Ktrans parametric color maps at V1, V2, and V3 for a non-pCR and a pCR patient.Discussion and Conclusion
The preliminary results from this MC and MP study show that, after only one NAC cycle, semi-quantitative and quantitative DCE-MRI metrics outperformed tumor size measurement in early prediction of BC response to NAC. Ktrans consistently provided more accurate prediction of response compared to LD and SER after the first NAC cycle and at NAC midpoint. Furthermore, SSM Ktrans and kep were superior to their TM counterparts in prediction of response, likely due to the greater dynamic ranges of these SSM parameter changes in response to NAC.5,11 The larger decreases of Ktrans (iqr) and kep (iqr) in pCRs compared to non-pCRs at V2 and V3 indicate greater decreases in tumor perfusion/permeability heterogeneity in responding patients. Initial lessons learned include the importance of QA/QC scans in the MC and MP setting and the option of using fixed R10 for PK analysis when R10 measurement was unreliable on one platform. The preliminary findings warrant validation with increased sample size from this study in the coming years.Acknowledgements
NIH grant R01 CA248192References
1. Huang W. Quantitative DCE-MRI of the Breast. Chapter 22, pp 425-458. In: Pinker K, Mann R, Partridge S eds. Breast MRI – State of the Art and Future Directions. Elsevier Academic Press, London UK, 2022.
2. Song T, Laine AF, Chen Q, Rusinek H, Bokacheva L, Lim RP, et al. Optimal k-space sampling for dynamic contrast-enhanced MRI with an application to MR renography. Magn Reson Med 2009;61:1242-1248.
3. Saranathan M, Rettmann DW, Hargreaves BA, Clarke SE, Vasanawala SS. Differential subsampling with Cartesian ordering (DISCO): a high spatio-temporal resolution Dixon imaging sequence for multiphasic contrast enhanced abdominal imaging. J Magn Reson Imaging. 2012;35:1484–1492.
4. Willinek WA, Hadizadeh DR, von Falkenhausen M, Urbach H, Hoogeveen R, Schild HH, Gieseke J. 4D time-resolved MR angiography with keyhole (4D-TRAK): more than 60 times accelerated MRA using a combination of CENTRA, keyhole, and SENSE at 3.0T. J Magn Reson Imaging 2008;27:1455-1460.
5. Tudorica A, Oh KY, Chui SYC, Roy N, Troxell ML, Naik A, et al. Early Prediction and Evaluation of Breast Cancer Response to Neoadjuvant Chemotherapy Using Quantitative DCE-MRI. Transl Oncol 2016;9:8-17.
6. Eisenhauer EA, Therasse P, Bogaerts J, Schwartz LH, Sargent D, Ford R, et al. New response evaluation criteria in solid tumors: revised RECIST guideline (version 1.1). Eur J Cancer 2009;45:228-247.
7. Hylton NM, Blume JD, Bernreuter WK, Pisano ED, Rosen MA, Morris EA, et al. Locally advanced breast cancer: MR imaging for prediction of response to neoadjuvant chemotherapy – results from ACRIN 6657/I-SPY trial. Radiology 2012;263:663-672.
8. Tofts PS, Brix G, Buckley DL, Evelhoch JL, Henderson E, Knopp MV, et al. Estimating kinetic parameters from dynamic contrast-enhanced T1-weighted MRI of a diffusable tracer: standardized quantities and symbols. J Magn Reson Imaging 1999;10:223-232.
9. Yankeelov TE, Rooney WD, Li X, Springer CS. Variation of the relaxographic “Shutter-Speed” for transcytolemmal water exchange affects the CR bolus-tracking curve shape. Magn Reson Med 2003;50:1151-1169.
10. Li X, Rooney WD, Springer CS. A unified pharmacokinetic theory for intravascular and extracellular contrast agents. Magn Reson Med 2005;54:1351-1359. [Erratum. Magn Reson Med 2006;55:1217.]
11. Huang W, Tudorica LA, Li X, Thakur SB, Chen Y, Morris EA, et al. Discrimination of benign and malignant breast lesions by using shutter-speed dynamic contrast-enhanced MR imaging. Radiology 2011;261:394-403.
12. Pineda FD, Medved M, Fan X, Karczmar GS. B1 and T1 mapping of the breast with a reference tissue method. Magn Reson Med 2016;75:1565-1573.
13. Rakow-Penner R, Daniel B, Yu H, Sawyer-Glover A, Glover GH. Relaxation times of breast tissue at 1.5T and 3T measured using IDEAL. J Magn Reson Imaging 2006;23:87-91.
14. Huang W, Wang Y, Panicek DM, Schwartz LH, Koutcher JA. Feasibility of using limited-population-based average R10 for pharmacokinetic modeling of osteosarcoma dynamic contrast-enhanced MRI data. Magn Reson Imaging 2009; 27: 852-858.
Figures