4819
Value of placental stiffness using virtual magnetic resonance elastography in pregnancies complicated by pre-eclampsia1Department of Radiology, Shanghai First Maternity and Infant Hospital , Tongji University, Shanghai, China
Synopsis
Keywords: Placenta, Placenta
Motivation: To evaluate virtual magnetic resonance elastography in healthy and preeclamptic(PE) pregnancies.
Goal(s): To compare the stiffness value (μdiff) and apparent diffusion coeffificient (ADC) in healthy and PE pregnancies.
Approach: DWI(b-value of 50 ,200and 800 s/mm2 ) were performed on all pregnant women using a 1.5 T MRI scanner. The value of μdiff and ADC were calculated and compared between groups.
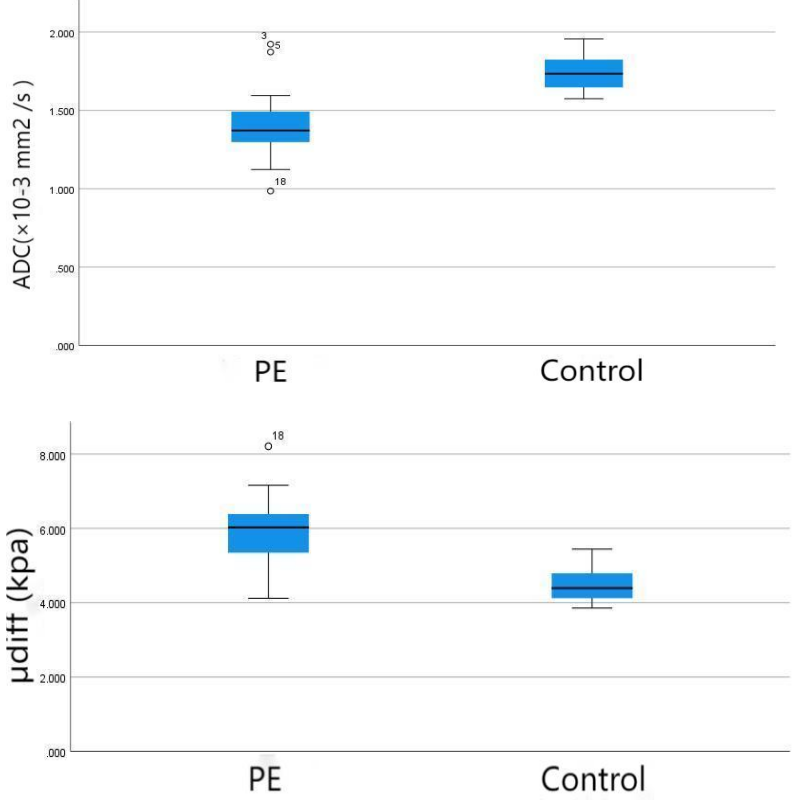
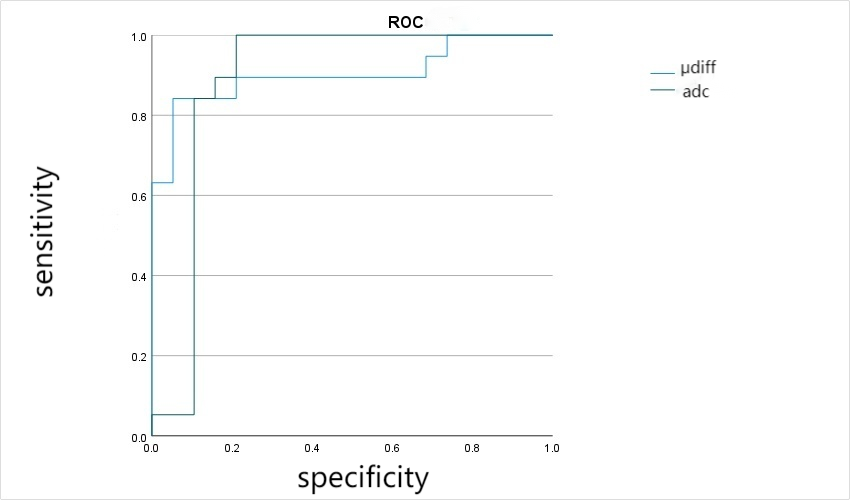
Results: The mean ADC value of the control and PE groups were 1.414±0.228×10⁻³ mm2/s and 1.737±0.107×10⁻³ mm2/s, respectively. The mean μdiff value of PE were 5.901±1.757 and 4.618±2.055 kPa, respectively. The area under the curve for μdiff was 0.903 and ADC was 0.796, respectively.
Impact: Placental μdiff value was found to be more reliable than ADC in differentiating between normal and preeclampsia placentas.
Introduction
About 10% of pregnancies are complicated by hypertensive disorders,pre-eclampsia(PE) is the most severe subtype of hypertensive disorder complicating pregnancy.The role of the placenta in the pathology of PE remains incompletely understood.Le Bihan proposed a diffusion-weighted imaging (DWI)-based virtual elastography (vMRE).In recent years, this approach was also applied to studies on the placenta. However, the value of vMRE for detecting the placental stiffness of pregnancies with PE is still unknown. Therefore, this study was aimed to explore the predictive value of DWI-based elasticity in PE pregnancies.Materials and methods
This prospective cohort observational study was carried out in our Hospital between January 2023 and September 2023. It was approved by the institutional ethics committee.After selection, 60 pregnancies were enrolled in the final analysis, including 40 controls and 20 PE pregnancies.All patients examined on 1.5-T MRI system (MAGNETOM Aera, Siemens ). The MRI protocols were as follows: T1-weighted vibe sequence [repetition time (TR)/echo time (TE)=4.85 ms/2.38ms, slice thickness=5.0 mm, feld of view (FOV)=400×368 mm2 , flip angle (FA)=10°, and in-plane resolution=1.5×1.5 mm2 ]; T2-weighted half-Fourier-acquired single-shot turbo spin echo (HASTE) sequence (TR/TE=1300 ms/109 ms, slice thickness=5.0 mm, FOV=400×309 mm2 , FA=120°, and in-plane resolution=1.5×1.5 mm2 ); and multi-b value DWI sequence (TR/TE=6400 ms/65 ms, slicethickness=5 mm, FOV=320×320 mm2 , and in-plane resolution=3.5×3.5 mm2 ) with a spectrum of varying b-values of 50, 200 and 800 s/mm2. The total scan duration was less than 10 min.The statistical analyses were performed using SPSS, version 25, for Windows (SPSS Inc, IL, USA). Student’s t test was used to perform pairwise comparisons. χ2 test was used to test association between categorical variables. Multiple regression analysis was used to assess the relationship between placental stiffness and preeclampsia. The receiver operating characteristic (ROC) curve analysis and the area under the curve (AUC) were used to quantify and compare the diagnostic value of each remarkable parameter. The potential relationship between μdiff and gestational week at MRI in normal pregnancies was explored by a linear regression model. A p value<0.05 indicated a statistically considerable difference.Result
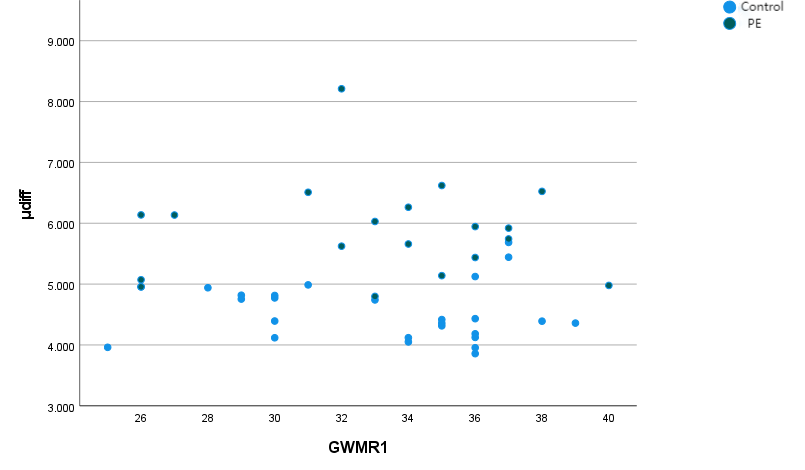
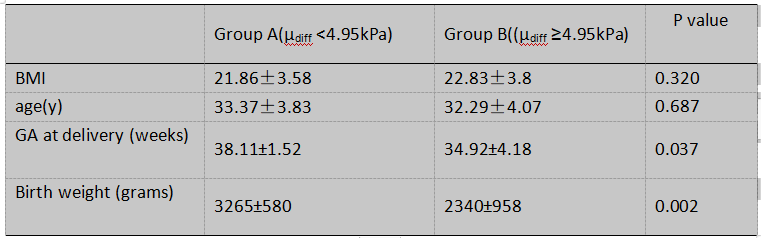
The mean ADC value was lower in PE groups than in control groups(1.414±0.228×10⁻³ mm2 /s versus 1.737±0.107×10⁻³ mm2/s, p=0.031). The mean the μdiff values were 5.901±1.757 kPa and 4.618±2.055 kPa for PE and control groups. The AUC of ROC curve were 0.903, 0.796 in PE and control groups, respectively.The optimized cutoff value of placental stiffness value for the presence of PE was 4.95kPa. There was no statistically significant correlation between the placental stiffness value and gestational age.We grouped the study population based on the optimized cutoff value for placental stiffness (e.g. Group A =placental stiffness<4.95 kPa; Group B=placental stiffness≥4.95kPa;Table 4) and evaluated their respective pregnancy and neonatal outcomes.We found Group B had significantly lower birth weight and GA at the time of delivery (2340±958 g and 34.92 ± 4.18 weeks, respectively) than Group A (3265±580 g and 38.11±1.52 weeks, respectively).Discussion
In this study, we determined that the mean placental stiffness was significantly higher in PE pregnancies than controls, and is not affected by maternal age, BMI,GA. It was similar with previous studies.ADC has been reported to be lower in abnormal placentas than in normal placentas. Restricted diffusion may result from reduction of the gas exchange area in PE complicated placentas.In normal pregnancy, placentation occurs by trophoblast invasion of the maternal spiral arteries to create a low resistance, high-flow maternal uteroplacental circulation. In PE, trophoblast invasion of the maternal spiral arteries is thought to be impaired and, as a result, placental perfusion is reduced which creates a hypoxic environment in the placenta . Hypoxia stimulates collagen deposition, vascular fibrin deposition, and fibrosis, which together can lead to higher tissue stiffness . PE placentas exhibit injuries such as placental vascular lesions and fibrosis , vesicular and perivillous fibrin deposition , syncytial knots and microcalcifications , findings that could explain the increased placental stiffness seen in PE.Conclusion
Compared to healthy pregnancies, placentas of preeclamptic pregnancies are stiffer .Placental vMRE was found to be more reliable than ADC in differentiating between normal and preeclamptic placentas.Acknowledgements
Feifei Qu,Department of Siemens Health Care, China.
Yajing Mao,Department of Obstetrics,Jiading District Maternal and Child Health Hospital,Shanghai
References
1. Junshen He , Chunlin Chen , Liqun Xu,et al. Diffusion-Derived Vessel Density Computed From a Simplified Intravoxel Incoherent Motion Imaging Protocol in Pregnancies Complicated by Early Preeclampsia: A Novel Biomarker of Placental Dysfunction. Hypertension. 2023; Aug; 80(8): 1658-1667.
2. Wainstock T, Sergienko R, Sheiner E .Who is at risk for preeclampsia? Risk factors for developing initial preeclampsia in a subsequent pregnancy.2020; J Clin Med 9(4):1103.
3. Abubakar II, Tillmann T, Banerjee A Global, regional, and national age-sex specifc all-cause and cause-specifc mortality for 240 causes of death, 1990–2013: a systematic analysis for the Global Burden of Disease Study 2013. 2015;Lancet 385(9963):117–171F.
3. Michail Spiliopoulos, Che-Ying Kuo , Avinash Eranki, et al.Characterizing placental stiffness using ultrasound shear-wave elastography in healthy and preeclamptic pregnancies. Arch Gynecol Obstet. 2020; Nov;302(5):1103-1112.
4. Le Bihan D, Ichikawa S, Motosugi U . Difusion and intravoxel incoherent motion MR imaging-based virtual elastography: a hypothesisgenerating study in the liver. 2017;Radiology 285:609–619.
5. Abu AN, Dillman JR, Gandhi DB, Dudley JA, Trout AT, Miethke AG.Association between liver diffusion-weighted imaging apparent diffusioncoefcient values and other measures of liver disease in pediatric autoimmune liver disease patients. 2021;Abdom Radiol (NY) 46:197–204
6.Aunan-Diop JS, Andersen M, Friismose AI et al .Virtual magnetic resonance elastography predicts the intraoperative consistency of meningiomas. 2022;J Neuroradiol 50:396–401
7. Lu J, Liu T, Li J, Li X, Yang J Intravoxel incoherent motion MR imaging-based virtual elastography for the assessment of placenta accreta.2022; ISMRM 3779.
8.Liu T, Lu J, Li J, Yang J .Difference of stiffness between the fetal and the maternal part of the placenta by virtual magnetic resonance elastography. 2022;ISMRM 1322.
9.Song F, Wu W, Qian Z, et al. Assessment of the placenta in intrauterine growth restriction by diffusion-weighted imaging and proton magnetic resonance spectroscopy. Reprod Sci 2017;24(4):575e81.
10. Li WJ, Wei ZT, Yan RL, Zhang YL.Detection of placenta elasticity modulus by quantitative real-time shear-wave imaging. Clin Exp Obstet Gynecol.2012; 39(4):470–473.
Figures