4818
Field and TE independent liver iron concentration estimation using signal intensity ratios1Radiology, Children's Hospital of Los Angeles-USC KSOM, Los Angeles, CA, United States, 2Pediatrics and Radiology, Children's Hospital of Los Angeles-USC KSOM, Los Angeles, CA, United States
Synopsis
Keywords: Liver, Relaxometry, Iron Overload
Motivation: Estimation of liver iron concentration by R2* relaxation (LICR2*) is a powerful and widely used technique, however, it may fail from signal loss at high liver iron concentration.
Goal(s): To estimate LIC from a single-TE liver-muscle signal intensity ratio (LICSIR) and validate at 1.5 and 3.0 Tesla.
Approach: Using LICR2* estimates collected at 1.5T as a reference, we compared LICSIR estimates in 15 subjects who had undergone MRI examination at both 1.5T and 3.0T.
Results: We were able to derive field-independent scaling constants that allow LICSIR estimation at 1.5 and 3.0T, more than doubling the effective dynamic range of LICR2* estimation.
Impact: This generalized framework for LICSIR estimation allows reasonable LIC values to be reported (and trended) in patients for whom traditional relaxometry has failed. It also allows approximate LIC calculation from commonly used single and dual echo gradient echo acquisitions.
Introduction
Measurement of hepatic iron overload is an important clinical problem in patients with hemosiderosis from chronic transfusions, iron hyperabsorption syndromes, and liver disease1. R2* or R2 relaxation values are calculated from multiple TE gradient echo or spin-echo sequences, but both fail at high LIC because signal is extinguished over most TEs1. In this situation, however, there is often sufficient signal in the first echo to characterize the ratio between liver and muscle darkening. We postulated that we could formulate a generalizable framework for LIC estimation at any TE and field strength using basic principles of the signal decay equation.Methods
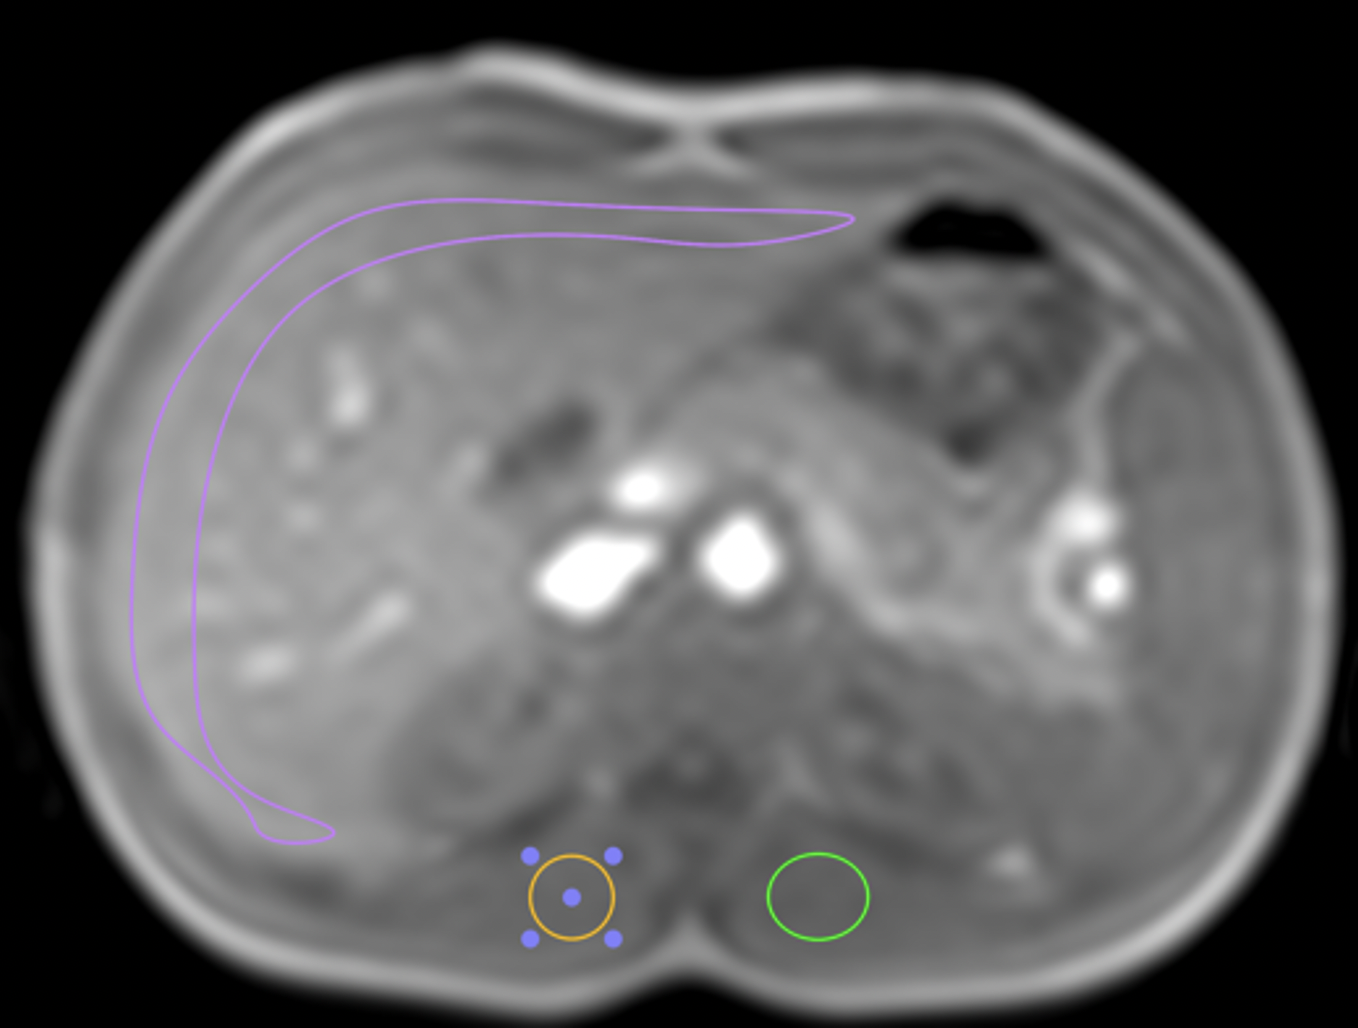
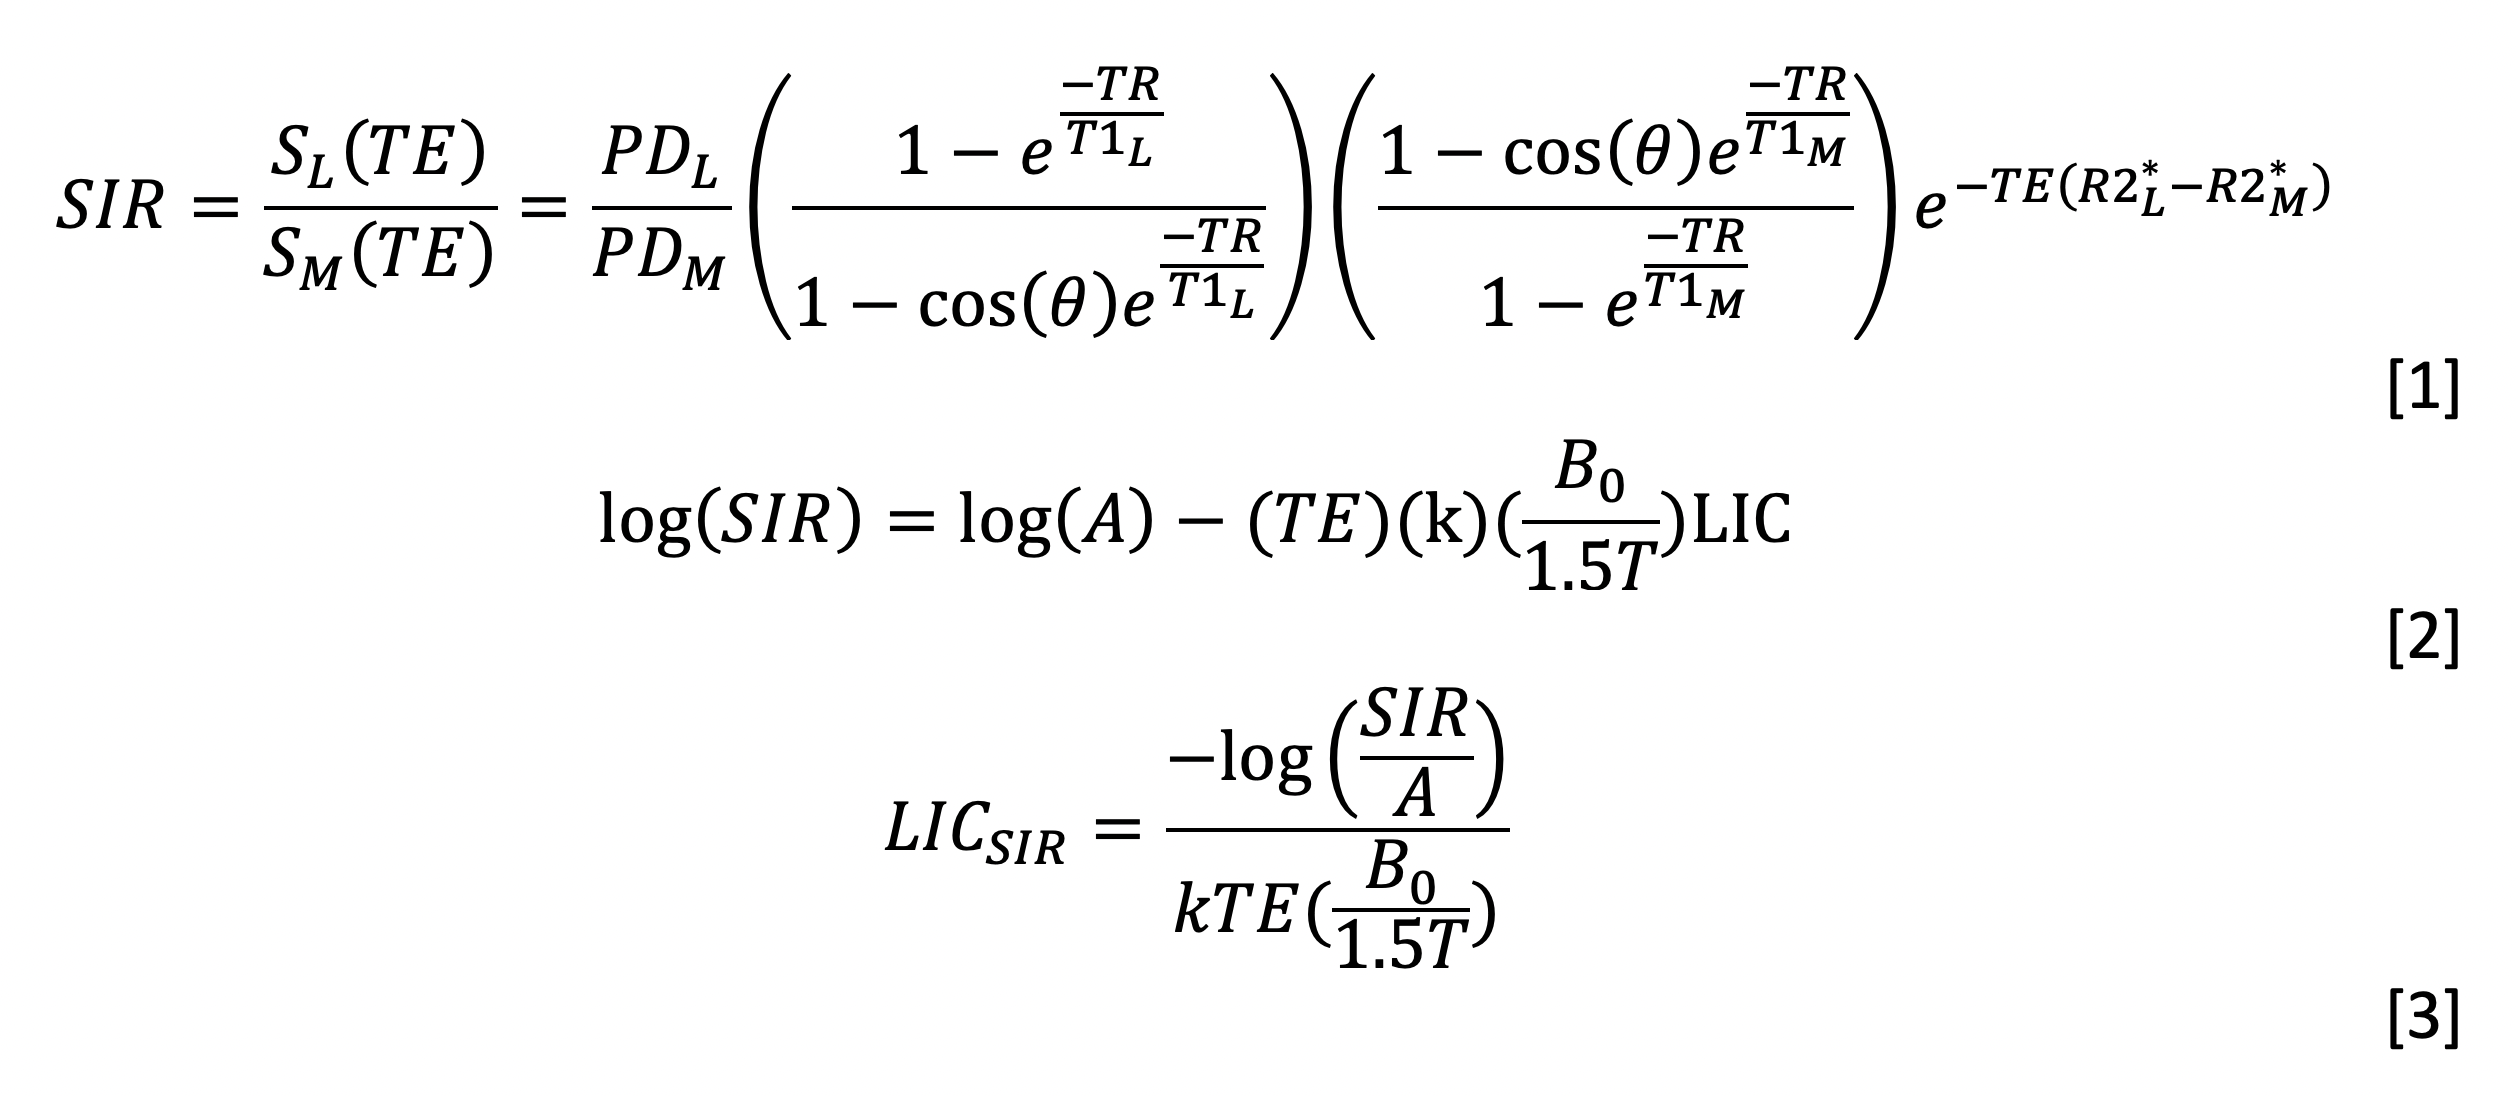
All subjects provided informed consent under an IRB-approved protocol(CCI#14-00034). All subjects underwent assessment of liver R2* at 1.5T (Philips Achieva) and 3.0T (Philips Ingenia) scanners in close temporal proximity (5±11 days) using product multi-echo, gradient echo pulse sequences. Reference LIC from the 1.5T scan was calculated using previously published methods1 and calibration2. Signal intensity ratios (SIRs) were calculated from a region of interest(ROI) placed just inside the major curvature of the liver, and two ~4 cm2 circular ROI’s place in the paraspinous muscles in the same imaging plane (Figure 1). The liver-muscle SIR can be written as shown in Figure 2, Eq. [1], where PD is the proton density, TR is the repetition time, TE is the echo time, T1 is the longitudinal relaxation rate, θ is the flip angle, R2* is the transverse relaxation rate and the subscripts L and M designate “liver” and “muscle” specific values, respectively. Taking the log, collecting terms, and substituting delta R2* = k(B0/Bref)LIC yields Equation [2], where the PD and T1 terms have been collected in a parameter ‘A’. Once A and k have been estimated, LICSIR estimates at any field strength can be calculated using Equation [3].Results
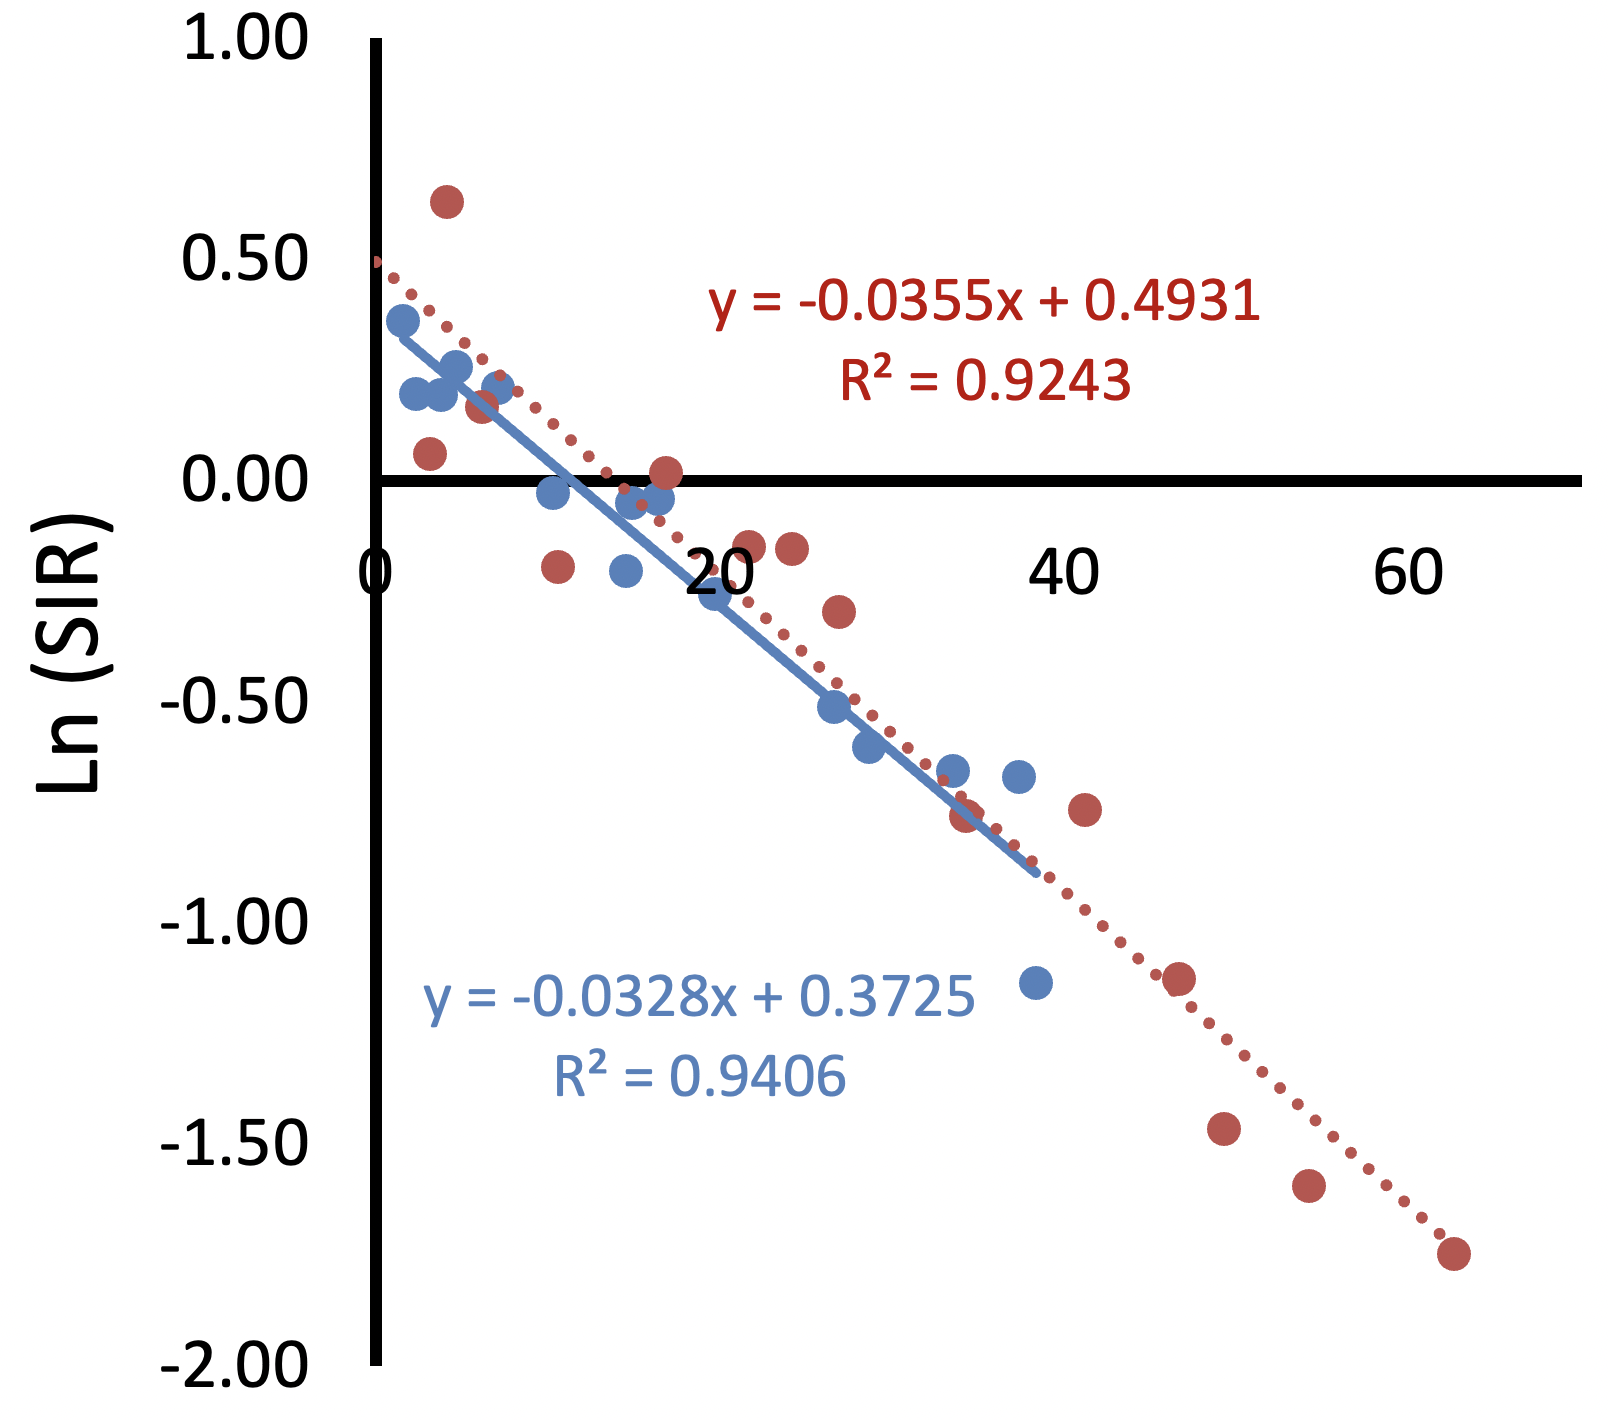
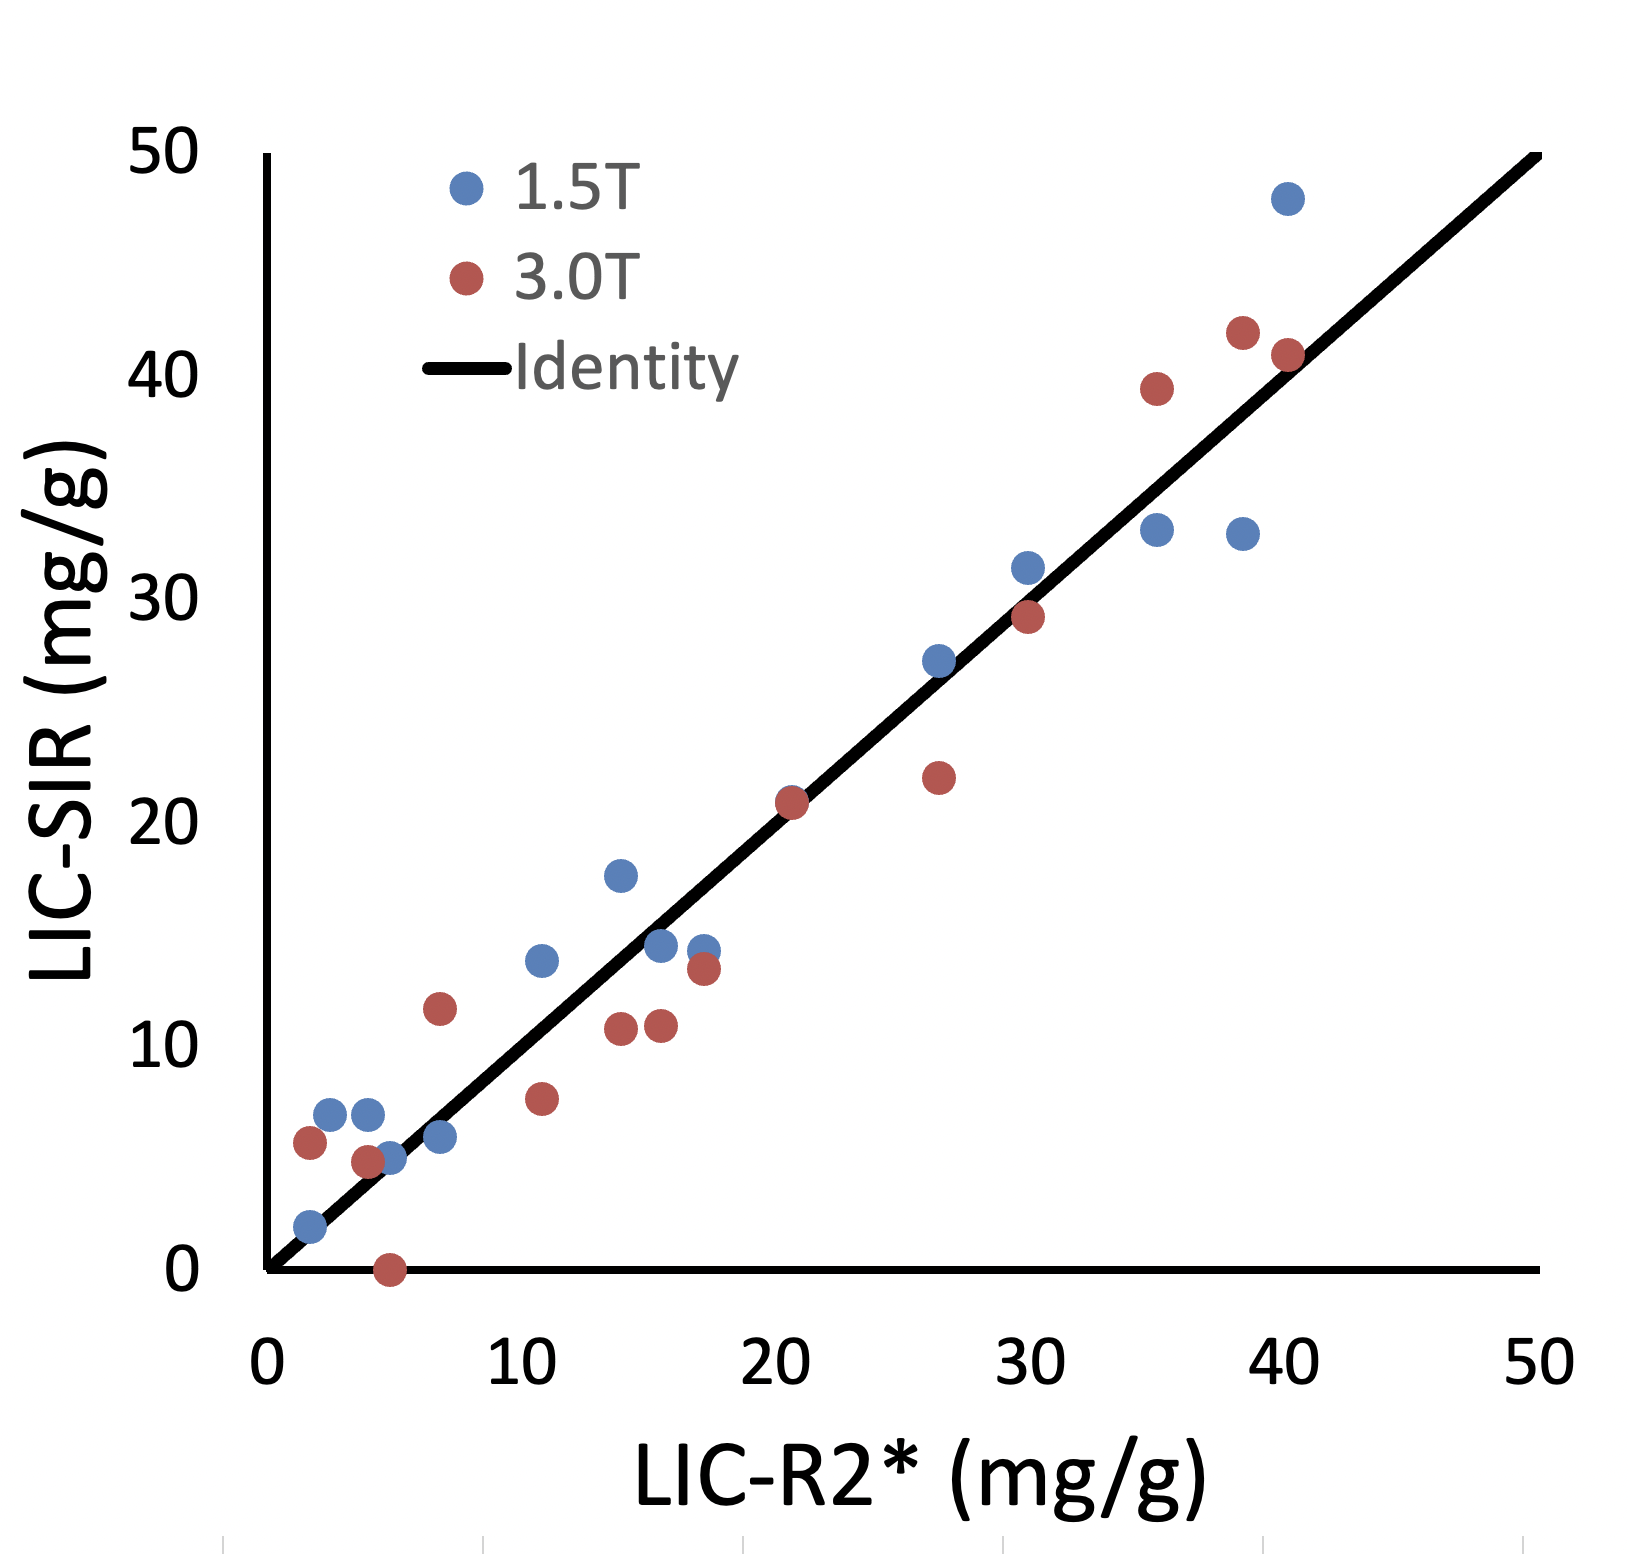
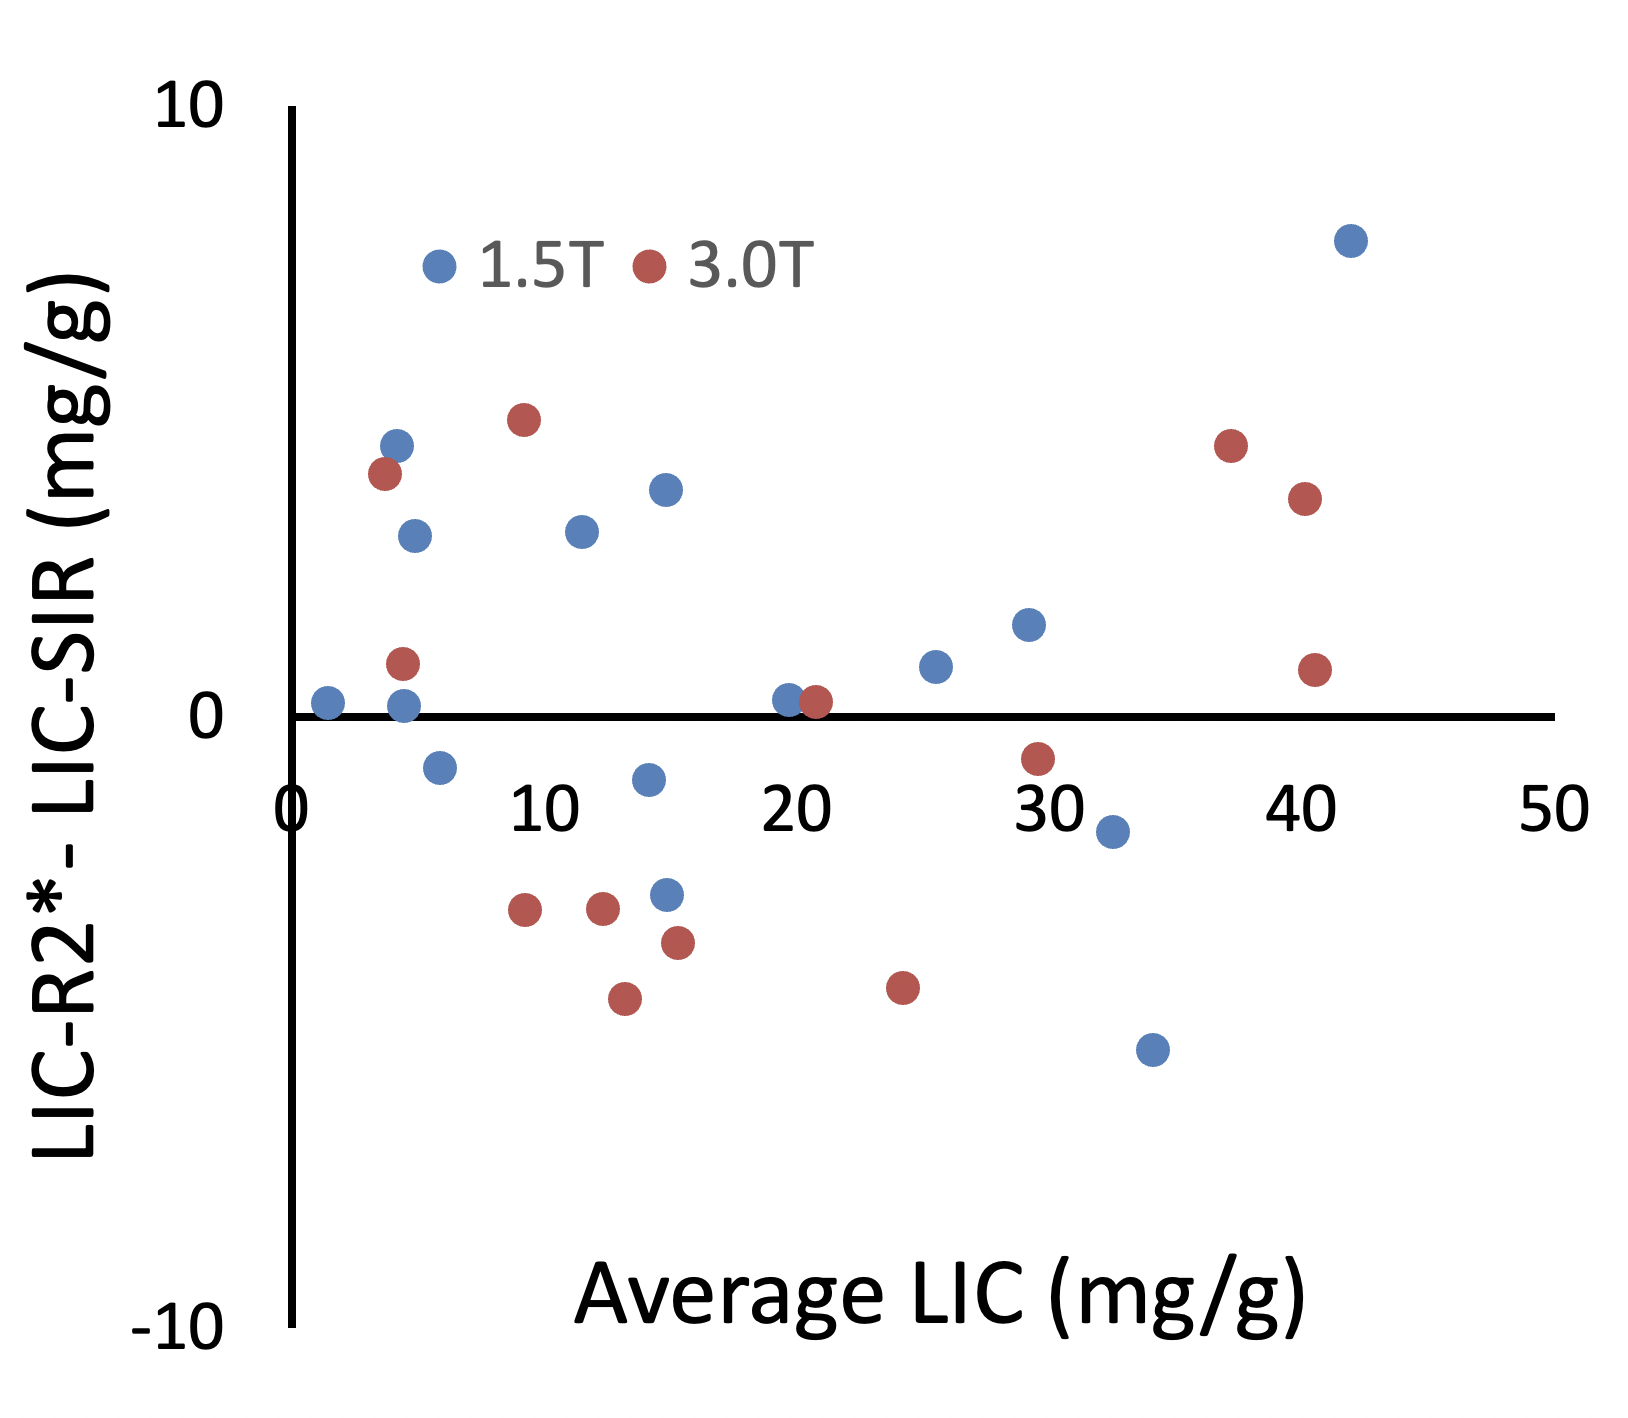
Figure 3 demonstrates log(SIR) plotted against the product of TE, B0/1.5T, and LIC and linear fits at 1.5T and 3.0T. Neither the slope or intercept were different across field strength, resulting in a pooled k and log(A) of -0.034 and 0.4209, respectively, r=-0.965, p<0.0001. Figure 4 demonstrates the LICSIR for both 1.5T and 3.0T values plotted against the reference, 1.5T LICR2* value. There is excellent agreement across the entire dynamic range of iron overload (r2 = 0.94). Bland-Altman analysis is shown in Figure 5. LICSIR and LICR2* estimates were unbiased with means and standard deviations of 0.8 ± 3.2 mg/g (1.5T), and -0.5 ± 3.7 (3.0T) mg/g, respectively.Discussion
LICR2* more accurate than LICSIR at low to moderate iron overload because it controls for signal variations caused by T1 decay, B1+ inhomogeneity, and nonuniform coil sensitivities. However, LICSIR estimates offer reasonable accuracy when signal loss precludes liver R2* measurement. In Figure 2, for example, LICSIR estimates at 3T were accurate up to 40 mg/g, more than double the typical R2*LIC dynamic range achievable at 3T3. To provide context, roughly 6% of our routine clinical R2* assessments exceed the dynamic range at 1.5T and 20% fail at 3T. With more 3T magnets being installed, the proposed simple mechanism to overcome the dynamic range limitations could have important consequences.The use of SIR for LIC estimation has a long history, but previous applications have placed stringent restrictions on imaging hardware (such avoiding phased-array coils) and scan parameters to improve LIC prediction for mild to moderate iron overload4. Most of the uncertainty in equation 2 (and Figures 4, 5), arise from the subject and scanner dependent factors in the ‘A’ term. This uncertainty is largely LIC independent (see Figure 5), becoming relatively less important at higher iron concentrations. That is, a standard-deviation of 3.2-3.7 mg/g is much more clinically acceptable at LICs greater than 20 mg/g, than below it. This allows “rescue” LIC calculation even with nonoptimized imaging parameters. In this study, default surface coil intensity compensation was used (CLEAR option) but there was no attempt to correct for the known, large, fluctuations in B1+ inhomogeneity5 from our single transmit systems. We did examine bootstrap corrections for T1 decay6, but inclusion did not improve LIC estimation (not shown).
LICSIR estimation could even be used to retrospectively estimate LIC in abdominal MRI studies that never acquired quantitative relaxometry. For example, most imaging protocols include in-phase/out-of-phase gradient echo imaging that could generate LIC estimates suitable for population-based clinical research.
Conclusion
In this paper, we extend a decades-old approach of LIC estimation to derive a field and parameter indifferent calibration that can extend the dynamic range of R2* (or R2) acquisitions, complementing multiecho relaxometry. We are currently performing cross vender and cross-sequence validation.Acknowledgements
This work supported by the National Institute for Diabetes, Digestive and Kidney Diseases (1R01DK097115-01A1), the National Center for Research Resources (UL1 TR001855-02), the Saban Research Institute, Agios Pharmaceuticals, and Philips Healthcare (Research Support In Kind)References
1Wood, J. C. Estimating tissue iron burden: current status and future prospects. Br J Haematol. 2015; 170(1): 15-28
2Wood, J. C., et al. MRI R2 and R2* mapping accurately estimates hepatic iron concentration in transfusion-dependent thalassemia and sickle cell disease patients. Blood. 2005; 106(4): 1460-1465
3Doyle EK, Toy K, Valdez B, Chia JM, Coates T and Wood JC. Ultra-short echo time images quantify high liver iron. Magn Reson Med. 2018;79:1579-1585
4Doyle EK, Thornton S, Ghugre NR, Coates TD, Nayak KS and Wood JC. Effects of B(1)(+) Heterogeneity on Spin Echo-Based Liver Iron Estimates. J Magn Reson Imaging. 2022;55:1419-1425.
5Gandon, Y., et al. Non-invasive assessment of hepatic iron stores by MRI. Lancet. 2004; 363(9406): 357-362
6Doyle EK, Thornton S, Toy KA, Powell AJ and Wood JC. Improving CPMG liver iron estimates with a T1 -corrected proton density estimator. Magn Reson Med. 2021;86:3348-3359
Figures