4817
The value of Native T1 mapping in identifying pancreatic ductal adenocarcinomas with different degree of pathological differentiation1Zhejiang Cancer Hospital, Hangzhou City,Zhejiang Province, China, 2Philips Healthcare, Shanghai, China
Synopsis
Keywords: Cancer, Relaxometry, T1-mapping
Motivation: MRI quantitative technique T1 mapping can reflect the change of intrinsic information of tissues
Goal(s): To explore the value of T1 mapping in PDCA with different degrees of differentiation
Approach: Comparison of PDCA with different degrees of differentiation, the T1 relaxation time before and after enhancement
Results: by comparing the T1 mapping values before and after enhancement of PDAC with different degrees of differentiation, it was found that as the degree of differentiation of PDAC was getting higher, the Native T1 value showed a tendency to increase. The Native T1 was moderately positively correlated with the degree of pathological differentiation
Impact: T1 mapping may serve as a noninvasive means of predicting the degree of pathologic differentiation of PDAC before surgery.Give clinicians earlier information.
Introduction
T1 mapping can provide quantitative assessment of tissue properties by measuring the pre- and post-enhancement T1 value [1]. It is commonly used in the assessment of fibrosis in myocardium, liver and chronic pancreatitis [2-4]. However, the degree of pathological differentiation of pancreatic ductal adenocarcinoma (PDAC) has rarely been reported. Therefore, the aim of this study was to investigate its application in the degree of pathological differentiation of PDAC using the T1 mapping technique.Methods
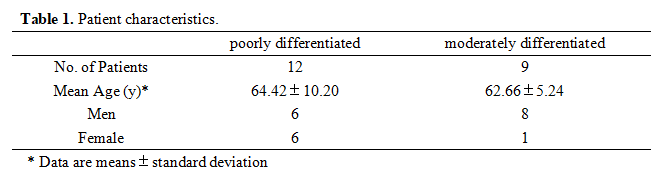
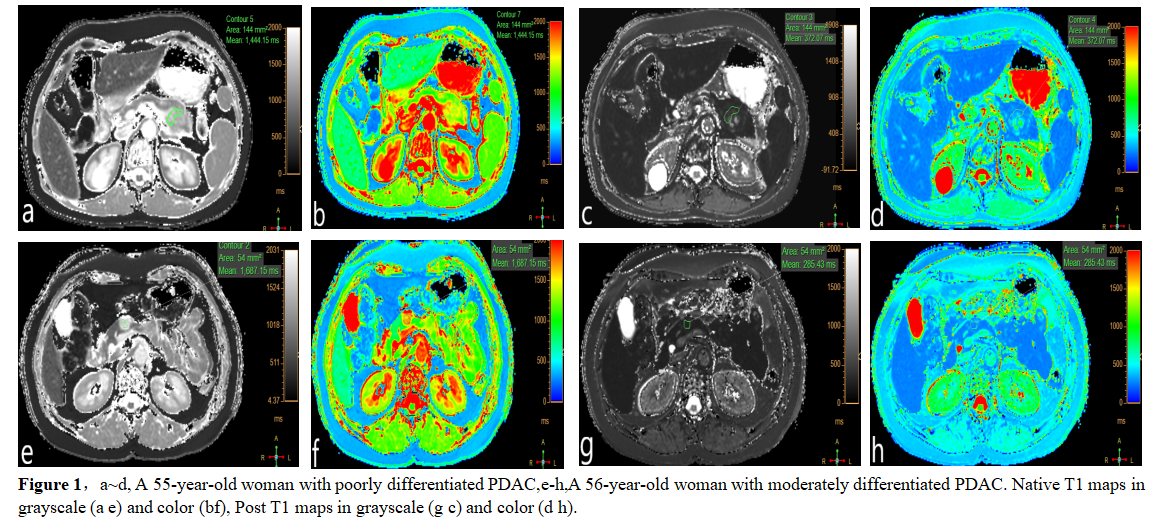
We retrospective collected 21 patients (12 poorly differentiated and 9 moderately differentiated PDAC) who underwent MRI for pancreatic mass with pathological findings of PDAC in our hospital from February 2021 to September 2023 (Table 1). All patients were scanned on the same machine (Ingenia CX, Philips Healthcare, the Netherlands). T1 mapping sequence scans were performed before and after contrast enhancement, in which T1 mapping scans were performed using MOLLI sequence with breath-hold acquisition, and the relevant parameters were TR 2.4 ms, TE 1.1 ms, flip angle of 20°, layer thickness of 5 mm, number of signal acquisitions of 1. FOV 36 cm × 38 cm, and matrix 180 × 190. All images were post-processed in PHILIPS ISP (Intellispace Portal, v.10.1.0.64190) (see Figure 1). The T1 relaxation time of the pancreatic lesion was measured by reference to the enhanced T1WI and T2WI axial images, and the region of interest (ROI) was drawn manually, avoiding the main pancreatic duct, surrounding blood vessels, fat, necrotic cystic degeneration and other components of the lesion, and the T1 relaxation time values of the pancreatic lesion were measured, and the values were recorded as Native T1 and Post T1 before and after enhancement, respectively. The T1 relaxation time reduction rate (∆T1%=(Native T1-Post T1)/Native T1) was calculated. All measurements were independently measured and recorded by two radiologists with more than 3 years of diagnostic experience.SPSS 20. 0 software was used for statistical analysis, and the Shapiro-Wilk method was used to test whether the continuous data conformed to the normal distribution. The mean±standard deviation (`X±s) was used for the data conforming to the normal distribution; otherwise, the median (quartile) M(P25, P75) was used to express the data. Data comparison was performed by the one-way analysis of variance (ANOVA) or the Kruskal- Wallis test, and two-sided P < 0.05 meant that the difference was statistically significant. For the parameters with P < 0.05, ROC curves were plotted, the area under the curve (AUC) was calculated, the cutoff value was determined, and the differential diagnostic efficacy was calculated. Spearman's correlation was used to analyze the relationship between the degree of pathological differentiation and T1 mapping parameters.Results
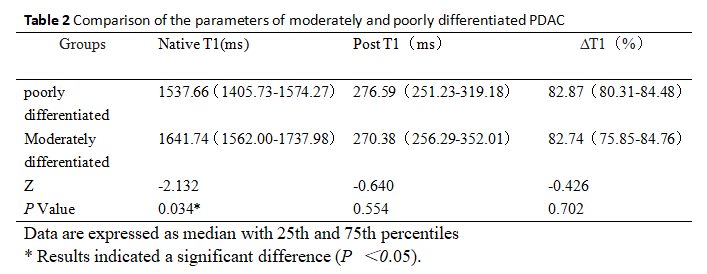
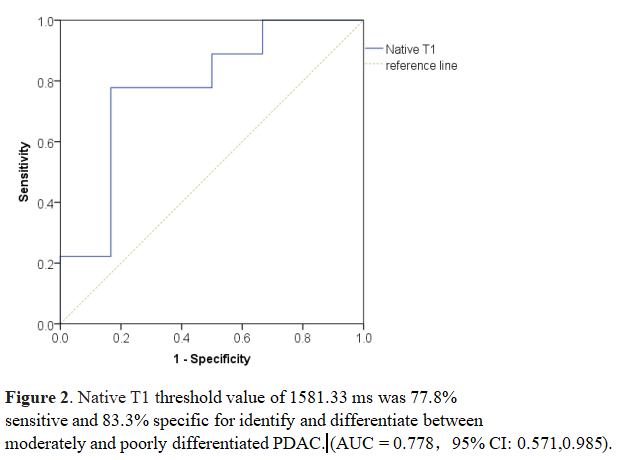
As shown in Table 2, Native T1 was statistically different between the two groups (P < 0.05), while Post T1 and ∆T1 were not (P > 0.05). Native T1 with cutoff value=1581.33 ms was utilized to identify and differentiate between moderately and poorly differentiated PDAC. The AUC of its ROC was 0.778 (95% CI: 0.571,0.985), with a sensitivity of 77.8% and a specificity of 83.3% (see Figure 2).The Native T1 value was positively correlated with the moderate degree of PDAC differentiation (r=0.477, P=0.029).Discussion
MRI quantitative technique T1 mapping can reflect the change of intrinsic information of tissues through the measurement of T1 relaxation time. In this study, by analyzing and comparing the T1 mapping values before and after enhancement of PDAC with different degrees of differentiation, it was found that as the degree of differentiation of PDAC was getting higher, the Native T1 value showed a tendency to increase. The Native T1 was moderately positively correlated with the degree of pathological differentiation, and the reason for the analysis might be that the low-differentiated PDAC contains higher fibrosis components than the middle-differentiated PDAC. The study of Watanabe et al [5] showed that the more tumor-associated fibrosis exist, the more invasive and malignant the tumor was.Conclusion
Native T1 mapping has a potential value for the differential diagnosis of PDAC, and the degree of differentiation is moderately positively correlated with the Native T1 value, which may serve as a noninvasive means of predicting the degree of pathologic differentiation of PDAC before surgery.Acknowledgements
No acknowledgement found.References
[1] Haaf P, Garg P, Messroghli DR, et al. Cardiac T1 mapping and extracellular volume (ECV) in clinical practice: a comprehensive review[J]. J Cardiovasc Magn Reson, 2016, 18(1): 89. DOI:10.1186/s12968-016-0308-4.[2] Shao XN, Jin YN, Sun YJ, et al .Evaluation of the correlation between myocardial fibrosis and ejection fraction in dilated cardiomyopathy using magnetic resonance T1 mapping.[J]Eur Rev Med Pharmacol Sci. 2020 Dec;24(23):12300-12305. doi: 10.26355/eurrev_202012_24022.[3] Liu C, Shi Y, Lan G,,et al.Evaluation of Pancreatic Fibrosis Grading by Multi Parametric Quantitative Magnetic Resonance Imaging.[j]J Magn Reson Imaging. 2021 Apr 5. doi: 10.1002/jmri.27626. Online ahead of print.[4] Mesropyan N, Kupczyk P, Dold L, et al .Non-invasive assessment of liver fibrosis in autoimmune hepatitis: Diagnostic value of liver magnetic resonance parametric mapping including extracellular volume fraction.[J]Abdom Radiol (NY). 2020 Oct 19. doi: 10.1007/s00261-020-02822-x. Online ahead of print.[5] Shao XN, Jin YN, Sun YJ, et al .Evaluation of the correlation between myocardial fibrosis and ejection fraction in dilated cardiomyopathy using magnetic resonance T1 mapping.[J]Eur Rev Med Pharmacol Sci. 2020 Dec;24(23):12300-12305. doi: 10.26355/eurrev_202012_24022.Figures