4808
Discrimination between Benign and Malignant Lung Lesions Using a Tri-Compartmental Restriction Spectrum Imaging Model1Department of Medical Imaging, Zhengzhou University People’s Hospital, Zhengzhou, China, 2Department of Medical Imaging, Henan Provincial People’s Hospital, Zhengzhou, China, 3Department of Medical Imaging, Xinxiang Medical University & Henan Provincial People's Hospital, Zhengzhou, China, 4Central Research Institute, United Imaging Healthcare Group, Shanghai, China, 5Beijing United Imaging Research Institute of Intelligent Imaging, United Imaging Healthcare Group, Beijing, China, 6Biomedical Research Institute, Henan Academy of Sciences, Zhengzhou, China
Synopsis
Keywords: Diffusion Modeling, Cancer, RSI; PET/MRI; Lung Lesion
Motivation: An accurate non-invasive detection method is required to identify benign and malignant lung lesions.
Goal(s): To assess the predictive value of the tri-compartmental RSI model in distinguishing between benign and malignant lung lesions.
Approach: In a prospective study, 137 suspected lung tumor patients who underwent PET/MRI scans were included.
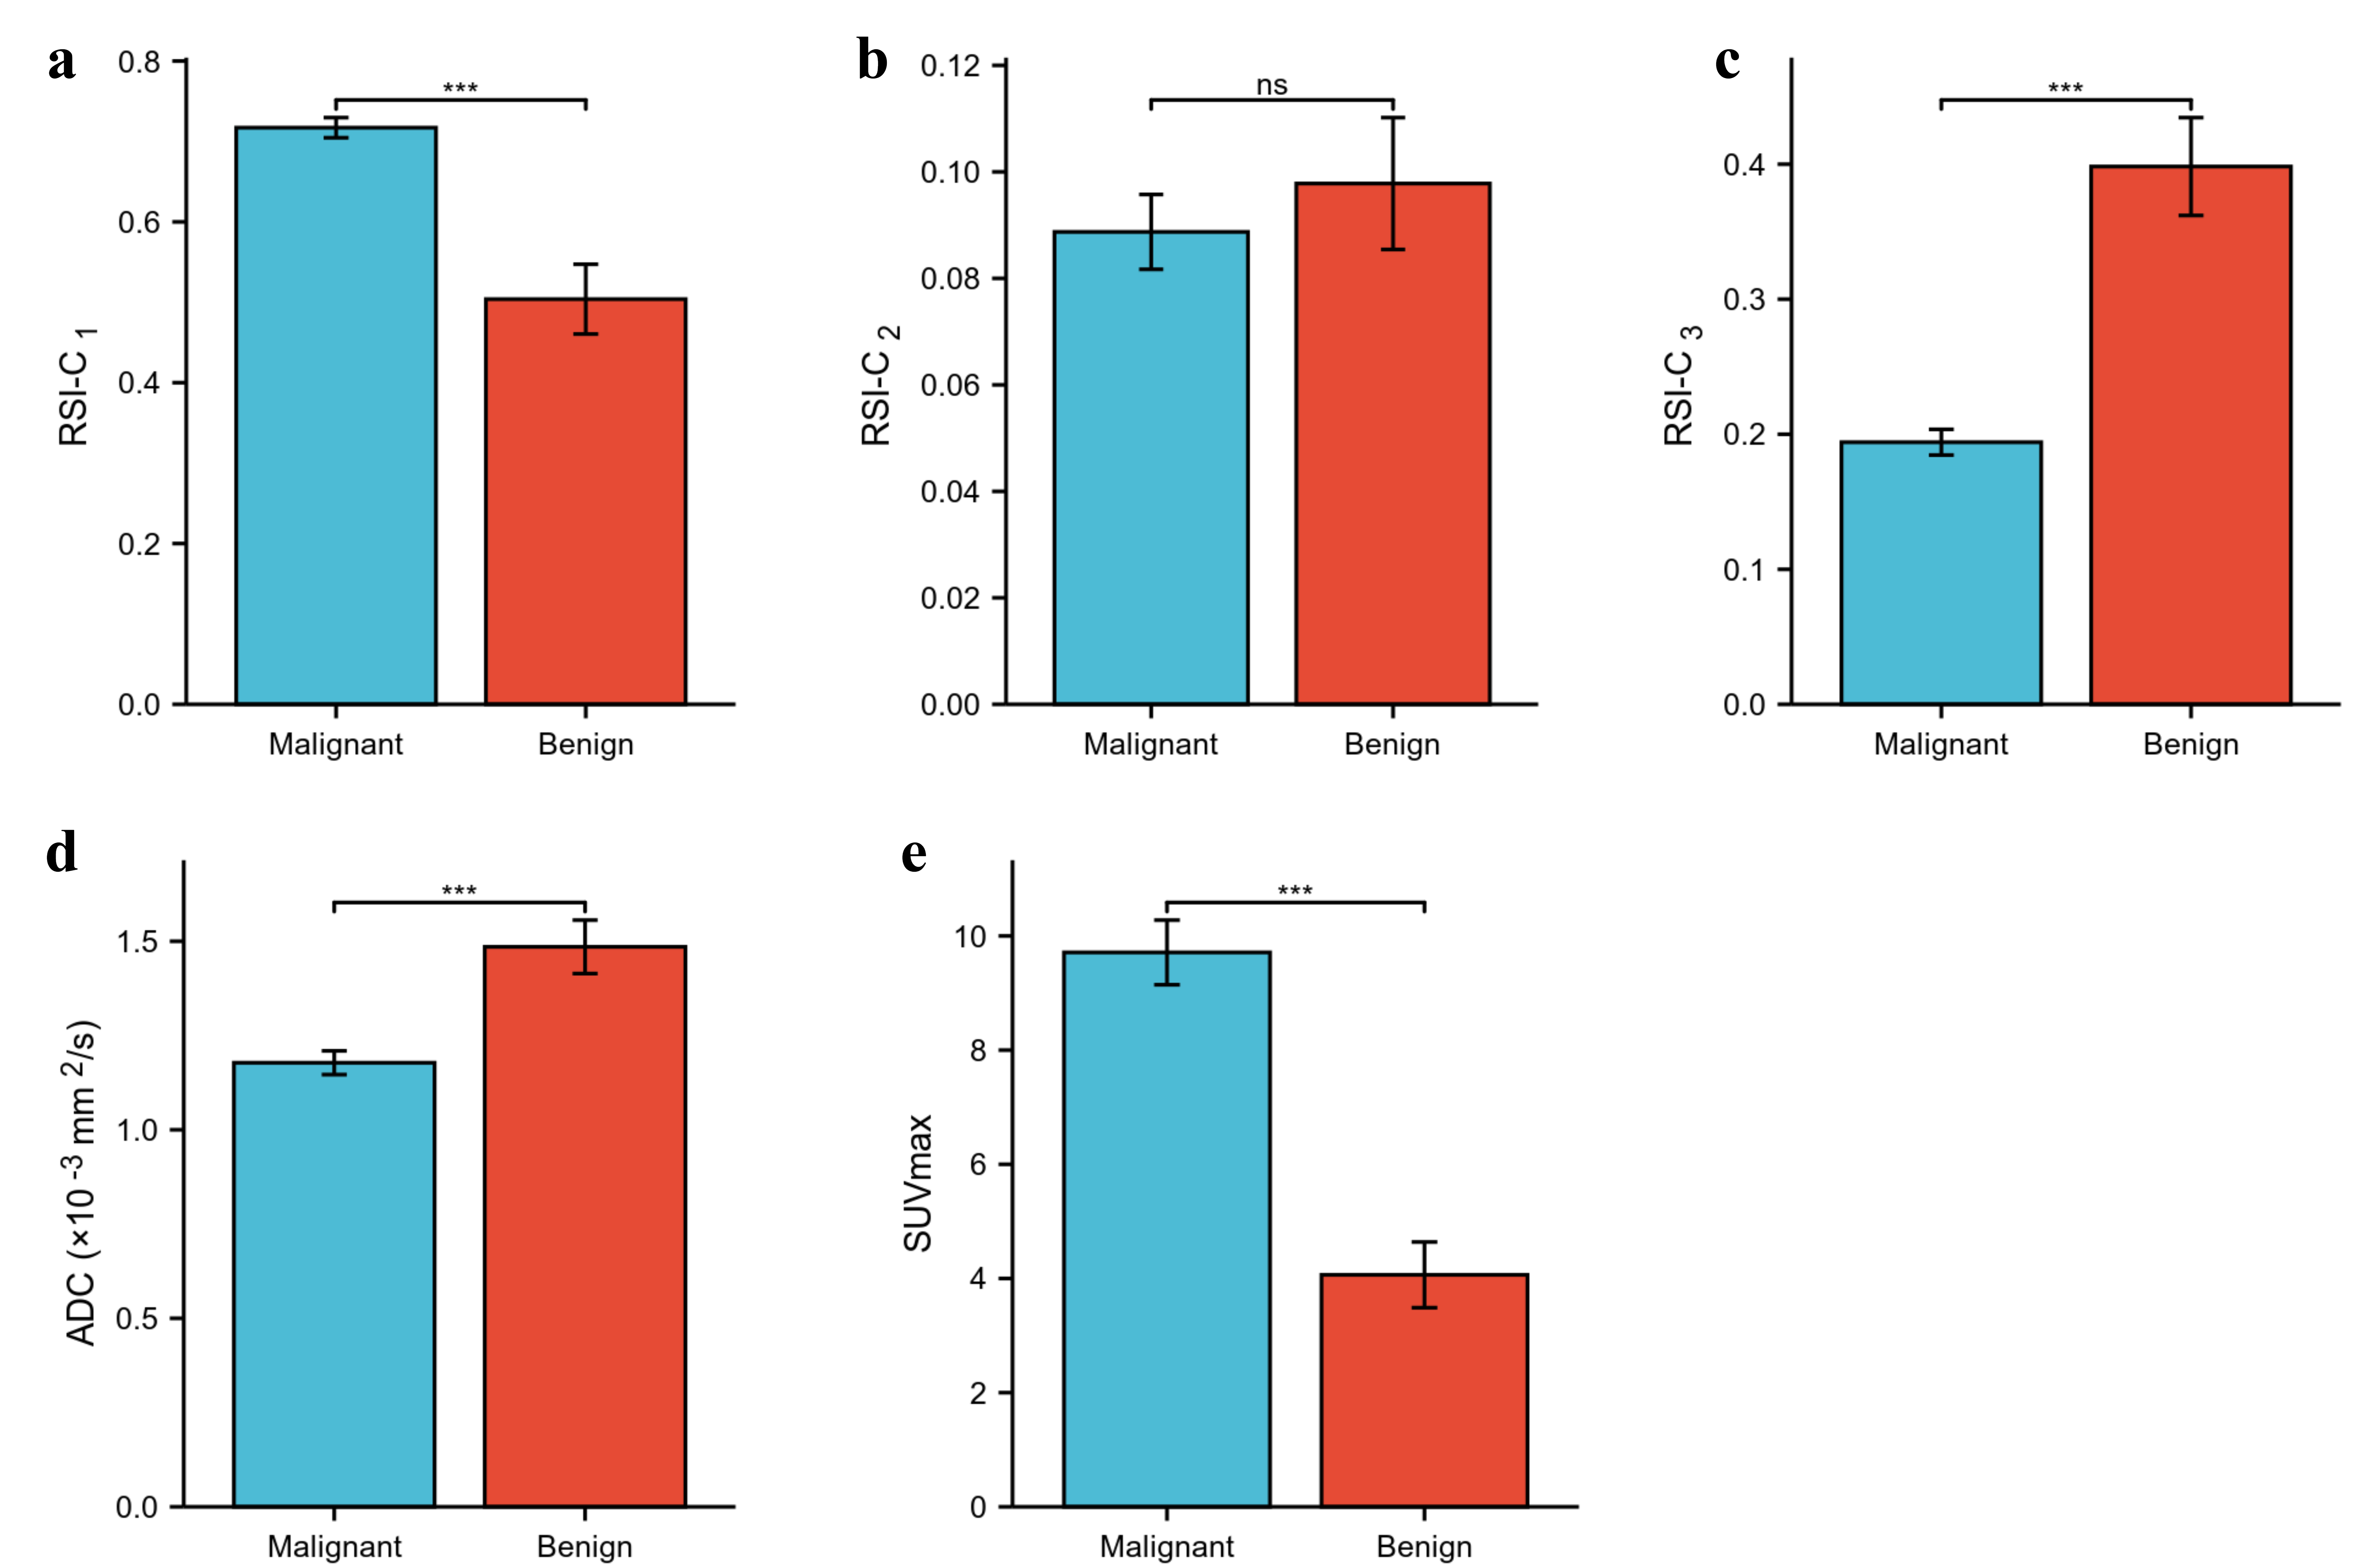
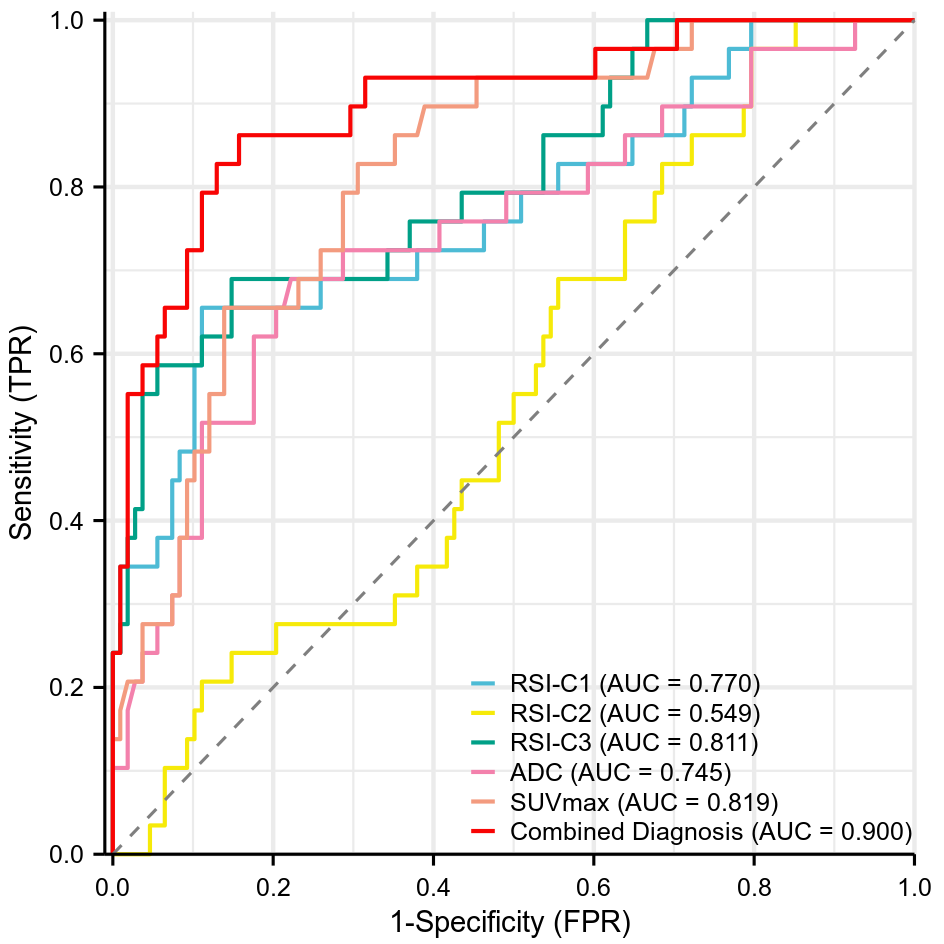
Results: Elevated RSI-C1, SUVmax, and lower ADC, RSI-C3 were observed in the malignant group compared with benign group (all P < 0.001). The AUCs, ranked from highest to lowest, were 0.819 (SUVmax) > 0.811 (RSI-C3) > 0.770 (RSI-C1) > 0.745 (ADC). The combined model of RSI-C1, RSI-C3, and SUVmax showed an AUC of 0.900.
Impact: Our study provides preliminary evidence of the potential of RSI-MRI technology to enhance non-invasive imaging of lung lesions. PET/MRI combined with metabolic parameter is helpful to optimize the clinical diagnosis of lung lesions.
Introduction
Restriction Spectrum Imaging (RSI) is a novel diffusion-weighted magnetic resonance imaging (MRI) technique[1] that models the diffusion-weighted MRI signal as several microstructural compartments, which are believed to correspond to restricted intracellular water, hindered extracellular water, and freely diffusing water, and thus can provide more direct measurements of tumor cells compared to traditional diffusion-weighted MRI. RSI has previously demonstrated the potential to differentiate cancerous tissues from non-cancerous tissues in the brain [2], prostate [3–5], and breast [6,7], but the value in the assessment of lung tumors has not been reported in any studies to date. Multi-parameter positron emission tomography/magnetic resonance imaging (PET/MRI), including 18F-FDG PET and multi-b-value diffusion-weighted imaging (DWI), can simultaneously provide multidimensional information reflecting cellular metabolism and water molecule diffusion.This study aims to investigate the discriminative diagnostic value of the tri-compartmental RSI model in distinguishing between benign and malignant lung lesions and to compare or integrate it with the traditional diffusion parameter ADC and metabolic parameter SUVmax, providing further assistance for non-invasive diagnosis of lung lesions.
Material and Methods
Prospectively enrolled 137 suspected pulmonary tumor patients undergoing PET/MRI, among whom 108 were confirmed as malignant lung tumors, and 29 were confirmed as benign lung lesions. PET and DWI (with multiple b-values) images were performed with specialized software in the advanced analysis toolkit of the UIH Workstation (uWS-MR: R005). Volumes of interest (VOIs) for lesions were manually drawn on DW images, the tri-compartmental RSI model is represented as a combination of multiple exponential decay functions [8]: S(b)=C1e-bD1 + C2e-bD2 + C3e-bD3, where S(b) represents the signal decay at each b-value, obtained by dividing the DWI image by the S0 image (b = 0). C1, C2, and C3 represent the volume fractions of the restricted diffusion, hindered diffusion, and free water diffusion compartments, respectively, while b denotes the b-value. D1, D2, and D3 represent the corresponding ADC values for the respective compartments. Based on theoretical values and ADC reference values [5], D1, D2, and D3 were determined and fixed at 1.0 × 10⁻³mm2/s, 2.0 × 10⁻³ mm2/s, and 3.0 × 10⁻³ mm2/s, respectively.SPSS 27.0 and R 4.2.1 were employed for statistical analyses. The Mann-Whitney U test or independent-sample t-test was utilized for data comparison. Diagnostic efficacy was described using the area under the receiver operating characteristic (ROC) curve (AUC), and differences were assessed using Delong test.
Results
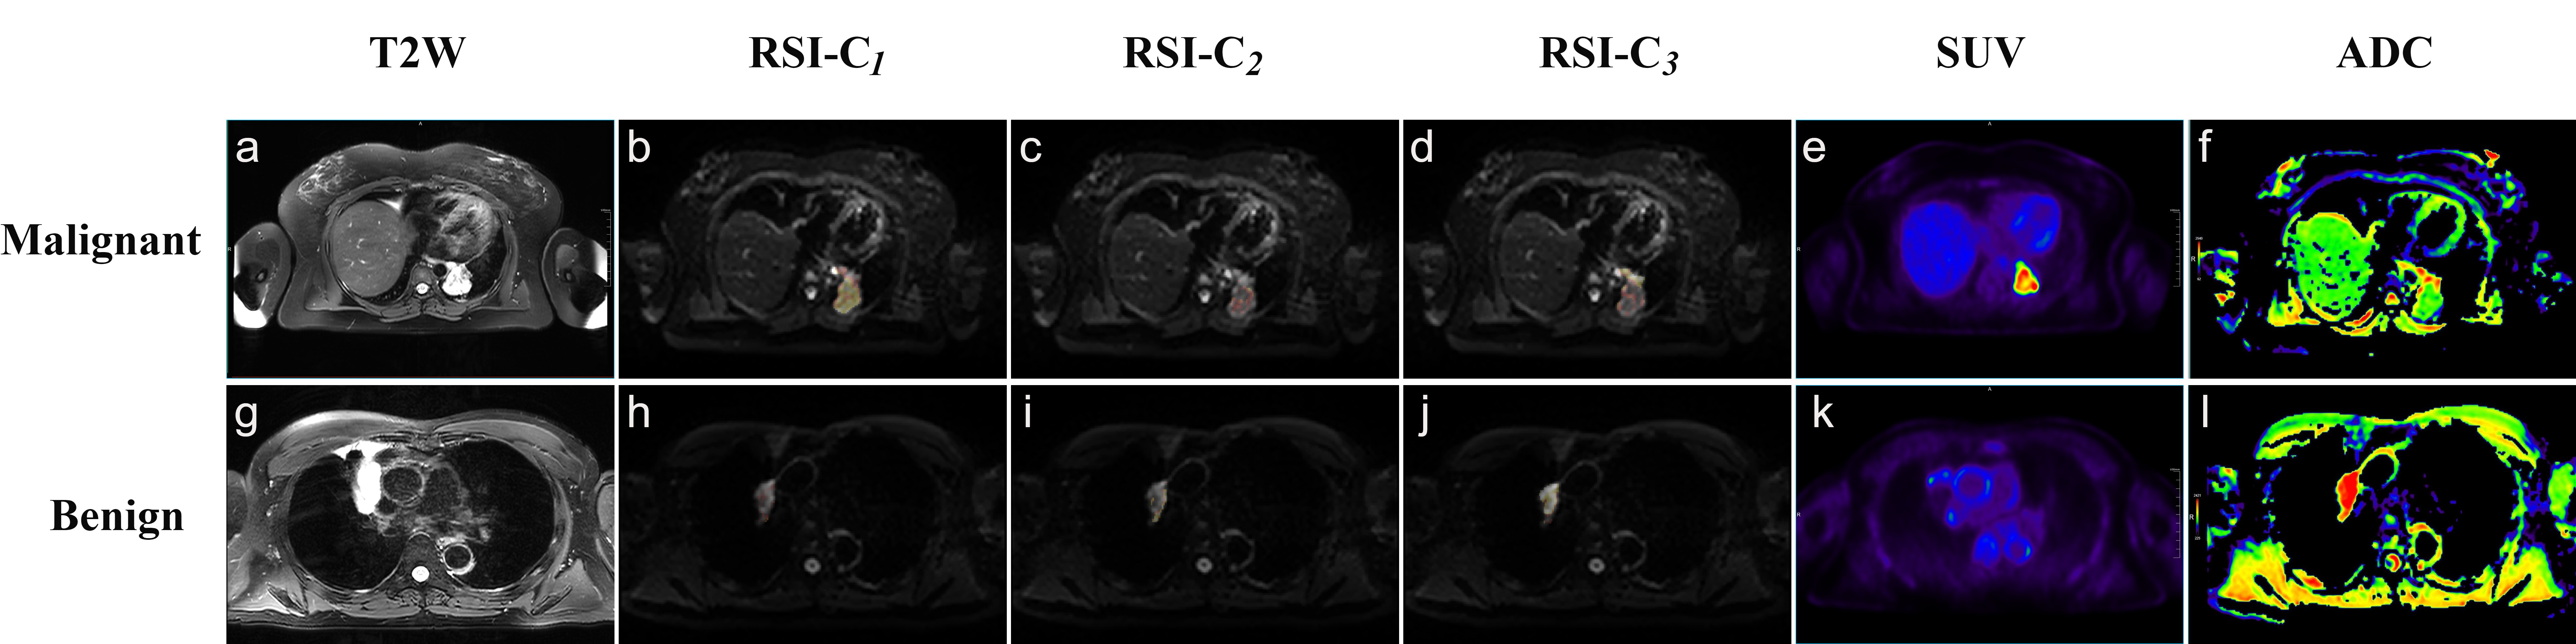
Visually, malignant and benign lesions exhibited different signal intensities on DW images (b=0) within compartment maps (Figure 1). Elevated RSI-C1, SUVmax and lower ADC, RSI-C3 were observed in the malignant group compared with benign group (all P < 0.001)(Figure 2). The AUCs of four parameters with significant differences in predicting pulmonary benign and malignant lesions, ranked from highest to lowest, were as follows: 0.819 (SUVmax) > 0.811 (RSI-C3) > 0.770 (RSI-C1) > 0.745 (ADC) (all P < 0.001). The combined model of RSI-C1, RSI-C3, and SUVmax showed an AUC of 0.900 (sensitivity was 86.2%, specificity was 84.3%) (Figure 3). The delong test revealed that the performance of the combined model was significantly superior to any individual model (all P < 0.01).Discussion
RSI-MRI technique separates spherical restricted water compartments from other compartments using multiple b-values, improving its significance in tumor detection compared to traditional DWI [1]. Malignant tumor tissue exhibited elevated RSI-C1, which may be attributed to the higher cell density, larger volume, and increased nuclear-to-cytoplasmic ratio, leading to hindered intracellular water diffusion. Additionally, we observed lower RSI-C3 in malignant tumor tissue, and this can be explained by two factors: first, an increase in cell density and intracellular volume fraction, which is accompanied by a decrease in extracellular/vascular volume fraction, supporting the model's internal consistency [9]; second, although tumor tissue has a rich microcirculation, abundant capillary blood flow is susceptible to compression and slowing, leading to reduced vascular perfusion [10]. In prior studies about RSI, such as in prostate [4], breast [6], and rectum [8], the primary focus had been on RSI-C1. Surprisingly, our research indicated that RSI-C3 also exhibited good diagnostic efficacy, suggesting that differences in D value selection and tumor cell heterogeneity may impact study results. SUVmax is the most commonly used semi-quantitative parameter reflecting tumor glucose metabolism, with higher SUVmax values indicating stronger proliferative capacity of tumor cells [11]. Our findings suggested that the combination of cellular metabolism and water molecule diffusion information in PET/MRI can help optimize diagnosis.Conclusion
Tri-compartmental restriction spectrum imaging model demonstrates the potential to enhance non-invasive imaging of lung lesions, and the combination of multiple parameters in PET/MRI contributes to the clinical optimization of diagnosing lung lesions.Acknowledgements
The National Key R&D Program of China (2017YFE0103600), the National Natural Science Foundation of China (82371934, 81720108021 and 31470047), the Joint Fund of Henan Province Science and Technology R&D Program (225200810062), the Zhongyuan Thousand Talents Plan Project - Basic Research Leader Talent (ZYQR201810117), the Zhengzhou Collaborative Innovation Major Project (20XTZX05015), the Key Project of Henan Province Medical Science and Technology Project (LHGJ20190602), and the Henan provincial science and technology research projects (212102310689).References
[1] White N S, McDonald C, Farid N, et al. Diffusion-weighted imaging in cancer: physical foundations and applications of restriction spectrum imaging [J/OL]. Cancer Research, 2014, 74(17): 4638-4652.
[2] White N S, McDonald C R, Farid N, et al. Improved conspicuity and delineation of high-grade primary and metastatic brain tumors using “restriction spectrum imaging”: quantitative comparison with high B-value DWI and ADC [J/OL]. AJNR. American journal of neuroradiology, 2013, 34(5): 958-964, S1.
[3] Besasie B D, Sunnapwar A G, Gao F, et al. Restriction Spectrum Imaging-Magnetic Resonance Imaging to Improve Prostate Cancer Imaging in Men on Active Surveillance [J/OL]. The Journal of Urology, 2021, 206(1): 44-51.
[4] McCammack K C, Kane C J, Parsons J K, et al. In vivo prostate cancer detection and grading using restriction spectrum imaging-MRI [J/OL]. Prostate Cancer and Prostatic Diseases, 2016, 19(2): 168-173.
[5] Conlin C C, Feng C H, Rodriguez-Soto A E, et al. Improved Characterization of Diffusion in Normal and Cancerous Prostate Tissue Through Optimization of Multicompartmental Signal Models [J/OL]. Journal of magnetic resonance imaging: JMRI, 2021, 53(2): 628-639.
[6] Besser A H, Fang L K, Tong M W, et al. Tri-Compartmental Restriction Spectrum Imaging Breast Model Distinguishes Malignant Lesions from Benign Lesions and Healthy Tissue on Diffusion-Weighted Imaging [J/OL]. Cancers, 2022, 14(13): 3200.
[7] Rodríguez-Soto A E, Andreassen M M S, Fang L K, et al. Characterization of the diffusion signal of breast tissues using multi-exponential models [J/OL]. Magnetic Resonance in Medicine, 2022, 87(4): 1938-1951.
[8] Xiong Z, Geng Z, Lian S, et al. Discriminating rectal cancer grades using restriction spectrum imaging [J/OL]. Abdominal Radiology, 2022, 47(6): 2014-2022.
[9] Zaccagna F, Riemer F, Priest A N, et al. Non-invasive assessment of glioma microstructure using VERDICT MRI: correlation with histology [J/OL]. European Radiology, 2019, 29(10): 5559-5566.
[10] Liu C, Wang K, Chan Q, et al. Intravoxel incoherent motion MR imaging for breast lesions: comparison and correlation with pharmacokinetic evaluation from dynamic contrast-enhanced MR imaging [J/OL]. European Radiology, 2016, 26(11): 3888-3898.
[11] Sun X Y, Chen T X, Chang C, et al. SUVmax of 18FDG PET/CT Predicts Histological Grade of Lung Adenocarcinoma [J/OL]. Academic Radiology, 2021, 28(1): 49-57.
Figures