4805
Cross Mood and Anxiety Disorders Connectome Landscape of Dysconnectivity1Icahn School of Medicine at Mount Sinai, New York, NY, United States
Synopsis
Keywords: Psychiatric Disorders, Brain Connectivity
Motivation: Mood and anxiety disorders have high comorbidity and overlapping symptoms which makes diagnosis and treatment challenging. Identification of shared network mechanisms that underlie these disorders is needed. However, most networks are studied in only one disorder at a time.
Goal(s): We aim to explore how brain network features reveal differences as well as commonalities across mood and anxiety disorders.
Approach: Here we conducted a trans-diagnostic approach motivated by a recent theory of cross-disorder ‘connectome landscape’ which delineates optimal and suboptimal network organization.
Results: We empirically tested this novel concept for the first time, observing connectome landscape perturbations in anxiety and PTSD patients.
Impact: Identification of distinct or shared network mechanisms that underlie mood and anxiety disorders is greatly needed. Empirically testing the connectome landscape theory, we uncover unique network organization related to depression or anxiety, indicating that anxiety manifests as more global dysconnectivity.
INTRODUCTION
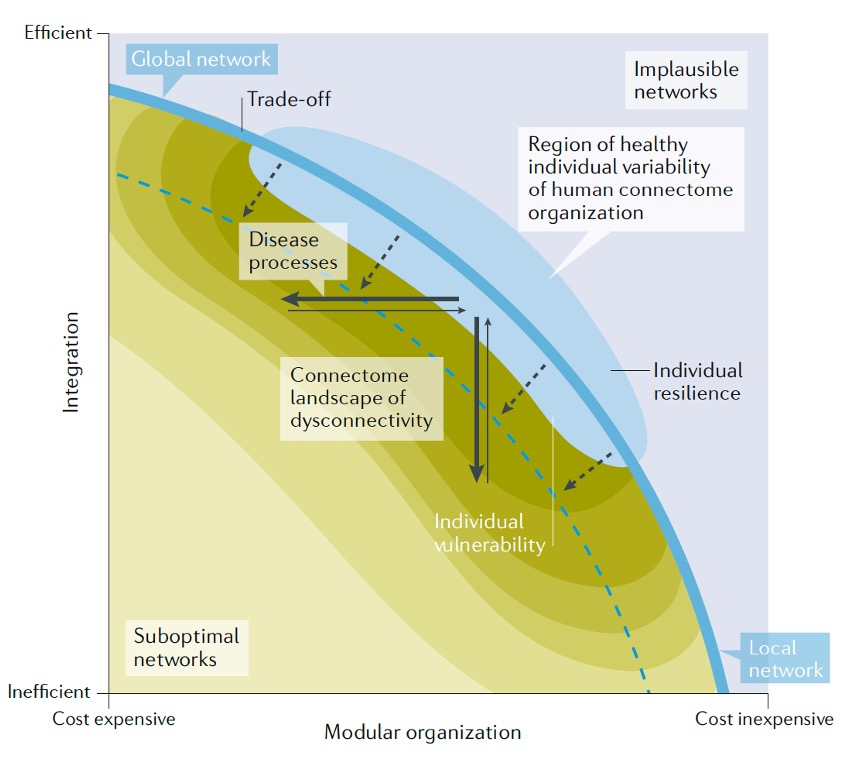
Mood and anxiety disorders such as major depressive disorder (MDD), general anxiety disorders (Anx) and post-traumatic stress disorder (PTSD) are associated with significant day-to-day life issues, disability and heavy social and economic burden1. Comorbidity and overlapping symptoms associated with depression and anxiety makes diagnosis, research, and treatment challenging2, especially given that current diagnosis entirely depends on clinical symptoms, whereas the underlying brain pathology remains largely unclear. Accumulating evidence from the last decade suggests that complex etiology of psychiatric disorders are not localized to single brain regions, but rather are manifested as aberrant communication between and within large-scale functional networks3-5. It is critical to examine the neural network as a whole. This ‘network perspective’ may explain the high comorbidity but heterogeneity of mood and anxiety disorders and could explain varying treatment efficacy6. The mathematical field of graph theory offers a flexible way to model whole-brain connectivity, known as the connectome7-9. Connectome features have been previously shown to distinguish between healthy individuals and psychiatric patients7-9. Common disturbances to key network organization features (e.g. network ‘modularity’ and ‘integration’) are found in a wide range of brain disorders, potentially indicating shared mechanisms among seemingly disparate disorders10. This theory is known as the ‘connectome landscape of dysconnectivity’10, which includes these principal dimensions of network organization, allowing for a common shared framework (Fig. 1). They suggest a two-dimensional coordinate system framed by the principal network features of ‘modularity’ and ‘integration’. Within this framework, optimal brain connectome organization is achieved when there is a balance between whole-brain connectivity and local circuitry (i.e., modular organization), where efficient global communication is optimized. Disease processes are theorized to shift a connectome away from this optimal balance. However, this has not been empirically demonstrated as most studies investigate network features in just one psychiatric disorder.METHODS
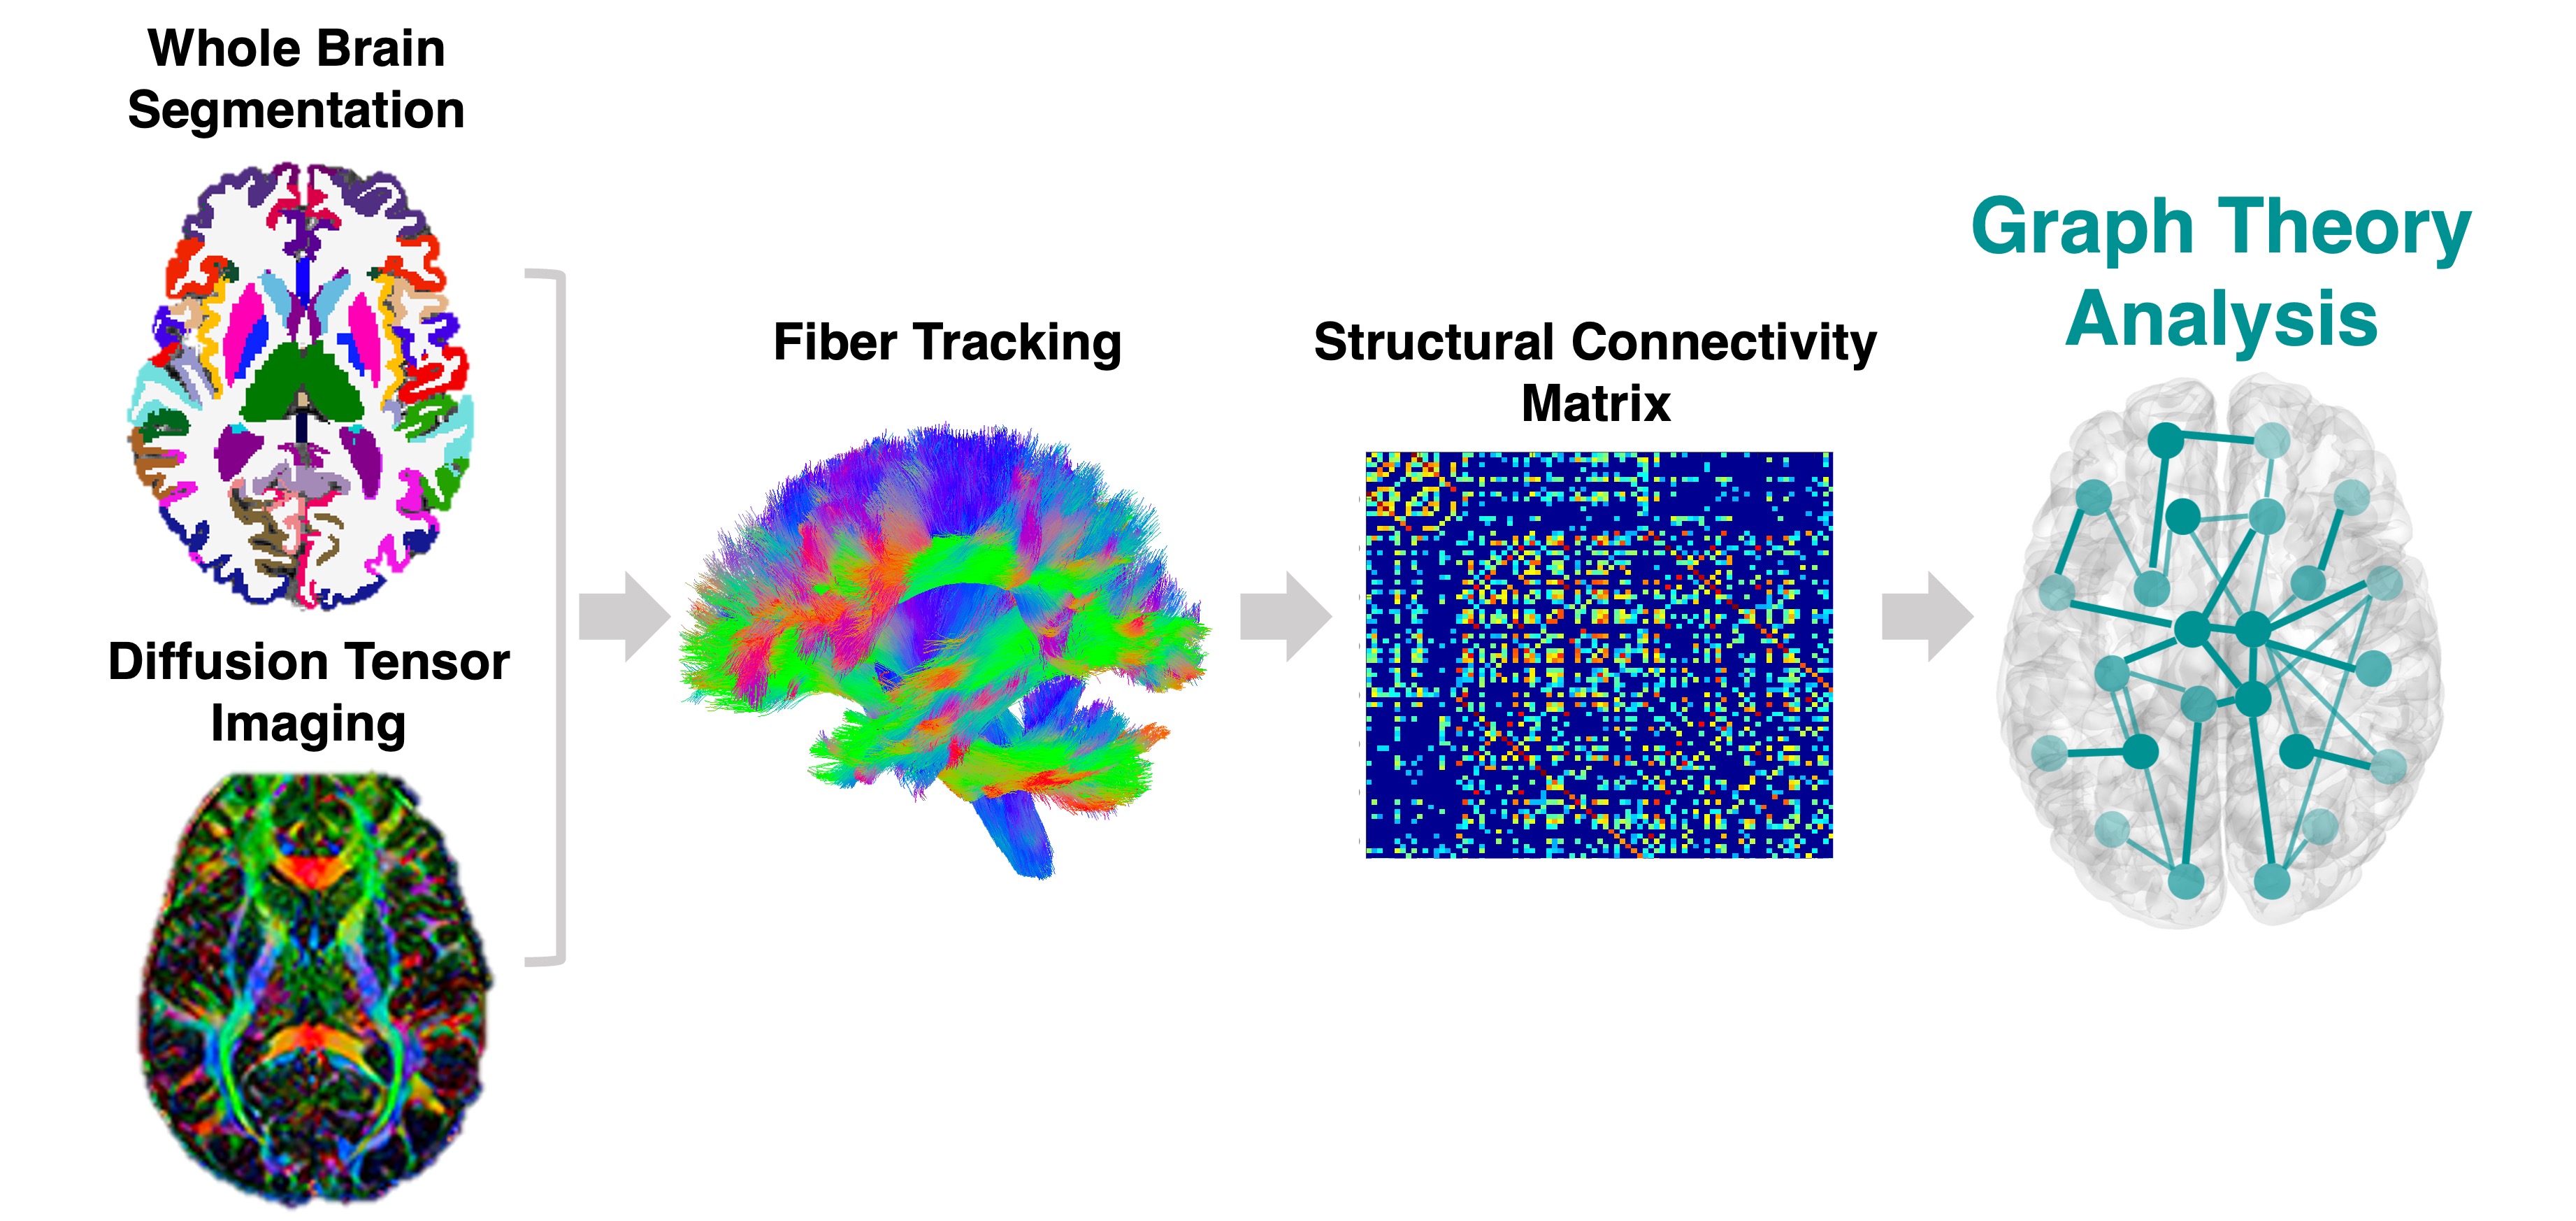
Data were acquired on a Siemens Magnetom 7T MRI scanner (Erlangen, Germany). All subjects (HC=36, MDD=20, Anx=18, and PTSD=11) underwent anatomical T1-weighted and diffusion-weighted imaging (DWI). Diffusion images were preprocessed using MRtrix3. The connectomic procedure is illustrated in Fig 2. Each subject’s anatomical T1-weighted image was segmented into Desikan-Killiany Atlas11 using FreeSurfer v.6.0 and co-registered into the DWI space to construct the structural connectome. Each of the segmented 84 regions of interest (ROIs) represents a node in the graph. The structural connectome edges (links) are defined by the streamline count between any pairwise ROIs derived from diffusion probabilistic tractography. To enable comparison across subjects, we used a sparsity threshold S, which retains S% of the top connections for each subject12. Using the Brain Connectivity Toolbox13, for each subject, we will calculate: 1) modularity, which is defined by the number of edges that fall within the clusters in the network minus the expected number if edges were distributed at random14; and 2) global efficiency, which is defined by the average inverse shortest path length (minimum number of edges that must be traversed to go from one node to another) in the network15. We then assessed the normal distribution within the connectome landscape by applying curve fitting analysis on all HC. Then the goodness of fit from the fitted curve was determined for each group by its summed square of residuals (deviations predicted from actual empirical values) and root mean square error (RMSE). We also calculated the global efficiency to modularity ratio. We then used linear models to compare each patient group residuals and ratios to the HC distribution while controlling for age and gender.RESULTS
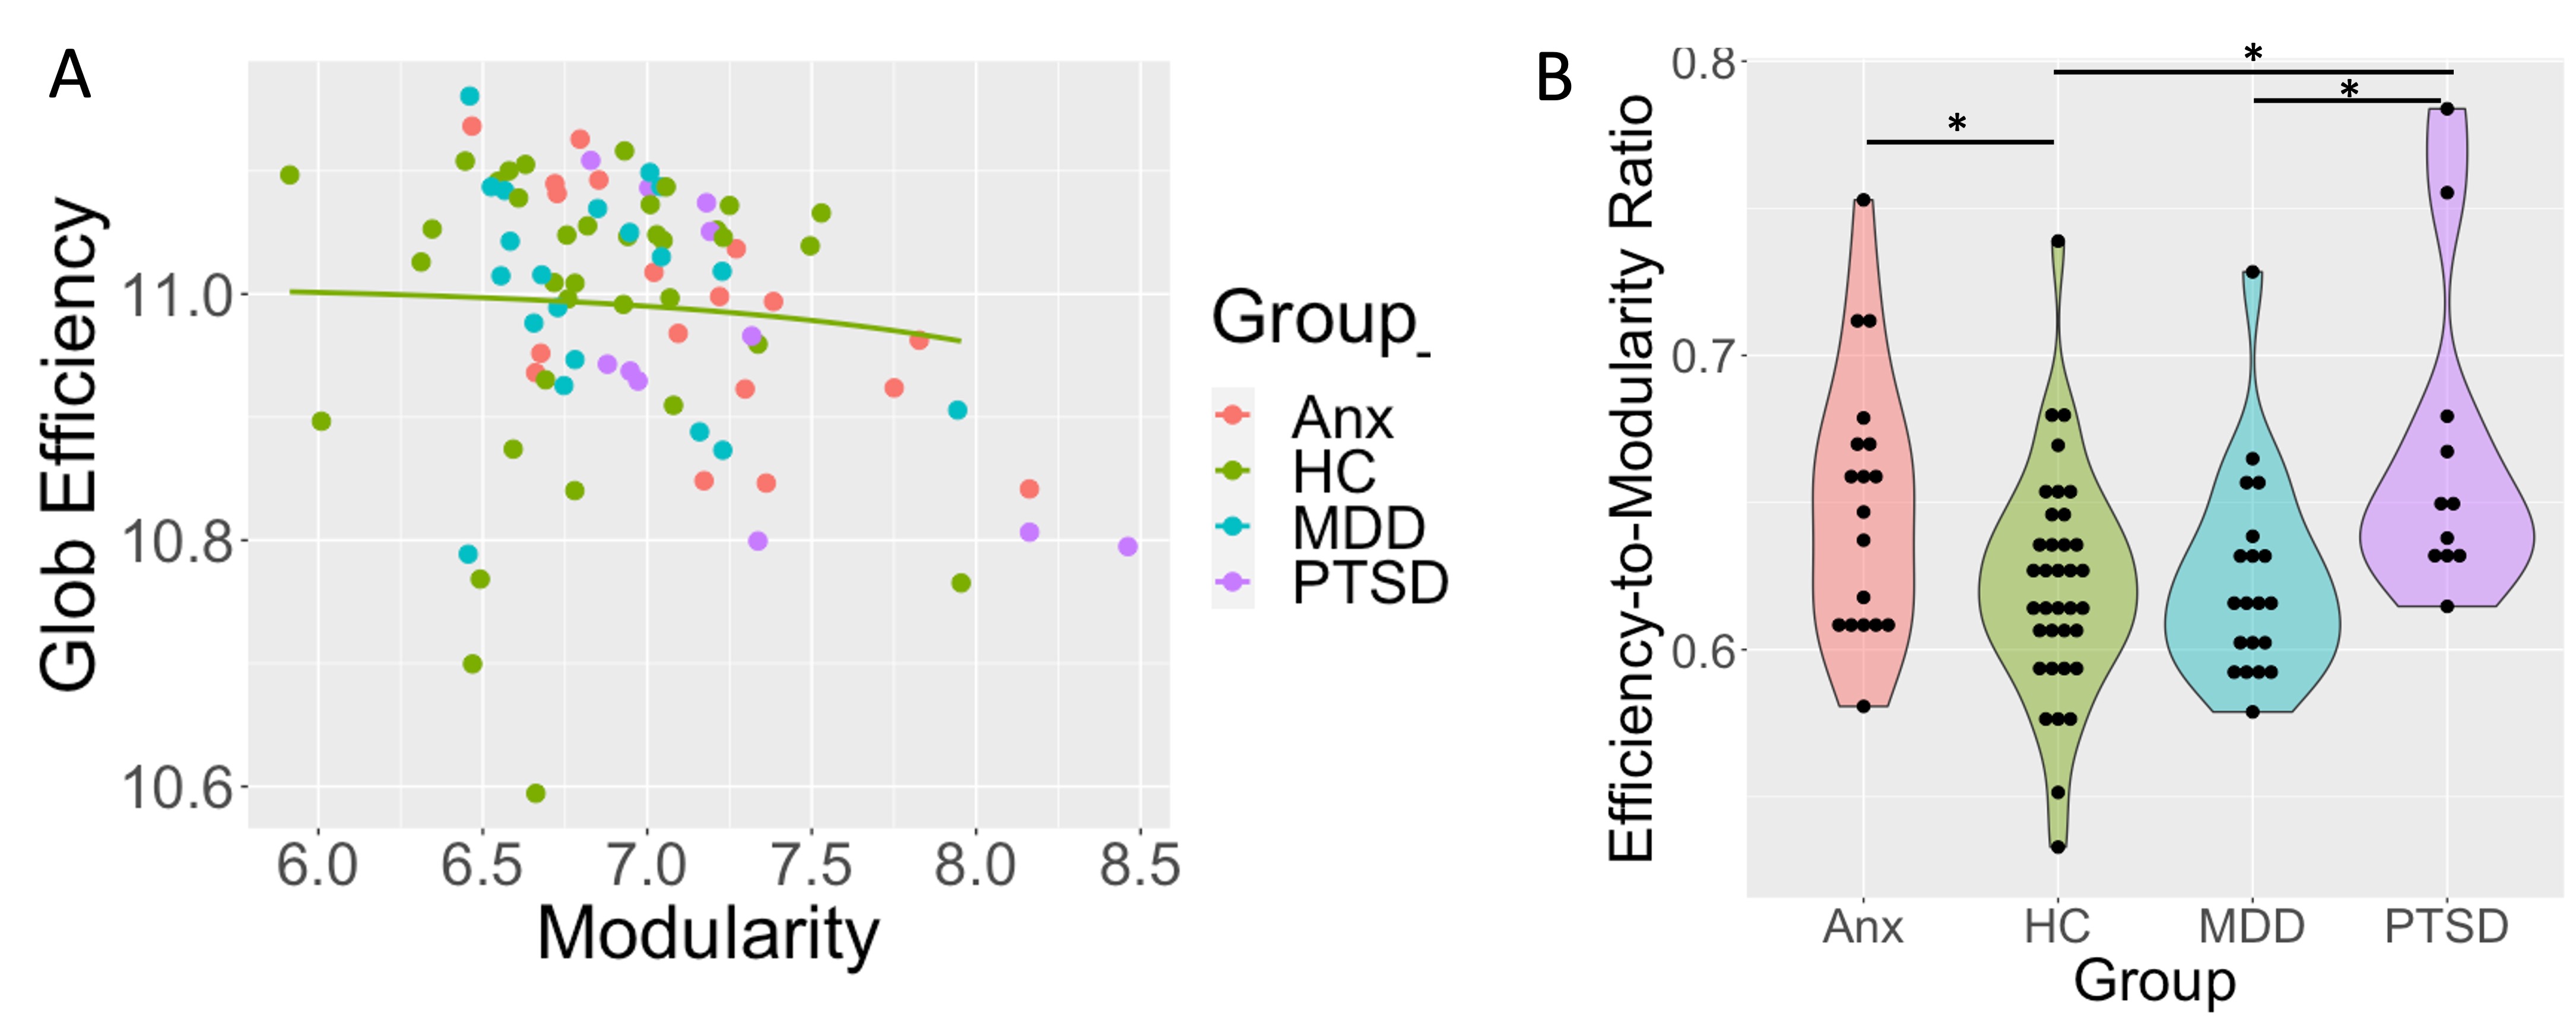
The optimal HC balance was estimated with a fitting curve (power 2) (Fig.3A). The goodness of fit to the curve of Anx (SSE=0.41, RMSE = 0.15), and PTSD (SSE=6.51, RMSE = 0.77), showed higher values indicating poorer goodness of fit compared to MDD, which showed better goodness of fit (SSE=0.18, RMSE = 0.094) to the normal distribution. In addition, the efficiency-to-modularity ratios of the Anx and PTSD groups were found to be significantly higher than HC (t=2.27, p=0.028 and t=2.93, p=0.0054, respectively) (Fig.3B), controlled for age and gender. The PTSD group efficiency-to-modularity ratio was also significantly higher than MDD (t=2.16, p=0.041) (Fig.3B), controlled for age and gender.CONCLUSIONS
Our results show that MDD patients exhibit the same balance between efficiency and modularity as HC. However, individuals with Anxiety and PTSD demonstrate a tip in the balance, towards higher network efficiency and lower modular organization (Fig. 3). These results demonstrate the ability of the connectome landscape framework to uncover unique network organization features related to depression or anxiety, indicating that anxiety manifests as more global brain dysconnectivity, whereas MDD exhibit subtle sub-system specific variations.Acknowledgements
This work has been funded by K01MH131855 (Jacob), K01MH120433 (Morris), R01MH116953 (Murrough, Balchandani).
References
1 Kessler, R. C., Chiu, W. T., Demler, O., Merikangas, K. R. & Walters, E. E. Prevalence, severity, and comorbidity of 12-month DSM-IV disorders in the National Comorbidity Survey Replication. Arch Gen Psychiatry 62, 617-627, doi:10.1001/archpsyc.62.6.617 (2005).
2. Gorman, J. M. Comorbid depression and anxiety spectrum disorders. Depression and Anxiety 4, 160-168, doi:10.1002/(sici)1520-6394(1996)4:4<160::Aid-da2>3.0.Co;2-j (1996).
3. Etkin, A., Büchel, C. & Gross, J. J. The neural bases of emotion regulation. Nat Rev Neurosci 16, 693-700, doi:10.1038/nrn4044 (2015).
4 Menon, V. Large-scale brain networks and psychopathology: a unifying triple network model. Trends in cognitive sciences 15, 483-506 (2011).
5 Sylvester, C. et al. Functional network dysfunction in anxiety and anxiety disorders. Trends Neurosci 35, 527-535 (2012).
6 Song, Z., Zhang, M. & Huang, P. Aberrant emotion networks in early major depressive disorder patients: an eigenvector centrality mapping study. Translational Psychiatry 6, e819-e819, doi:10.1038/tp.2016.81 (2016).
7 Bullmore, E. & Sporns, O. Complex brain networks: graph theoretical analysis of structural and functional systems. Nature Reviews Neuroscience 10, 186-198 (2009).
8 Sporns, O. Networks of the Brain. (MIT press, 2011).
9 Bassett, D. S. et al. Hierarchical organization of human cortical networks in health and schizophrenia. J Neurosci 28, 9239-9248, (2008).
10 van den Heuvel, M. P. & Sporns, O. A cross-disorder connectome landscape of brain dysconnectivity. Nature Reviews Neuroscience 20, 435-446, doi:10.1038/s41583-019-0177-6 (2019).
11 Desikan, R. S. et al. An automated labeling system for subdividing the human cerebral cortex on MRI scans into gyral based regions of interest. Neuroimage 31, 968-980, doi:10.1016/j.neuroimage.2006.01.021 (2006).
12 Jacob, Y. et al. Neural correlates of rumination in major depressive disorder: A brain network analysis. NeuroImage: Clinical 25, 102142, doi:https://doi.org/10.1016/j.nicl.2019.102142 (2020).
13 Rubinov, M. & Sporns, O. Complex network measures of brain connectivity: uses and interpretations. Neuroimage 52, 1059-1069, doi:10.1016/j.neuroimage.2009.10.003 (2010).
14 Newman, M. E. Fast algorithm for detecting community structure in networks. Physical review E 69, 066133 (2004).
15 Latora, V. & Marchiori, M. Efficient behavior of small-world networks. Physical review letters 87, 198701 (2001).
Figures