4803
Utilizing the human connectome project to quantify gray matter microstructural decline and cognitive correlates in healthy aging using MAP-MRI1Multiscale Imaging and Integrative Biophysics Unit, National Institute on Aging, NIH, Baltimore,MD USA 21224, Baltimore, MD, United States, 2Vanderbilt Institute of Imaging Science, Vanderbilt University Medical Center, Nashville, TN, United States, Nashville, TN, United States, 3Brain Aging and Behavior Section, National Institute on Aging, NIH, Baltimore,MD USA 21224, Baltimore, MD, United States
Synopsis
Keywords: Aging, Aging, Mean Apparent Propagator MRI
Motivation: The mean apparent propagator (MAP)-MRI model, free from biophysical assumptions, shows high sensitivity to gray matter (GM) microstructural changes. Yet, its capacity to predict age-related cognitive and behavioral changes is uncharted.
Goal(s): To profile MAP-MRI based microstructural/volumetric changes in normal aging and its cognitive correlates.
Approach: Utilizing the HCP-Aging diffusion and cognitive datasets from 707 unimpaired participants, we investigated age associations in 56 GM regions and their cognitive correlates.
Results: MAP-MRI identified unique age-related patterns in GM regions, linked to memory and executive function decline, limbic network stability; suggesting potential for MAP-MRI in predicting age-related cognitive, behavioral, and microstructural changes.
Impact: MAP-MRI identified unique age-related patterns in GM regions, linked to memory and executive function decline, limbic network stability; suggesting potential for MAP-MRI in predicting age-related cognitive, behavioral, and microstructural changes.
Introduction
Volumetric and diffusion imaging (dMRI) studies link aging and cognitive function changes1,2, however they are mostly focused on white-matter due to reduced sensitivity in assessing gray matter (GM) complex microstructure. The mean apparent propagator (MAP)-MRI model avoids biophysical assumptions, and offers high sensitivity to age-related GM microstructural changes3 as demonstrated in healthy and aging populations3,4, stroke5, epilepsy6, and Parkinson's disease7, yet its potential for predicting cognitive and behavioral changes associated with aging in GM remains unexplored.Purpose
Utilizing the Human Connectome Project-Aging (HCP-A) data, this study aims to characterize micro- and macrostructural GM changes in normal aging, focusing on predicting age-related cognitive and behavioral changes.Materials and Methods
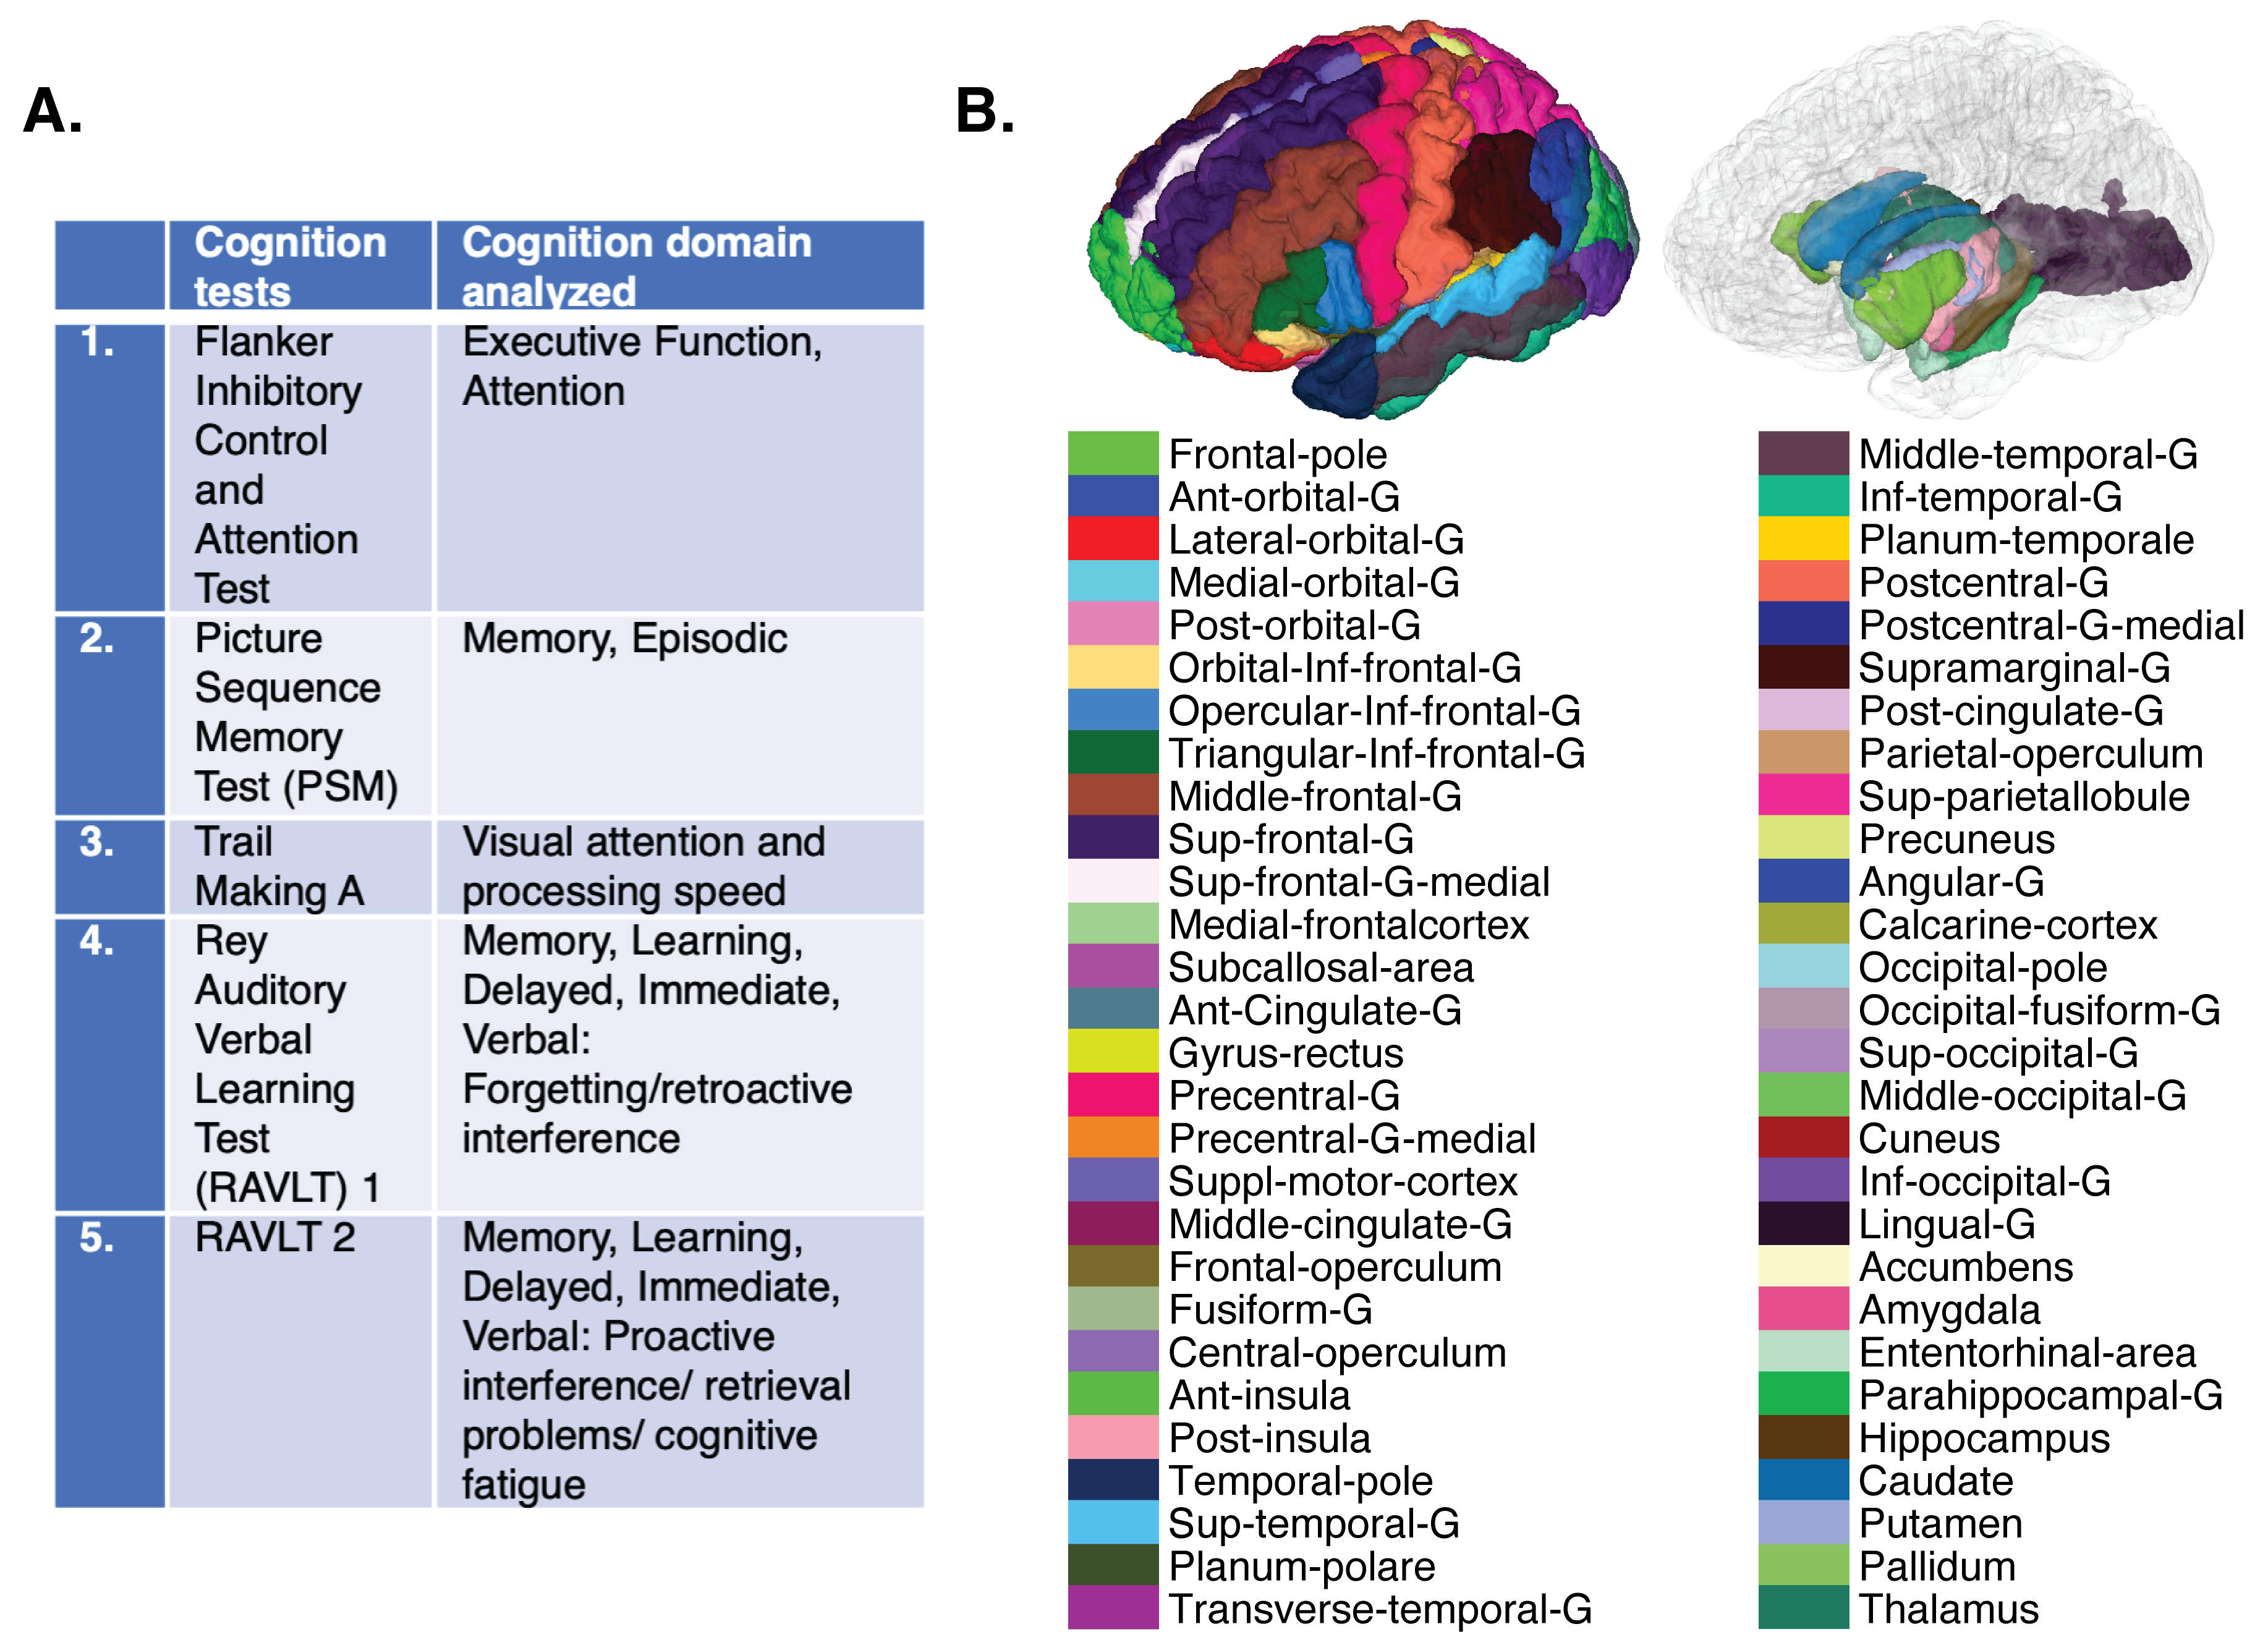
Participants and data acquisition: 394 females (59.1±14.7 years) and 313 males (60.4±15.1 years were included for final analysis, without any significant age difference between gender (p=0.258). Data from HCP-A acquired at 4 sites using 3T Siemens scanner with a 32-channel head coil was used. Diffusion-weighted images (DWIs) were acquired at 1.5mm isotropic voxel size, TR/TE=3230/89.5ms, 28 b0 images interleaved with b-values=1500 and 3000s/mm2 (98-99 directions per shell) in both AP-PA phase encoding directions8. Behavioral and cognitive assessments were done using NIH toolbox (Figure 1A).Data processing: DWIs underwent manual quality check during each preprocessing steps which involved denoising (MPPCA technique ), Gibbs ringing correction9, motion and eddy current distortion correction (TORTOISE’s DIFFPREP module10), and susceptibility distortion correction (DRBUDDI11).
MAP-MRI parameters estimation and brain segmentation: Using these preprocessed DWIs, we estimated the voxel-wise diffusion propagators using a MAP-MRI series expansion truncated at order 412 and derived propagator anisotropy (PA), non-Gaussianiaty (NG), return to the origin probability (RTOP), return to the axis probability (RTAP), and return to the plane probability (RTPP) metrices, quantifying various aspects of the diffusion process. RTAP1/2 and RTOP1/3 values are reported for consistency. The SLANT method was used to generate 56 brain labels (Figure 1B)13, which were used to obtain ROI volume, after adjusting for intracranial volume. Labels were eroded to reduce partial volume effects and structural atrophy. Mean values of MR metrices were calculated for each ROI and participant.
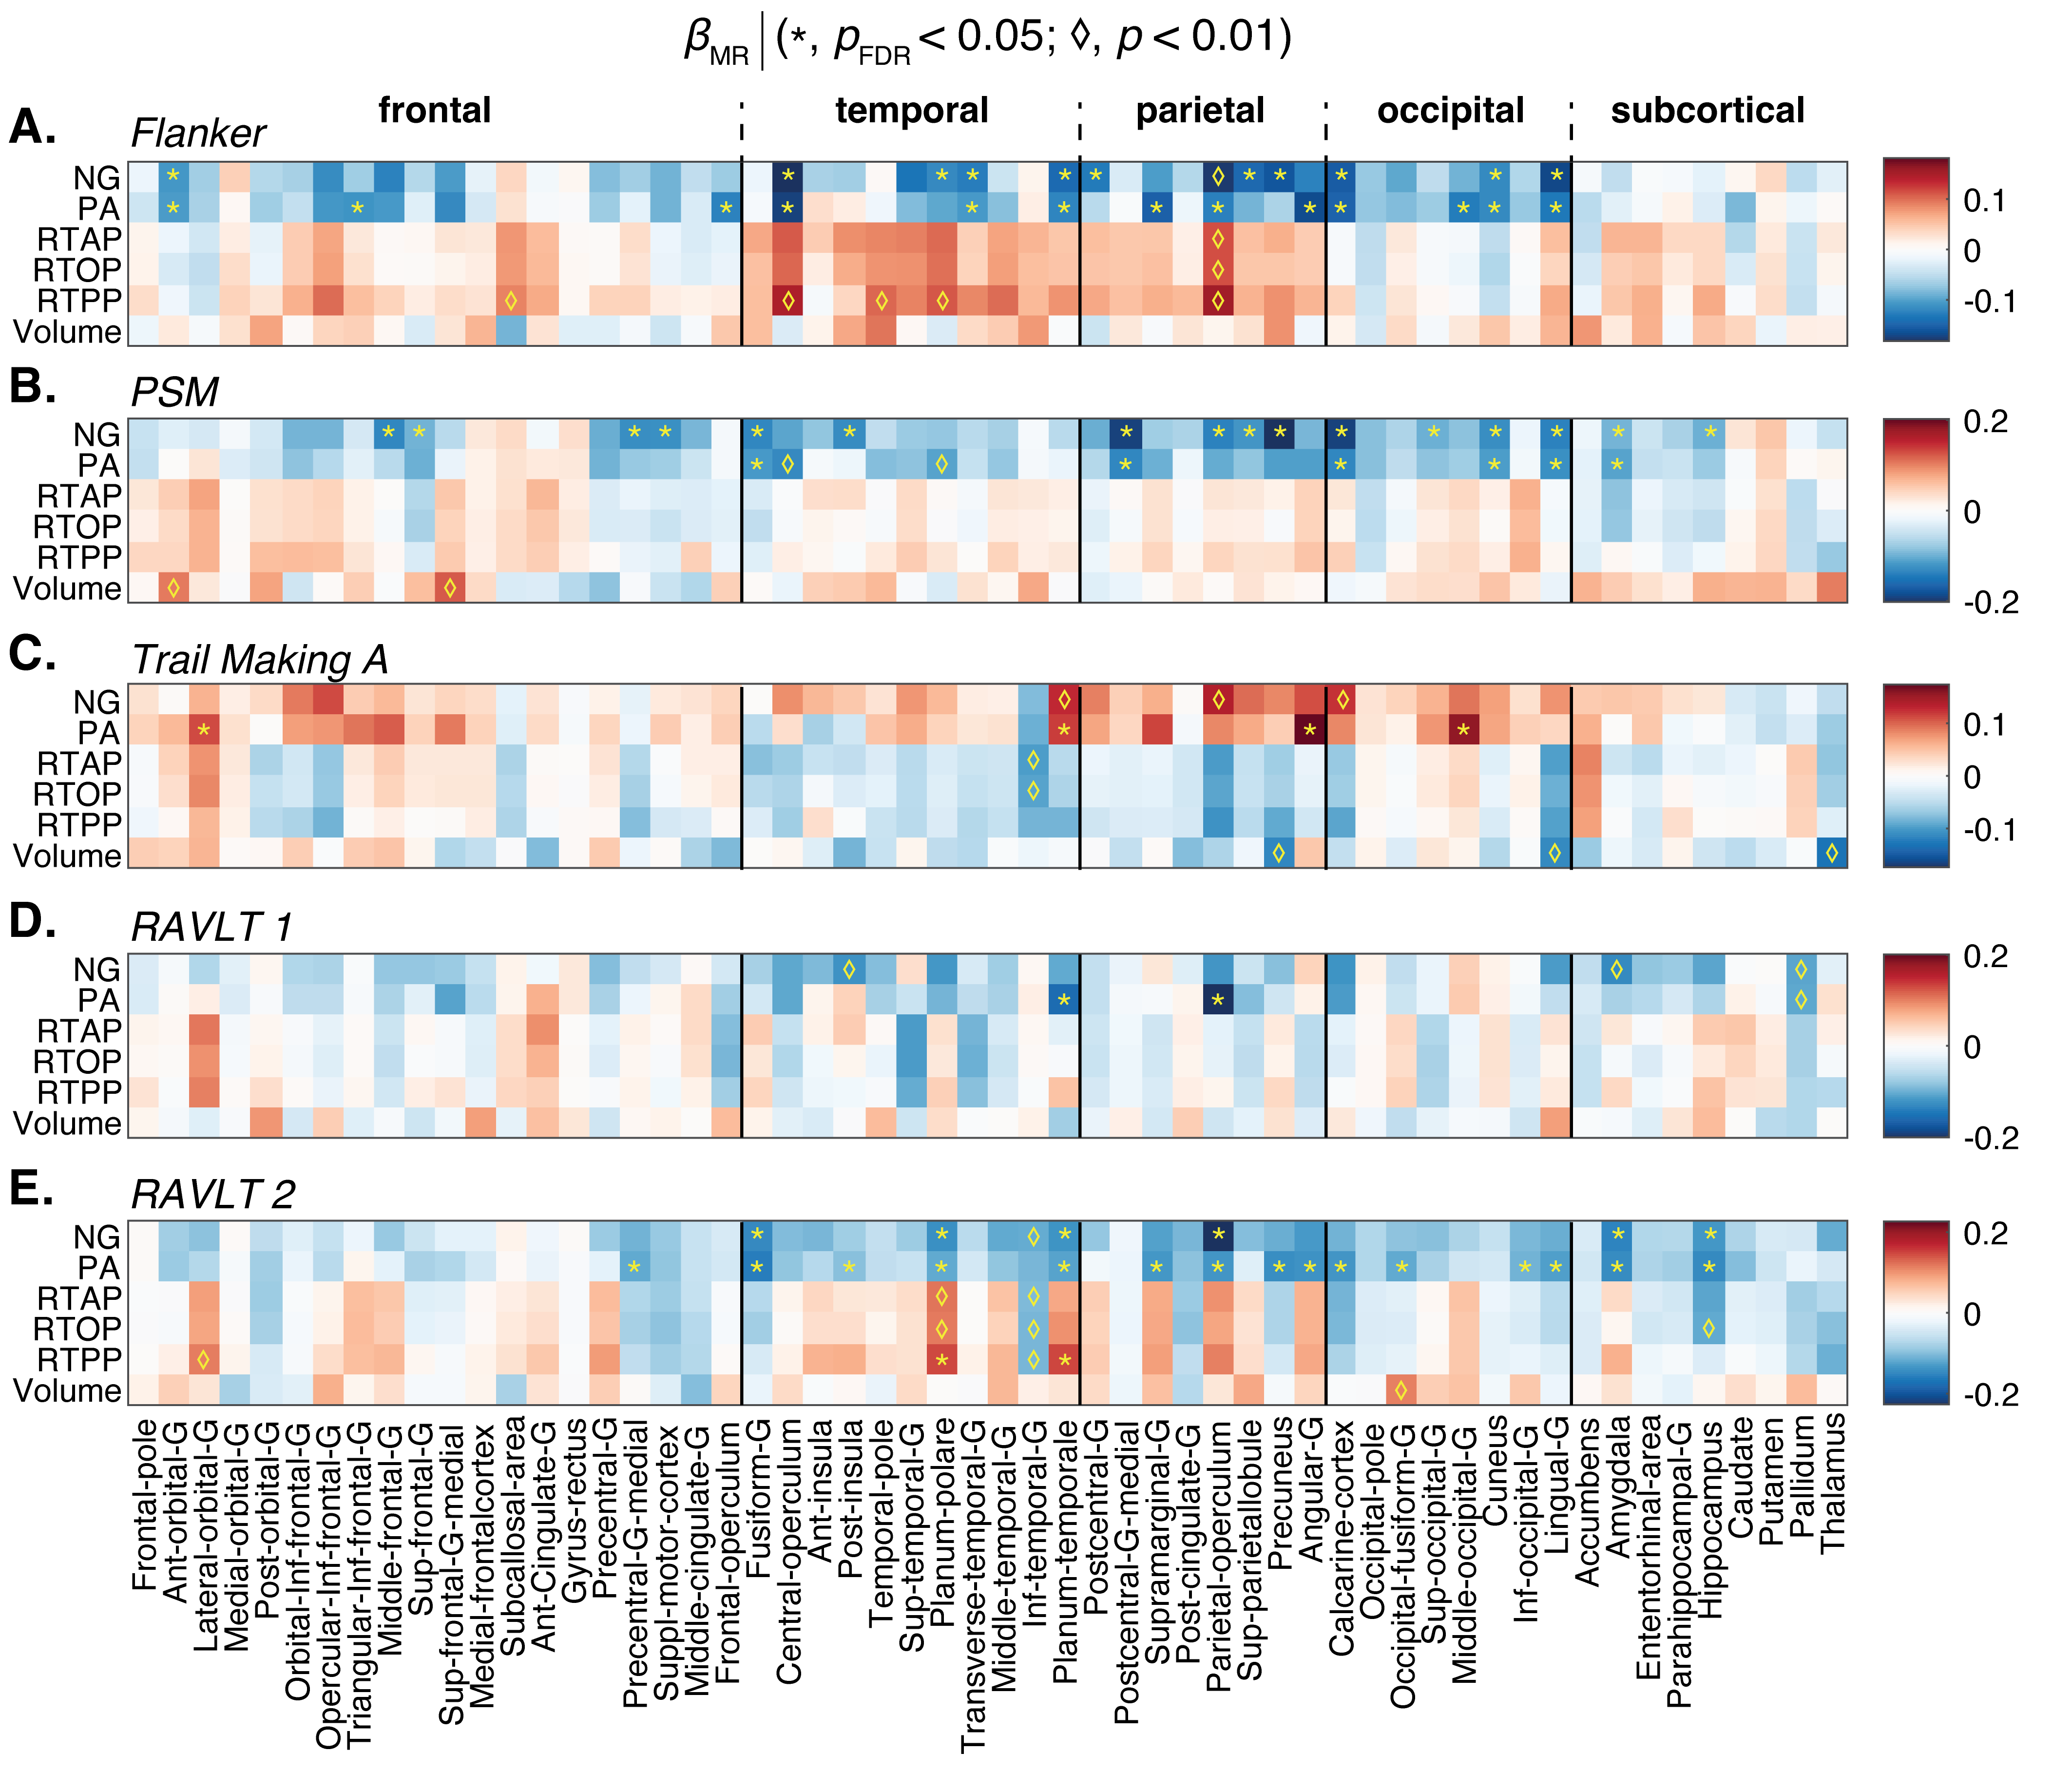
Statistical Analysis: 2 linear regression models were tested for (1) Effect of age on MRI parameters using 𝑃𝑖 = 𝛽0+ 𝛽sex*sex + 𝛽age*age + 𝛽age2*age2 +𝛽YOE*YOE + 𝛽site*site + 𝛽inter*sex X age + 𝛽inter2*sex X age2, where 𝑃𝑖 is the mean ROI value of the parameter of interest (e.g., NG, PA, volume, etc.) of the ith ROI. YOE=years of education. (2) Cognitive test scores as outcomes of MAP-MRI, C = 𝛽0+ 𝛽sex*sex + 𝛽age*age + 𝛽age2*age2 +𝛽YOE*YOE + 𝛽MR* 𝑃𝑖, where C are the NIH toolbox test scores. These six MRI features, along with NIH toolbox test scores were z-normalized for analysis. False discovery rate multiple comparisons correction14 with p < 0.05 was used. Matlab was used for all computations.
Results
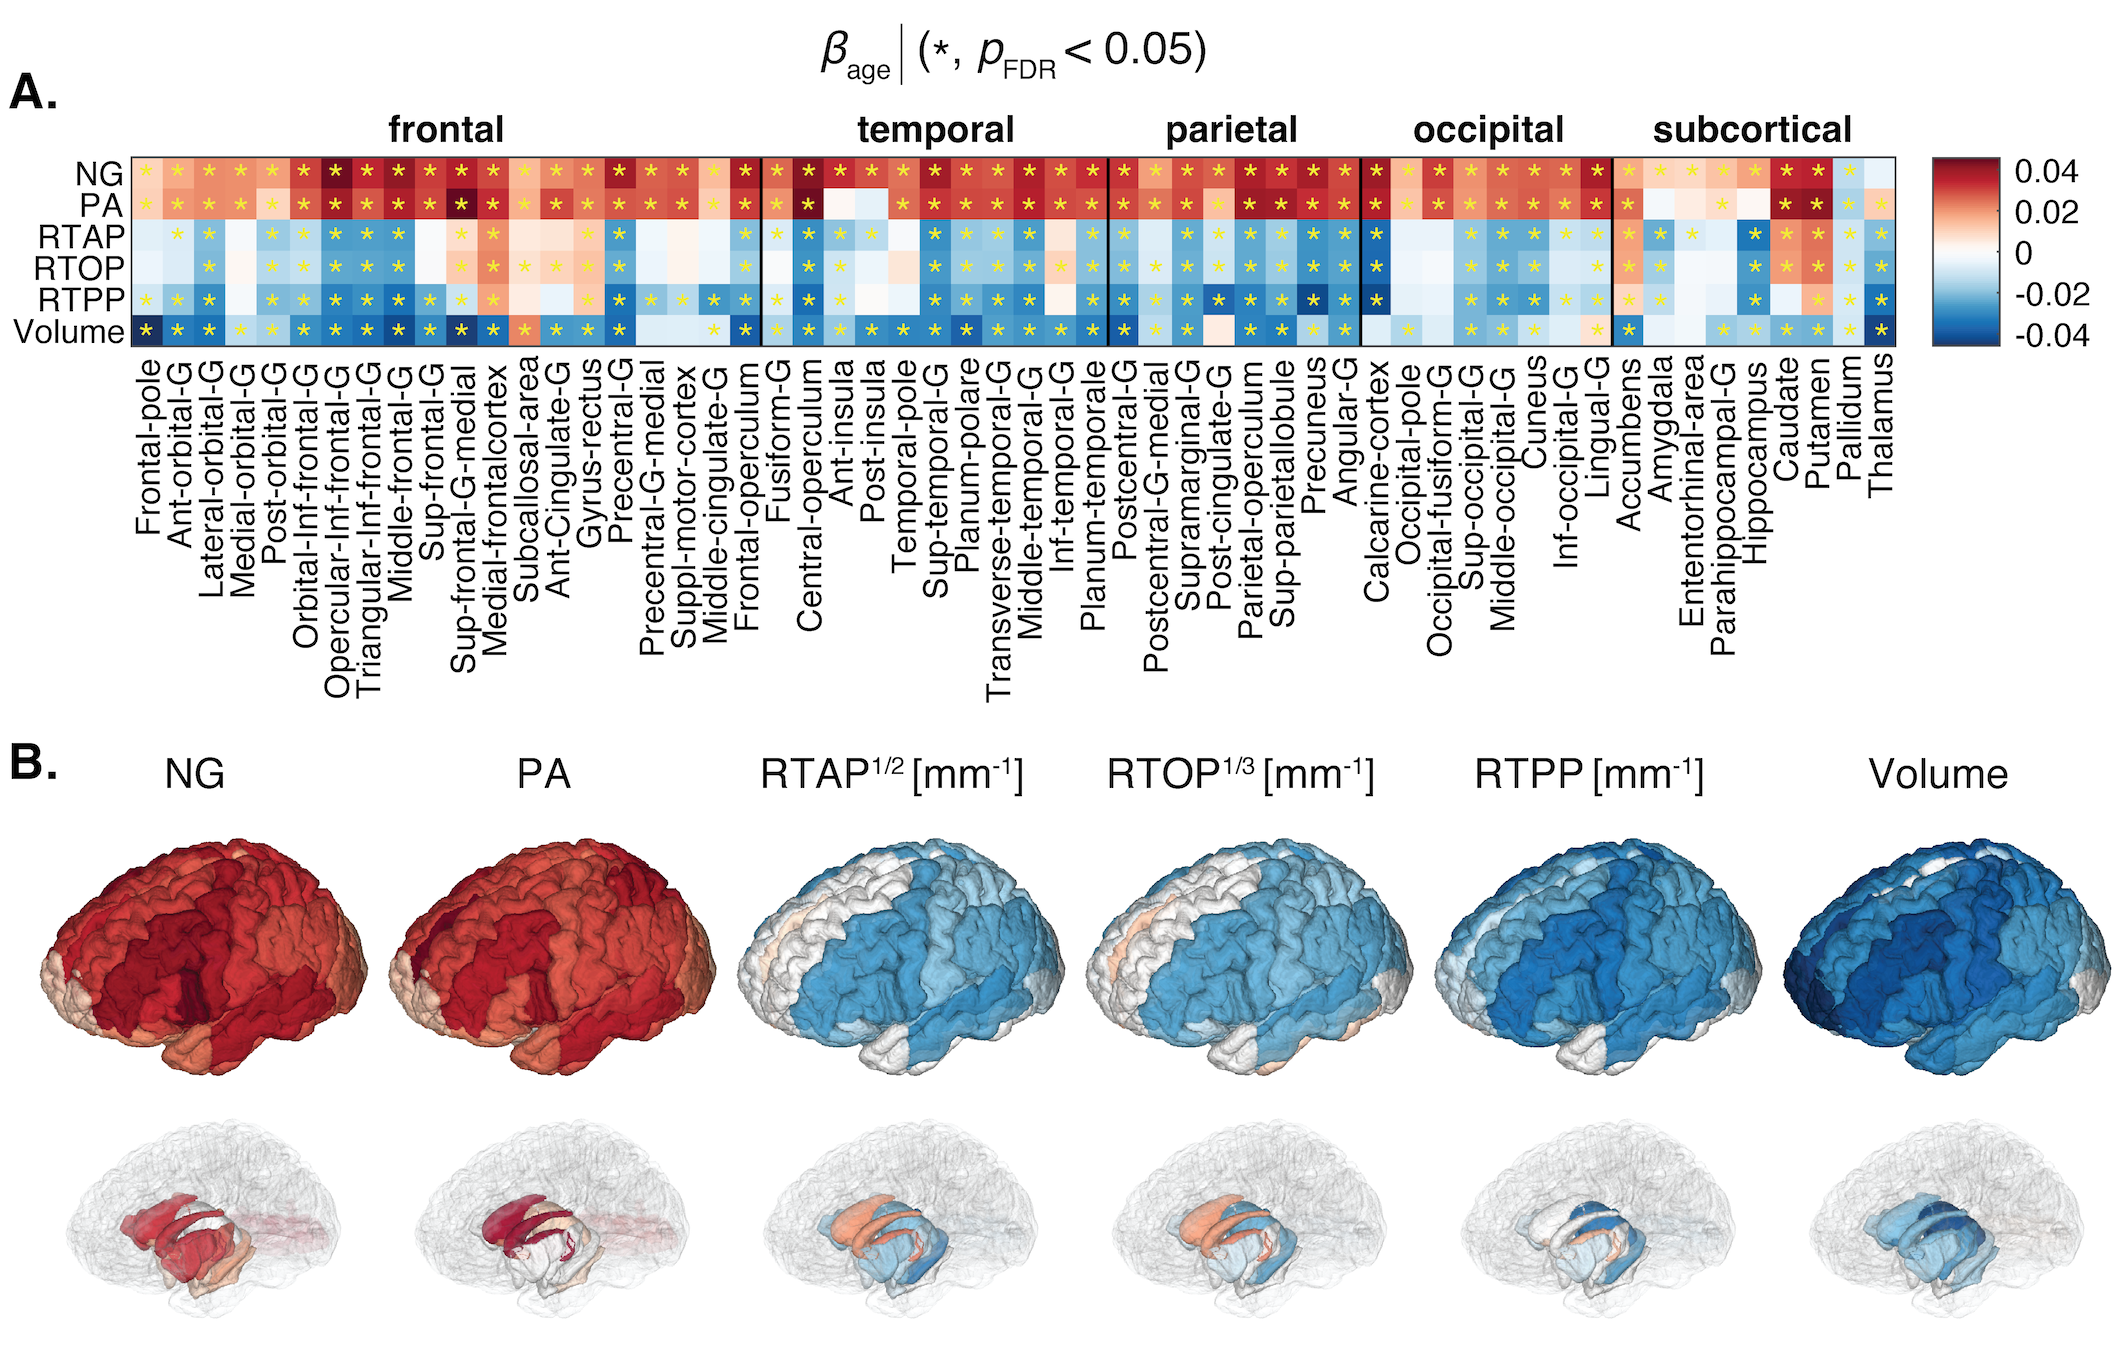
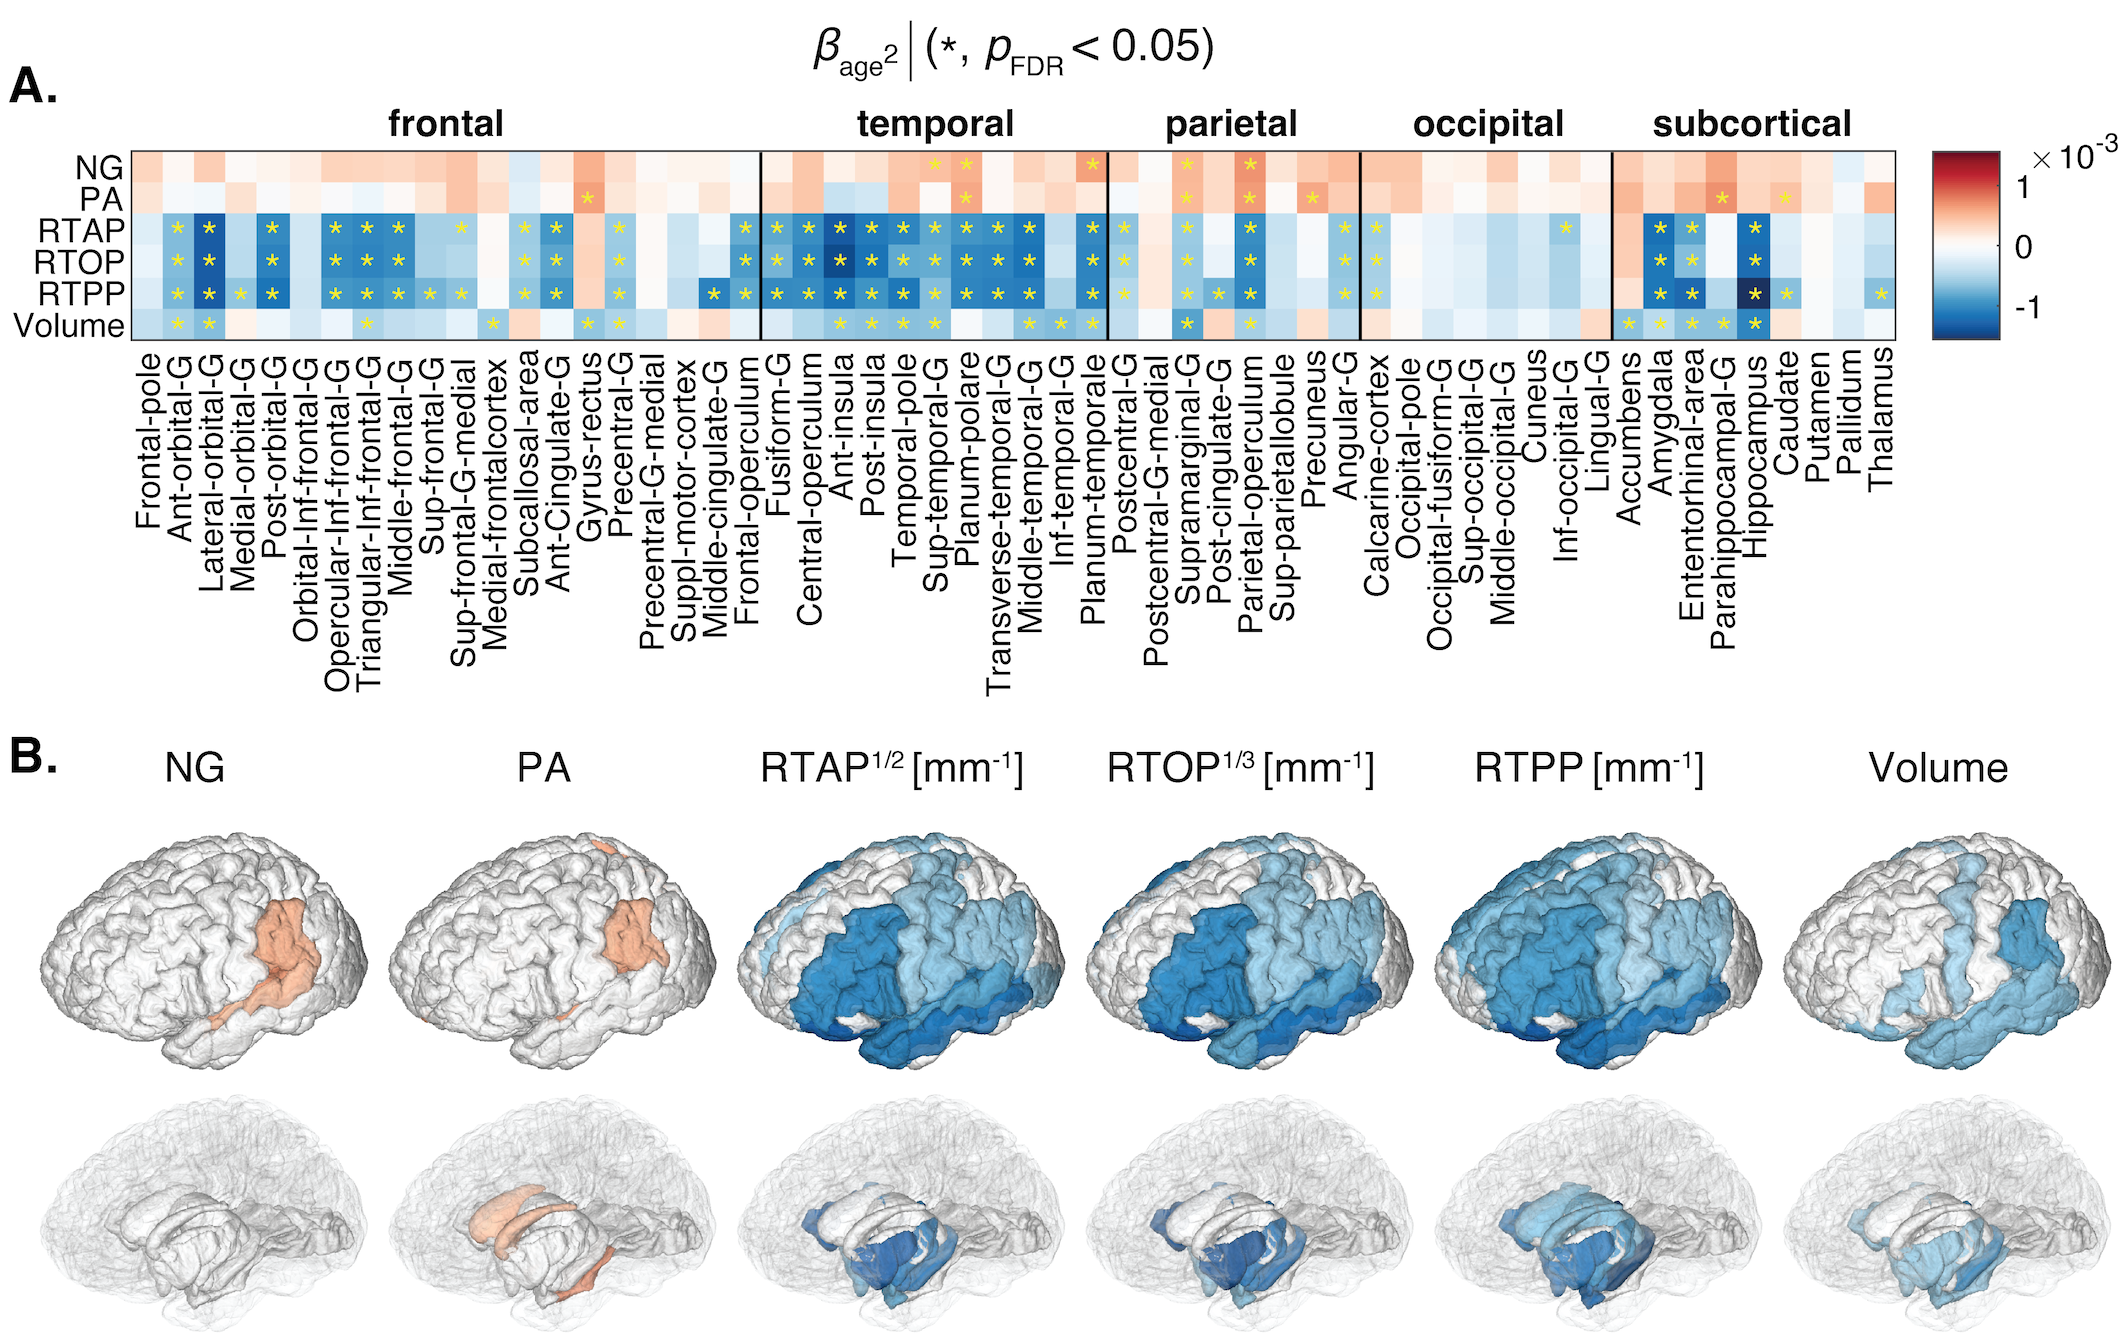
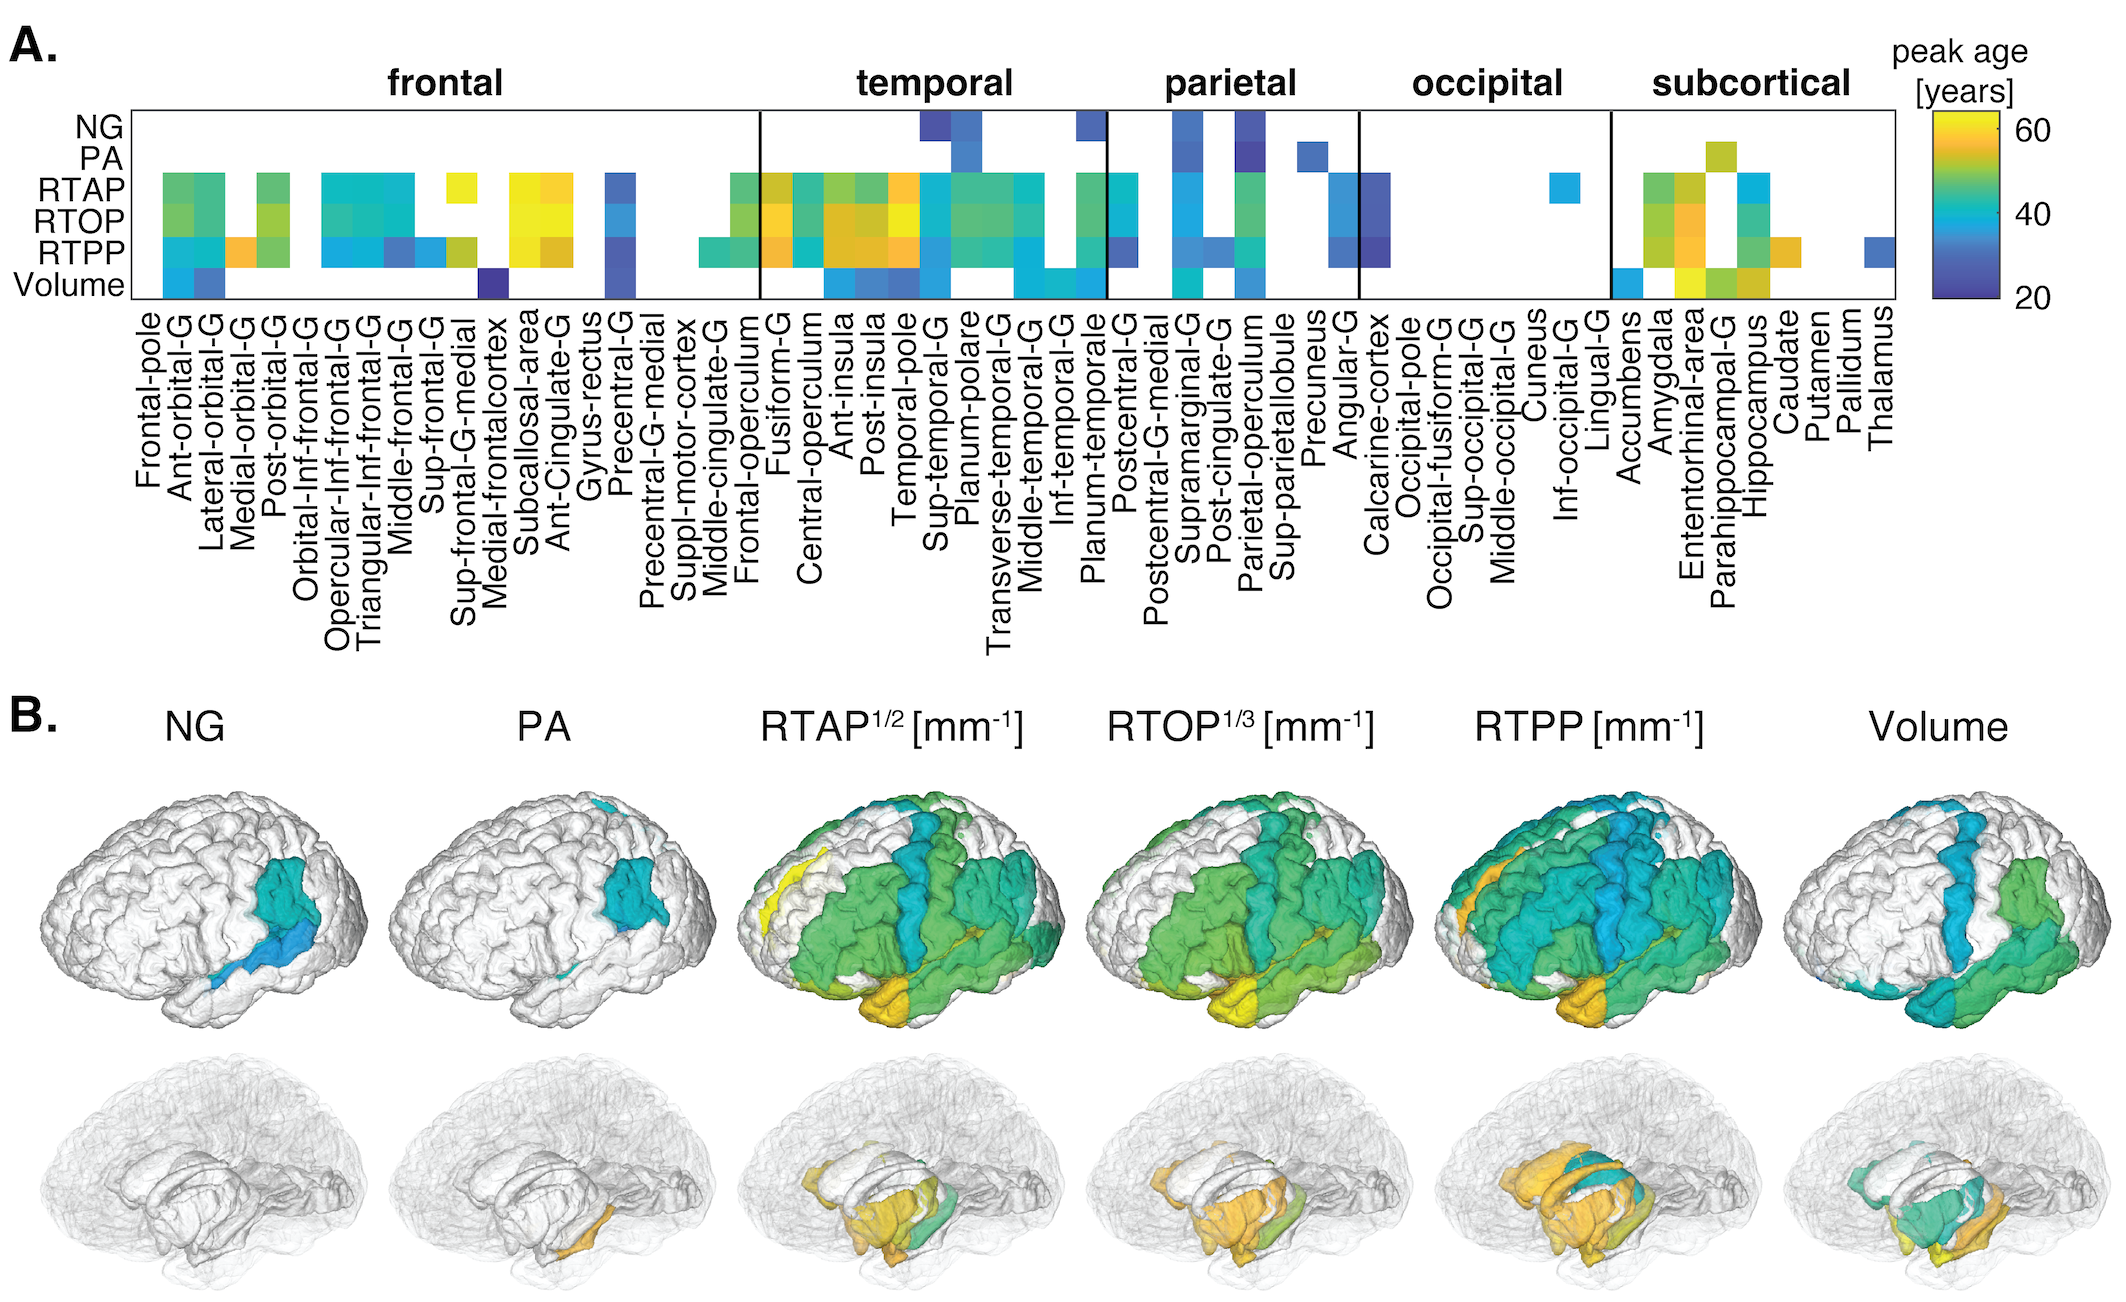
Microstructurally, NG and PA showed positive and RTAP, RTOP, and RTPP showed negative linear associations with age. However, the medial frontal cortex, gyrus rectus, accumbens, caudate and putamen, exhibited opposing trends with the RTAP, RTOP, and RTPP metrics (Figure 2). Negative quadratic associations with RTAP, RTOP, and RTPP were mostly seen in frontal, parietal, and temporal regions. Significant quadratic age-related associations in macrostructural volume were identified in the frontal, parietal, temporal, subcortex, and limbic system regions (Figure 3). Most regions exhibited maturation in the late forties (based on zero-displacement probabilities), while subcallosal area, anterior cingulate gyrus, fusiform area, insula, amygdala, and entorhinal cortex showed maturation in late fifties or sixties. In volumetric analysis, insular regions exhibited earlier peak ages, while memory-related regions (parahippocampus and hippocampus) peaked at about 50 years (Figure 4). Flanker test showed significant negative correlations with NG/PA in the cingulo-opercular and fronto-parietal control network. In PSM test, NG and PA showed significant associations with primary sensory areas (visual, auditory, somatosensory) and memory-related regions (prefrontal cortex, amygdala, hippocampus). Trail Making A test showed significant positive correlation with PA in occipital regions. RAVLT2 showed significant negative correlation with PA/NG and significant positive correlation with RTPP in insular, limbic and occipital regions (Figure 5).Discussion and Conclusion
MAP-MRI showed age-related linear and quadratic trajectories of 56 GM regions with distinctive peak age. Micro- and macrostructural changes were associated with memory and executive functions decline. Compensatory prefrontal cortex activity in older adults may explain cognitive performance maintenance despite age-related functional changes. We found stability of the limbic network with age15 and late development and early decline of executive functions, particularly inhibition16. This is the first study establishing MAP-MRI could serve as a valuable tool for predicting age-related cognitive, behavioral, and microstructure changes.Acknowledgements
This work was supported by the Intramural Research Program of the National Institute on Aging.References
1 Madden David J., Bennett Ilana J., Song Allen W. Cerebral White Matter Integrity and Cognitive Aging: Contributions from Diffusion Tensor Imaging. Neuropsychol Rev 2009;19(4):415–35. Doi: 10.1007/s11065-009-9113-2.2 Fujita Shohei, Mori Susumu, Onda Kengo, Hanaoka Shouhei, Nomura Yukihiro, Nakao Takahiro, et al. Characterization of Brain Volume Changes in Aging Individuals With Normal Cognition Using Serial Magnetic Resonance Imaging. JAMA Netw Open 2023;6(6):e2318153. Doi: 10.1001/jamanetworkopen.2023.18153.
3 Bouhrara Mustapha, Avram Alexandru V., Kiely Matthew, Trivedi Aparna, Benjamini Dan. Adult lifespan maturation and degeneration patterns in gray and white matter: A mean apparent propagator (MAP) MRI study. Neurobiol Aging 2023;124:104–16. Doi: 10.1016/j.neurobiolaging.2022.12.016.
4 Avram Alexandru V., Sarlls Joelle E., Barnett Alan S., Özarslan Evren, Thomas Cibu, Irfanoglu M. Okan, et al. Clinical feasibility of using mean apparent propagator (MAP) MRI to characterize brain tissue microstructure. NeuroImage 2016;127:422–34. Doi: 10.1016/j.neuroimage.2015.11.027.
5 Boscolo Galazzo Ilaria, Brusini Lorenza, Obertino Silvia, Zucchelli Mauro, Granziera Cristina, Menegaz Gloria. On the Viability of Diffusion MRI-Based Microstructural Biomarkers in Ischemic Stroke. Front Neurosci 2018;12.
6 Ma Keran, Zhang Xiaonan, Zhang Huiting, Yan Xu, Gao Ankang, Song Chengru, et al. Mean apparent propagator-MRI: A new diffusion model which improves temporal lobe epilepsy lateralization. Eur J Radiol 2020;126:108914. Doi: 10.1016/j.ejrad.2020.108914.
7 Le Hongbo, Zeng Weike, Zhang Huihong, Li Jianing, Wu Xiaoyan, Xie Mingwei, et al. Mean Apparent Propagator MRI Is Better Than Conventional Diffusion Tensor Imaging for the Evaluation of Parkinson’s Disease: A Prospective Pilot Study. Front Aging Neurosci 2020;12.
8 Harms Michael P., Somerville Leah H., Ances Beau M., Andersson Jesper, Barch Deanna M., Bastiani Matteo, et al. Extending the Human Connectome Project across ages: Imaging protocols for the Lifespan Development and Aging projects. NeuroImage 2018;183:972–84. Doi: 10.1016/j.neuroimage.2018.09.060.
9 Kellner Elias, Dhital Bibek, Kiselev Valerij G., Reisert Marco. Gibbs-ringing artifact removal based on local subvoxel-shifts. Magn Reson Med 2016;76(5):1574–81. Doi: 10.1002/mrm.26054.
10 Rohde G.k., Barnett A.s., Basser P.j., Marenco S., Pierpaoli C. Comprehensive approach for correction of motion and distortion in diffusion-weighted MRI. Magn Reson Med 2004;51(1):103–14. Doi: 10.1002/mrm.10677.
11 Irfanoglu M. Okan, Modi Pooja, Nayak Amritha, Hutchinson Elizabeth B., Sarlls Joelle, Pierpaoli Carlo. DR-BUDDI (Diffeomorphic Registration for Blip-Up blip-Down Diffusion Imaging) method for correcting echo planar imaging distortions. NeuroImage 2015;106:284–99. Doi: 10.1016/j.neuroimage.2014.11.042.
12 Özarslan Evren, Koay Cheng Guan, Shepherd Timothy M., Komlosh Michal E., İrfanoğlu M. Okan, Pierpaoli Carlo, et al. Mean apparent propagator (MAP) MRI: a novel diffusion imaging method for mapping tissue microstructure. NeuroImage 2013;78:16–32. Doi: 10.1016/j.neuroimage.2013.04.016.
13 Xiong Yunxi, Huo Yuankai, Wang Jiachen, Davis L. Taylor, McHugo Maureen, Landman Bennett A. Reproducibility Evaluation of SLANT Whole Brain Segmentation Across Clinical Magnetic Resonance Imaging Protocols. Proc SPIE-- Int Soc Opt Eng 2019;10949:109492V. Doi: 10.1117/12.2512561.
14 Benjamini Yoav, Yekutieli Daniel. The control of the false discovery rate in multiple testing under dependency. Ann Stat 2001;29(4):1165–88. Doi: 10.1214/aos/1013699998.
15 Bajaj Sahil, Alkozei Anna, Dailey Natalie S., Killgore William D. S. Brain Aging: Uncovering Cortical Characteristics of Healthy Aging in Young Adults. Front Aging Neurosci 2017;9.
16 Ruiz-Rizzo Adriana L., Viviano Raymond P., Daugherty Ana M., Finke Kathrin, Müller Hermann J., Damoiseaux Jessica S. Subjective cognitive decline predicts lower cingulo-opercular network functional connectivity in individuals with lower neurite density in the forceps minor. NeuroImage 2022;263:119662. Doi: 10.1016/j.neuroimage.2022.119662.
Figures