4801
ASL combined with T1 mapping for assessment of renal function and histopathology in patients with long-term renal transplant survival1The First Affiliated Hospital of Soochow University, Suzhou, China, 2Philips Healthcare, Shanghai, China
Synopsis
Keywords: Kidney, Arterial spin labelling, renal transplantation
Motivation: Early and sensitive detection of graft renal dysfunction can help timely diagnosis of the disease and improve prognosis.
Goal(s): We aimed to investigate the value of ASL and T1 mapping for assessing renal function in patients with long-term renal transplant survival.
Approach: 63 patients were included, and all patients underwent MRI examination. MRI parameters were calculated and analyzed.
Results: This study revealed that the combined application of ASL and T1 mapping can accurately assess the degree of renal impairment, and significant correlations were found between MRI parameters and several important Banff pathological scores which determined the diagnosis of renal allograft rejection and chronicity.
Impact: The significant correlations between MRI parameters and pathological changes involving allograft rejection and chronicity highlight the clinical value of multiparametric MRI as a noninvasive and comprehensive modality for early diagnosis and longitudinal monitoring of renal allograft injury.
Introduction
In patients with end-stage renal disease, renal transplantation is the optimal treatment option compared to dialysis. However, in recent years, various complications including allograft rejection have been threatening the long-term survival rate of transplanted kidneys. Creatinine serves as a marker for monitoring renal function in clinical settings. However, it may not sensitively detect rapid changes in renal function until over 50% of renal function is lost [1]. Renal biopsy continues to be the reference standard in diagnosing diseases of transplanted kidneys. Nevertheless, it is invasive, time-consuming, and exhibits sampling biases [2]. Magnetic resonance imaging (MRI) can provide morphological and functional information about the transplanted kidney [3]. Arterial spin labeling (ASL) can accurately evaluate the blood perfusion of transplanted kidneys without the need for exogenous contrast agents. T1 mapping allows the direct measurement of T1 relaxation time, quantifying small tissue changes [4]. We aimed to investigate the value of ASL combined with T1 mapping for assessing renal function in patients with long-term renal transplant survival and to establish radiological and histopathologic correlations between MRI parameters and kidney allograft biopsy findings.Methods
A total of 63 patients with long-term renal transplant survival after kidney transplantation were included (group A, estimated glomerular filtration rate (eGFR) ≥ 60 mL/min/1.73 m2, 30 patients; group B, 30≤ eGFR <60 mL/min/1.73 m2, 20 patients; group C, eGFR < 30 mL/min/1.73 m2, 13 patients). All patients were scanned using a 1.5 T MRI scanner (Ingenia Ambition, Philips Healthcare, Best, the Netherlands) equipped with a 28-channel phased-array coil. The detailed scan parameters are shown in Table 1. Several regions of interest (ROIs) were manually placed on the renal blood flow (RBF) maps and T1 maps. The ΔT1 was defined as 100 × (cortical T1˗medullary T1)/cortical T1). Twenty patients underwent an ultrasonography-guided percutaneous renal transplant biopsy. The kidney transplant biopsies were evaluated based on the Banff classification. The major Banff pathological scores included tubular atrophy (ct score), interstitial fibrosis (ci score), peritubular capillaritis (ptc score), interstitial inflammation (i score), and tubulitis (t score). The main pathological changes of acute rejection were inflammatory cell infiltration and histiocytic edema. Tubular atrophy and interstitial fibrosis indicate chronicity. MRI parameters were compared using a one-way analysis of variance. The correlations between MRI parameters, eGFR, and Banff pathological scores were analyzed using Pearson or Spearman correlation coefficient. The performance of MRI parameters in detecting the degree of allograft impairment was assessed using the receiver operating characteristic curve. Statistical significance was set to a P-value<0.05.Results
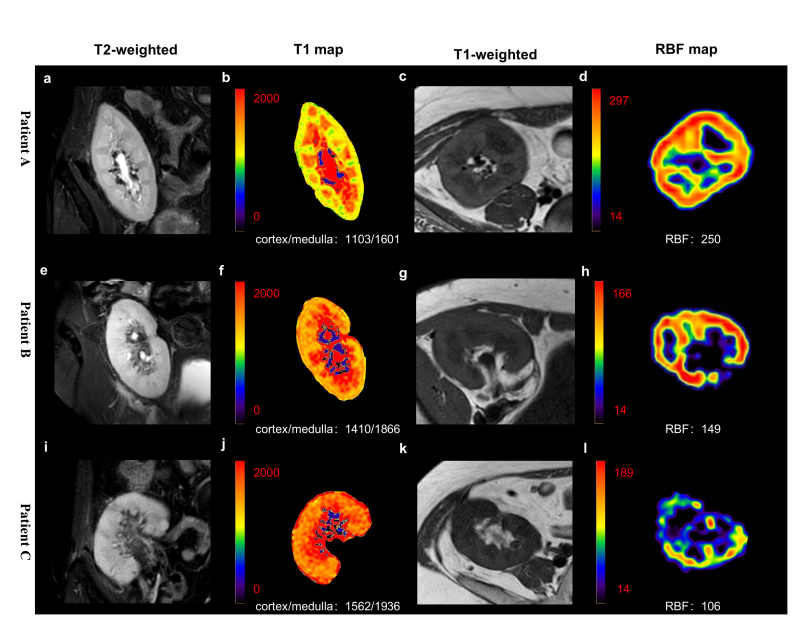
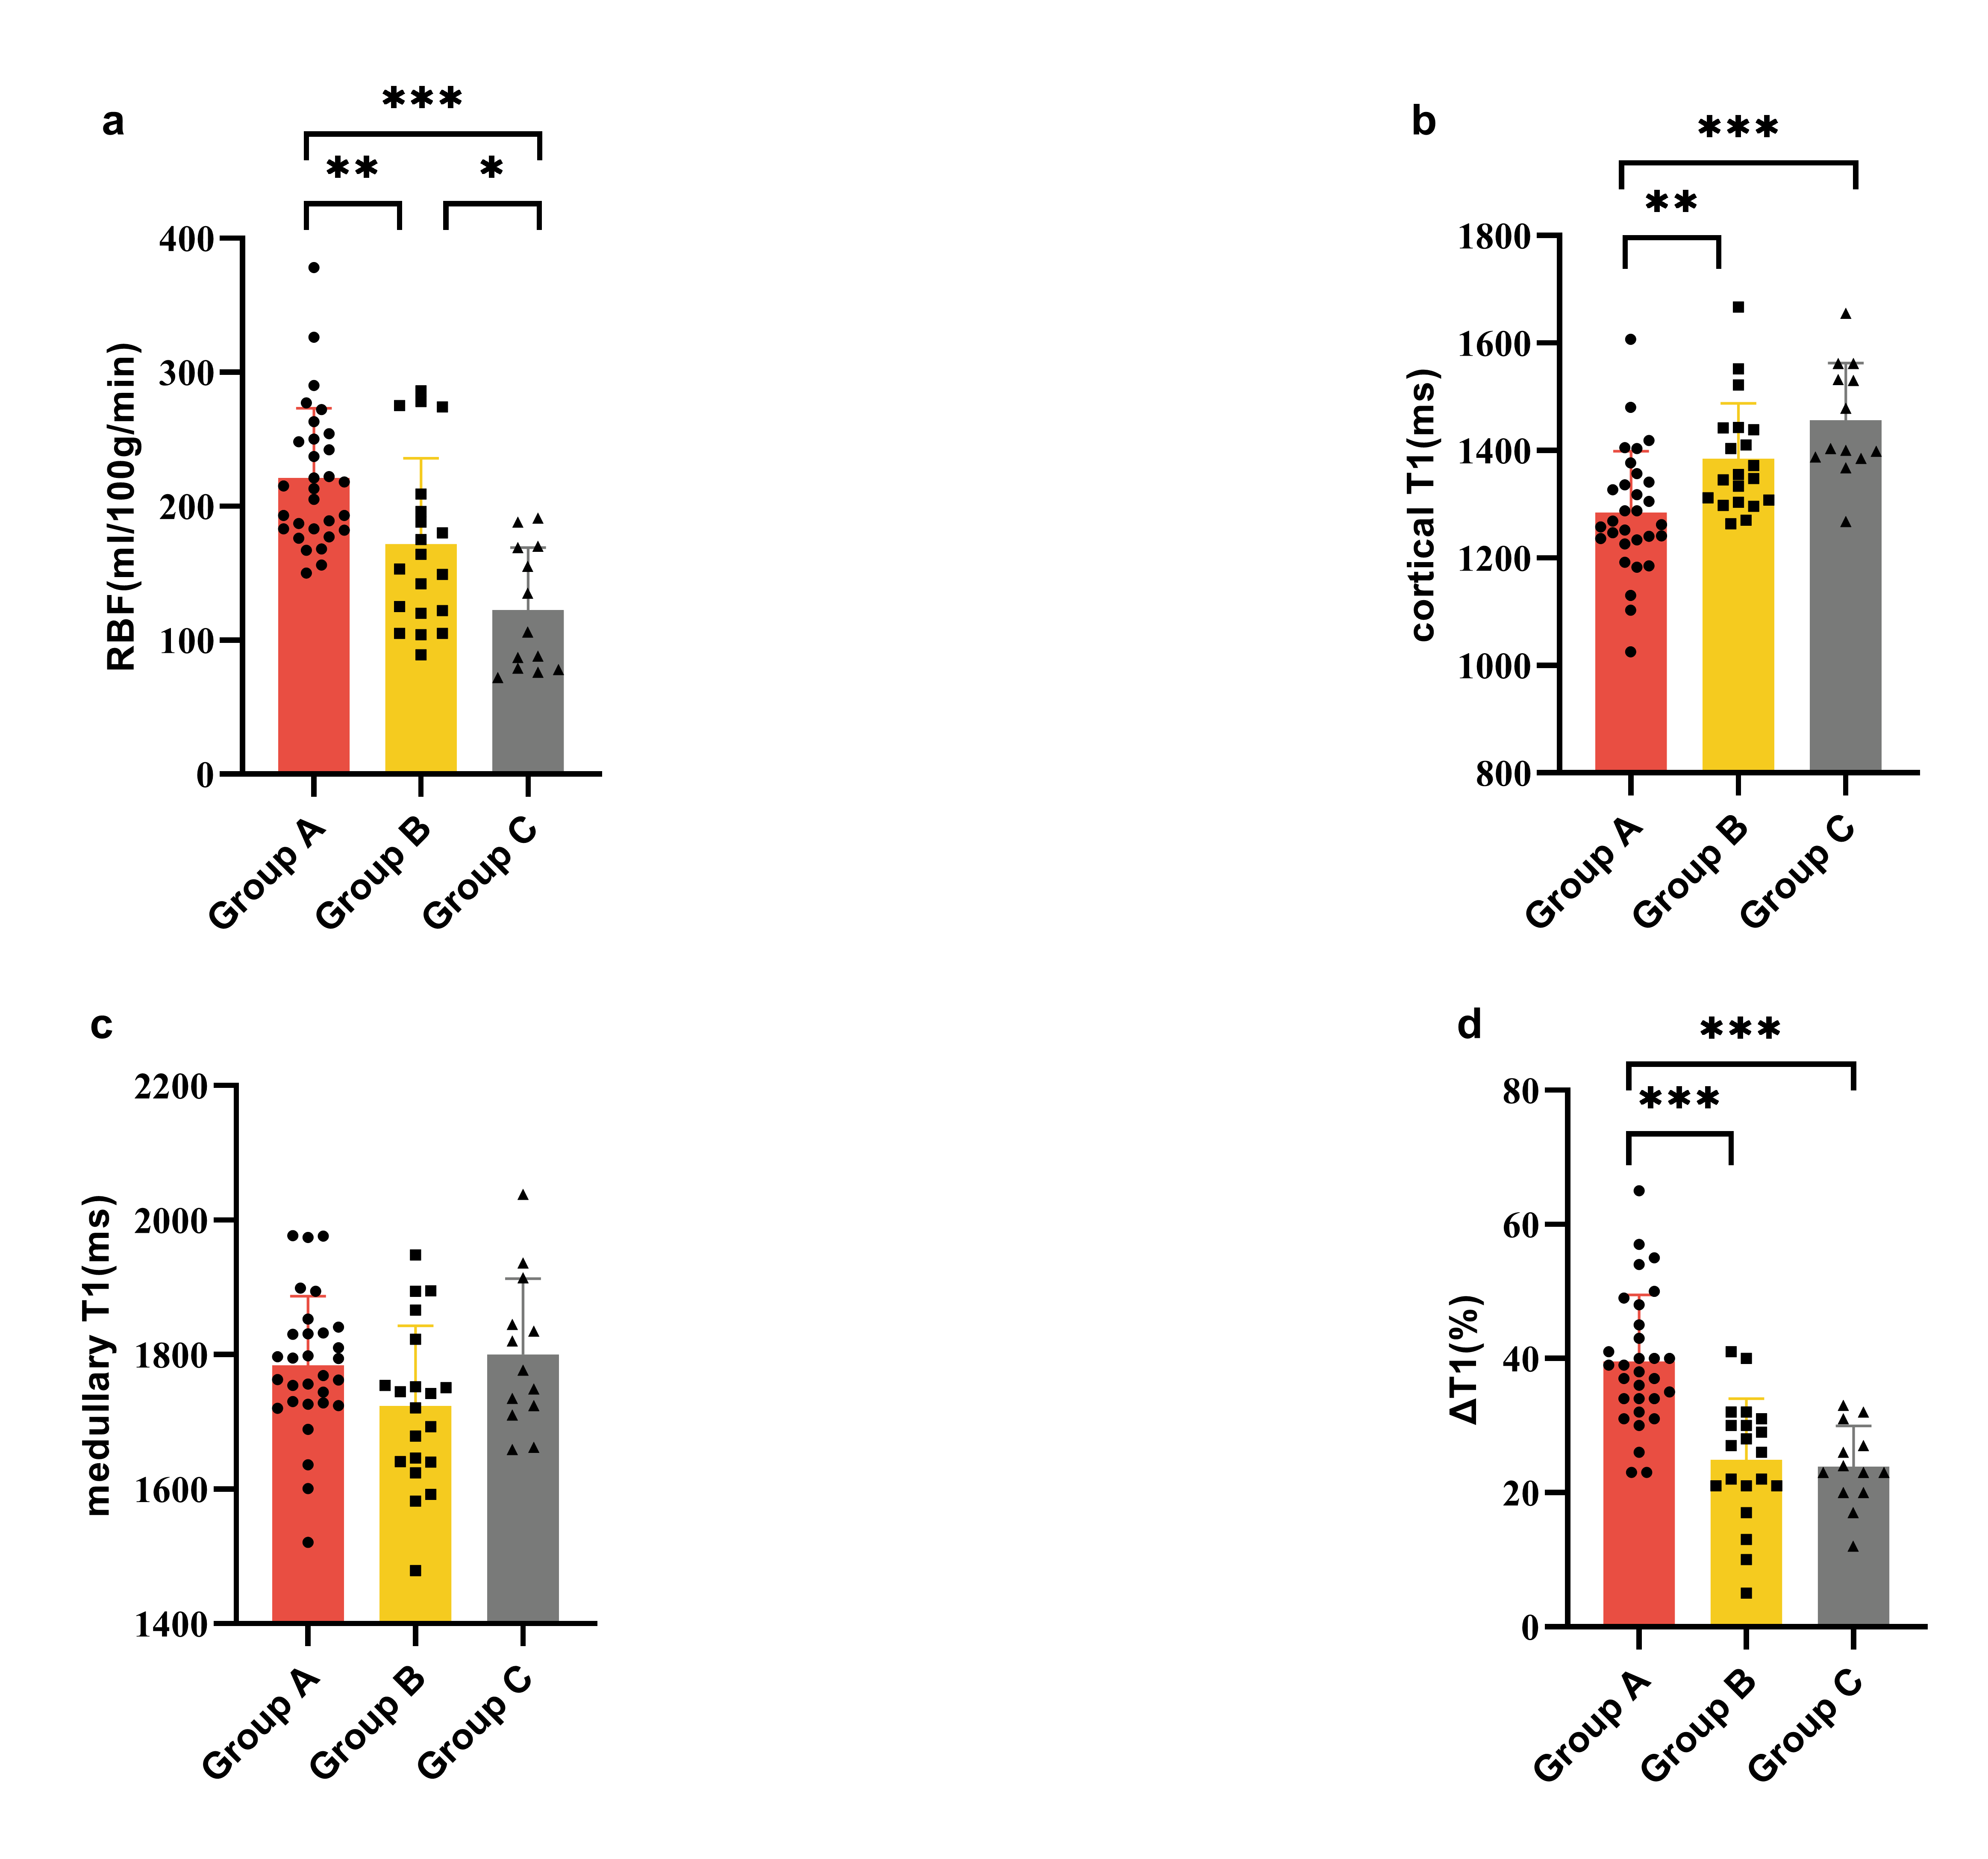
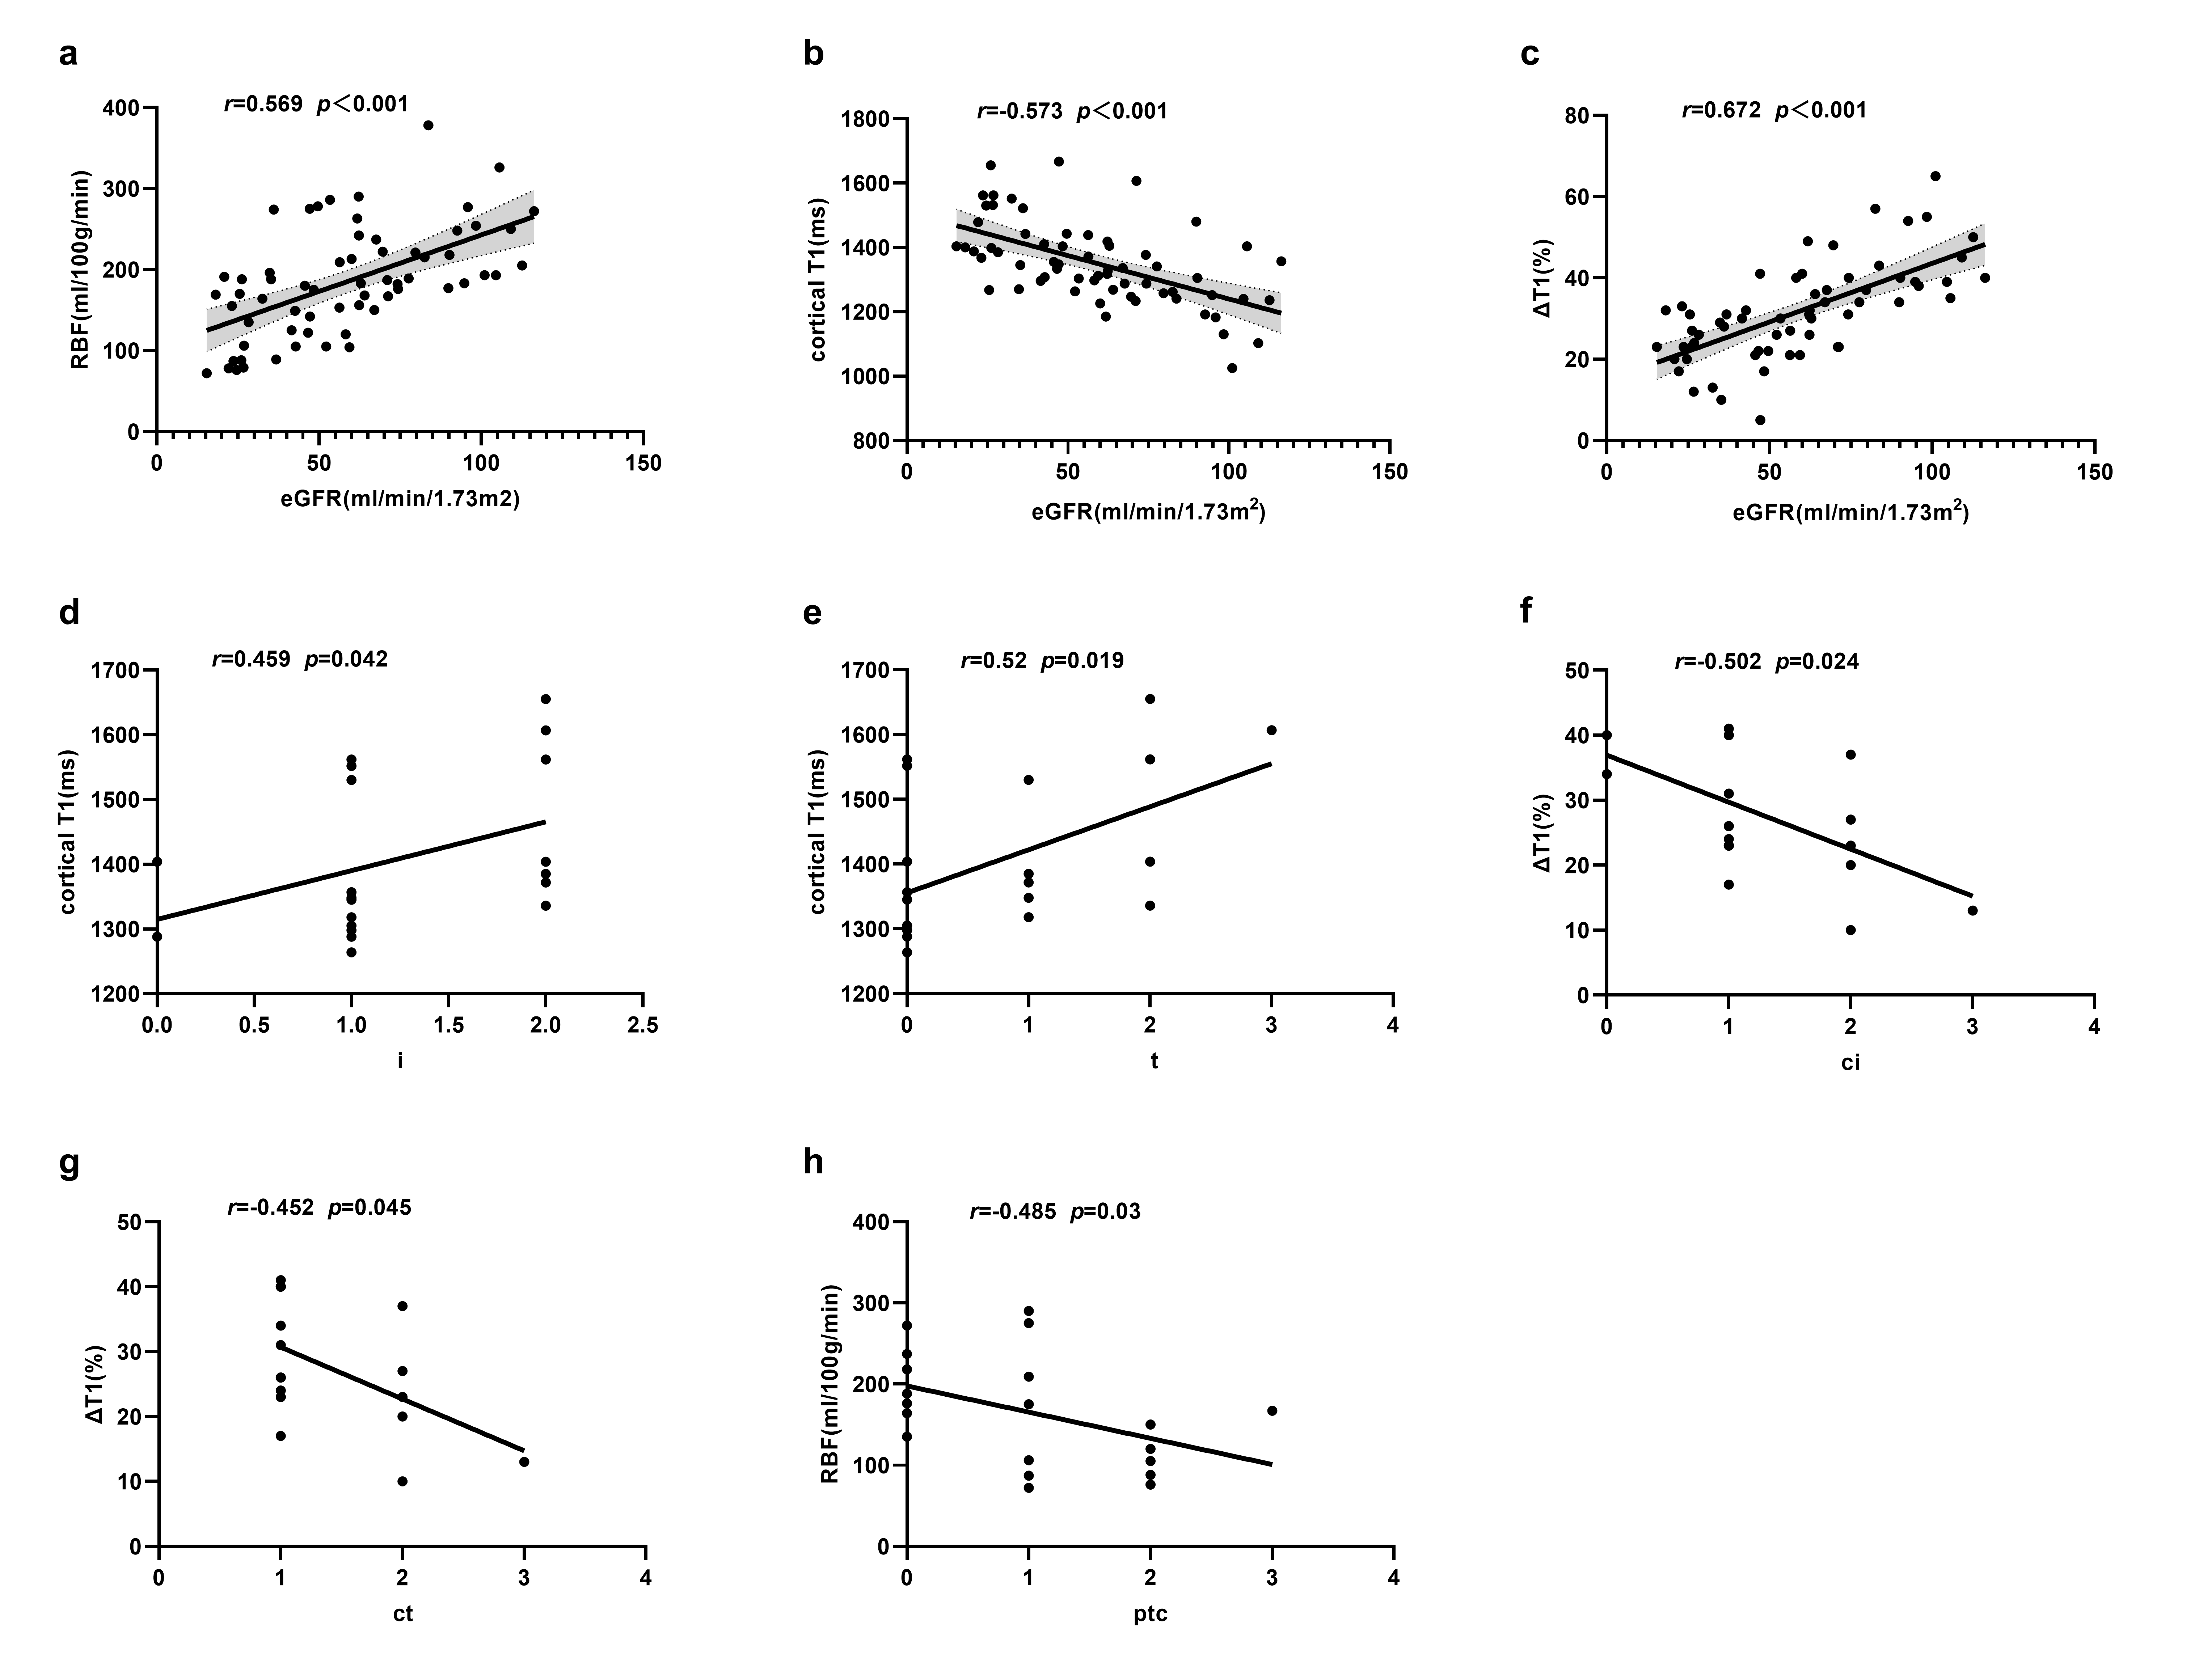
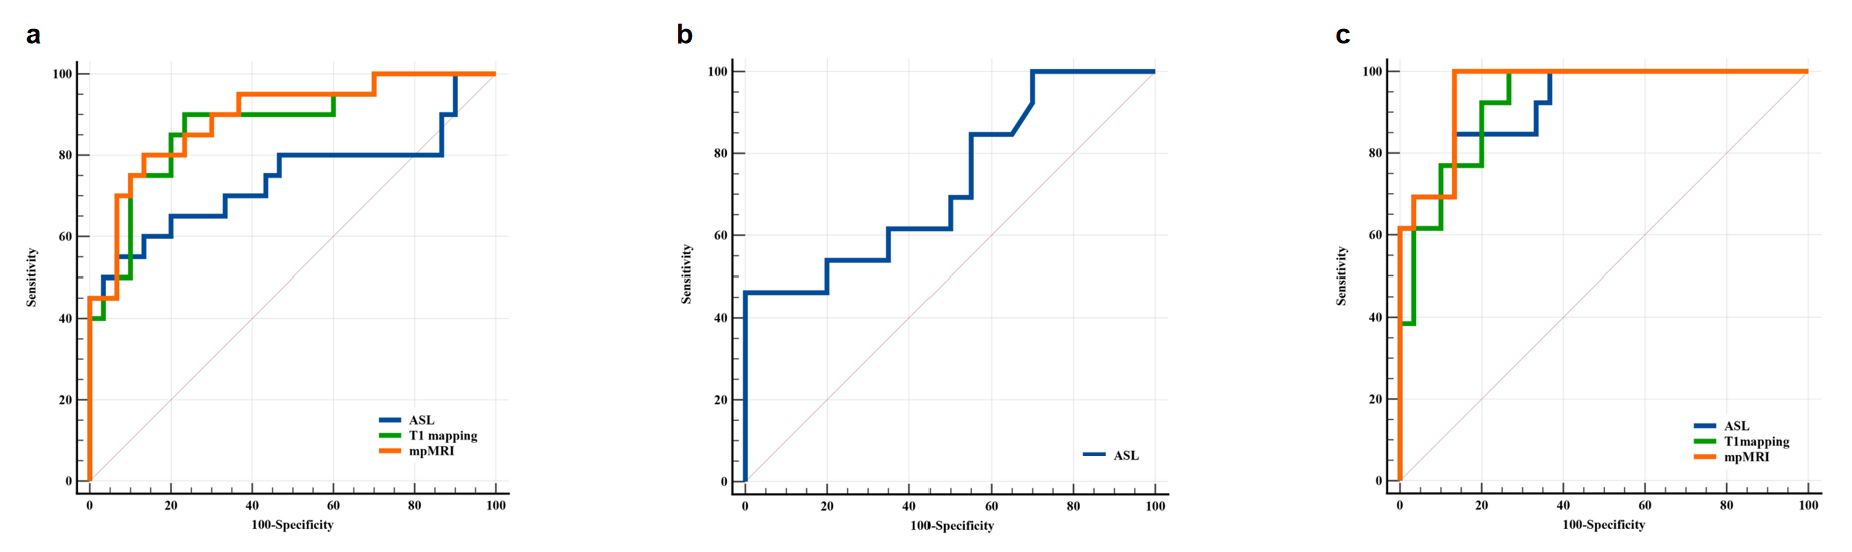
Cortical T1 increased, whereas RBF and ΔT1 decreased with higher stages of renal function impairment (Figure 1, 2). The RBF, cortical T1, and ΔT1 values were moderately correlated with eGFR (r=0.569, -0.573, and 0.672, respectively). Cortical T1 showed a positive correlation with the i and t scores (r=0.459 and 0.520, respectively). The ΔT1 was negatively correlated with the ci and ct scores (r=-0.502 and -0.452, respectively). The RBF showed a negative correlation with the ptc scores (r=-0.485). The AUC for the discrimination of groups A versus B and groups A versus C were 0.740 and 0.923, respectively, using ASL; 0.873 and 0.926, respectively, using T1 mapping; and 0.892 and 0.956, respectively, using multi-parameter MRI. The AUC for discrimination between groups B and C was 0.729 using ASL (Figure 4).Discussion
In patients with long-term renal transplant survival, RBF was positively correlated with eGFR. The number of capillaries and tubules decreases with impaired renal function, leading to reduced renal perfusion, which can be detected noninvasively using ASL [5]. Prolonged cortical T1 in the group with moderate to severely impaired renal function may be due to the accumulation of water in the interstitial of the transplanted kidney, which can be caused by pathophysiological changes, such as interstitial fibrosis, edema, and inflammation [6]. In addition, high renal oxygen levels may lead to a decrease in T1 values [7]. Interstitial fibrosis may lead to a decrease in peritubular capillaries causing hypoxia in the kidney. Our study found a moderate correlation between MRI parameters and Banff histological scores in the diagnosis of renal allograft rejection. According to the 2012 Clinical Practice Guideline for the Care of Kidney Transplant Recipients (NKF-KDIGO), a biopsy should be performed when acute rejection of a transplanted kidney is highly suspected, and the anti-rejection treatment regimen should be adjusted according to the biopsy results [8]. The Banff score directly impacts the clinical management of patients with transplanted kidneys.Conclusion
The RBF, cortical T1, and ΔT1 can serve as new imaging biomarkers of renal function and histopathological microstructure.Acknowledgements
No acknowledgement found.References
1. Earley A, Miskulin D, Lamb EJ, et al. Estimating equations for glomerular filtration rate in the era of creatinine standardization: a systematic review. Ann Intern Med. 2012, 156, 785-795.
2. Schwarz A, Gwinner W, Hiss M, et al. Safety and adequacy of renal transplant protocol biopsies. Am J Transplant. 2005, 5, 1992-1996.
3. Kirpalani A, Hashim E, Leung G, et al. Magnetic Resonance Elastography to Assess Fibrosis in Kidney Allografts. Clin J Am Soc Nephrol. 2017, 12, 1671-1679.
4. Li Z, Sun J, Hu X, et al. Assessment of liver fibrosis by variable flip angle T1 mapping at 3.0T. J Magn Reson Imaging. 2016, 43, 698-703.
5. Cai XR, Yu J, Zhou QC, et al. Use of intravoxel incoherent motion MRI to assess renal fibrosis in a rat model of unilateral ureteral obstruction. J Magn Reson Imaging. 2016, 44, 698-706.
6. Schmidbauer M, Rong S, Gutberlet M, et al. Diffusion-Weighted Imaging and Mapping of T1 and T2 Relaxation Time for Evaluation of Chronic Renal Allograft Rejection in a Translational Mouse Model. J Clin Med. 2021, 10, 4318.
7. O'Connor JP, Jackson A, Buonaccorsi GA, et al. Organ-specific effects of oxygen and carbogen gas inhalation on tissue longitudinal relaxation times. Magn Reson Med. 2007, 58, 490-496.
8. Kasiske BL, Zeier MG, Chapman JR, et al. Kidney Disease: Improving Global Outcomes. KDIGO clinical practice guideline for the care of kidney transplant recipients: a summary. Kidney Int 2010, 377, 299–311
Figures