4798
In vivo MR Elastography of mice liver: Comparison of motion encoding strategies between RF optimal control and oscillating gradients.1CREATIS, Villeurbanne, France
Synopsis
Keywords: Elastography, Contrast Mechanisms, MRE, OC Pulse,Stiffness estimation
Motivation: Preclinical Magnetic Resonance Elastography (MRE) in small animal models offers valuable insights but often requires invasive methods. This study aims to develop non-invasive MRE for small animal liver examinations.
Goal(s): The specific goal is to compare conventional MEG-based MRE with OC-RARE MRE in terms of signal quality and motion encoding.
Approach: A non-invasive MRE setup was created for in vivo mouse liver studies. Both MEG and OC-RARE MRE were tested on four healthy mice.
Results: OC-RARE MRE showed superior Signal-to-Noise Ratios and improved wave visualization. Notable standard deviations highlight challenges. Nevertheless, OC-RARE MRE holds promise for small animal MRE research advancement.
Impact: hese results underscore a novel wave motion encoding strategy, offering substantial benefits for short T2 tissue studies, potentially reducing high technical error rates and fostering MRE's broader clinical application.
Introduction
Magnetic Resonance Elastography (MRE) is a non-invasive method used to assess tissue stiffness, particularly in conditions like liver fibrosis[1],[2]. Few studies have addressed pre-clinical MRE, despite mice and rats serving as useful models for disease pathophysiology and therapy response monitoring. For the liver, obtaining wave propagation is challenging, often necessitating invasive methods like in-situ needle insertion to induce adequate displacement for motion encoding gradients (MEG) employed. These methods are effective at the expense of damaging the organ under investigation[3],[4].Recently, Optimal Control MRE has been proposed as an alternative to the traditional MEG MRE sequence[5] with the advantage of yielding better motion encoding, phase and Signal-to-Noise Ratio (SNR)[6].
In this work, a non-invasive MRE bench was developed for in vivo mouse liver MRE examinations (Figure 1). MRE acquisitions were carried out using a Turbo Spin Echo (RARE) MEG MRE sequence and an optimal control-based RF pulse RARE sequence on four healthy mice so as to test the performance of the bench and optimal control approaches with respect to MEG-based ones in an in vivo context.
Methods
In this study, four healthy female mice (25g) were examined after receiving ethical approval and adhering to institutional animal care guidelines. During experiments, mice were anesthetized with a 2% isoflurane/air/oxygen mixture through a nose cone, with continuous monitoring of their respiratory rate. Body temperature was maintained using a heated pad, and the animals were positioned prone. Acquisitions occurred on two separate days, with one mouse examined on both days to assess test-retest reproducibility in data acquisition and processing.Conventional RARE MRE (MEG-MRE) and Optimal Control RARE MRE (OC-MRE) sequences were carried out and compared. In OC-MRE, the optimized RF pulses are concomitantly applied with a constant gradient G for achieving slice selectivity[7],[8], while a shear wave, characterized by amplitude A and frequency f, induces periodic variations in the static magnetic field. To compare both sequences, the OC algorithm was adapted to the experimental parameters (T2 of mice liver, displacement…) generating an OC-pulse. Optimization parameters were: T2= 2ms, gradient amplitude= 164mT/m, motion amplitude=6.5µm, slice thickness= 1mm, RF pulse amplitude= 93,45µT.
MRE acquisitions were carried out using a 7Tesla MRI system (Bruker BioSpec), a 40mm quadrature volume coil, and motion induced by a CEDRAT Technologies piezoelectric actuator at an excitation frequency of 600Hz. Acquisition parameters are detailed in Table 1. Two acquisitions with MEG polarity opposed were acquired for phase images subtraction and removal of static phase offsets.
Complex images were processed to obtain phase images. Images acquired in both positive and negative polarity were subtracted and then unwrapped from which displacement fields were calculated. Displacement fields were Temporal Fourier transformed along the phase offsets direction to isolate the information at the desired frequency. Directional filtering along the wave propagation direction followed by a 4th order 2D Butterworth spatial bandpass filter were applied to reduce low and high-frequency noise. Finally, inversion of the wave equation using the Algebraic Inversion of the Differential Equation algorithm produced shear modulus (G') maps (Figure 2, Table 2). Average and standard deviation values were computed on manually traced ROIs in the liver. G’ values obtained with the MEG-MRE and the OC-MRE sequences for all mice are summarized in table 2.
To assess and compare signal acquisition quality between the two sequences, SNR was calculated. This key metric evaluated the ratio of average pixel intensity within the region of interest to noise standard deviation, serving as an acquisition data quality indicator.
Results
Obtained magnitude, phase wave images and stiffness maps are shown in Figure 2 for each sequence. Additionally, Figure 3 displays magnitude images along with the ROIs used for SNR calculations given in Table 2. It is worth noting that the OC-MRE sequence yielded significantly higher SNR compared to the conventional method.Table 2 regroups the SNR-values and shear modulus values and their respective standard deviations for each mouse and both sequences.
Conclusion
Shear modulus values from the OC-MRE closely matched those from the conventional sequence, validating the ability of OC pulses to assess the viscoelastic properties of liver in vivo for the first time. Figure 3 demonstrates improved wave propagation visualization with this approach. Furthermore, the OC-MRE sequence shows significantly higher SNR across all mice, affirming its superior signal quality performance. Notably, the Omega mouse consistently produced results in two separate experiments, validating the measurement method's repeatability. Standard deviations remain quite high for both methods, reflecting the challenges of non-invasive in vivo MRE experiments, which will be addressed in future works.Acknowledgements
This work was performed within the scope of LABEX PRIMES (ANR-11-LABX-0063) and PIONEER (ANR-22-CE19-0023-01). Experiments were performed on the PILoT facility, part of the France Life Imaging infrastructure (ANR-11-INBS-0006).
References
[1] S. K. Venkatesh et R. L. Ehman, « Magnetic Resonance Elastography of Liver », Magn. Reson. Imaging Clin. N. Am., vol. 22, no 3, p. 433‑446, août 2014, doi: 10.1016/j.mric.2014.05.001.
[2] S. Hoodeshenas, M. Yin, et S. K. Venkatesh, « Magnetic Resonance Elastography of Liver: Current Update », Top. Magn. Reson. Imaging, vol. 27, no 5, p. 319‑333, oct. 2018, doi: 10.1097/RMR.0000000000000177.
[3] J. Chen et al., « Multiparametric magnetic resonance imaging/magnetic resonance elastography assesses progression and regression of steatosis, inflammation, and fibrosis in alcohol‐associated liver disease », Alcohol. Clin. Exp. Res., vol. 45, no 10, p. 2103‑2117, oct. 2021, doi: 10.1111/acer.14699.
[4] H. Tang et al., « Evaluation of a PEGylated Fibroblast Growth Factor 21 Variant Using Novel Preclinical Magnetic Resonance Imaging and Magnetic Resonance Elastography in a Mouse Model of Nonalcoholic Steatohepatitis », J. Magn. Reson. Imaging, vol. 56, no 3, p. 712‑724, sept. 2022, doi: 10.1002/jmri.28077.
[5] S. Hirsch, J. Braun, et I. Sack, « Magnetic Resonance Elastography ».
[6] P. M. Lefebvre et al., « Active control of the spatial MRI phase distribution with optimal control theory », J. Magn. Reson., vol. 281, p. 82‑93, août 2017, doi: 10.1016/j.jmr.2017.05.008.
[7] P. S. Solanas et K. Tse-Ve-Koon, « Ultra-short echo time Magnetic Resonance Elastography ».
[8] E. Van Reeth et al., « Constant gradient elastography with optimal control RF pulses », J. Magn. Reson., vol. 294, p. 153‑161, sept. 2018, doi: 10.1016/j.jmr.2018.07.013.
Figures
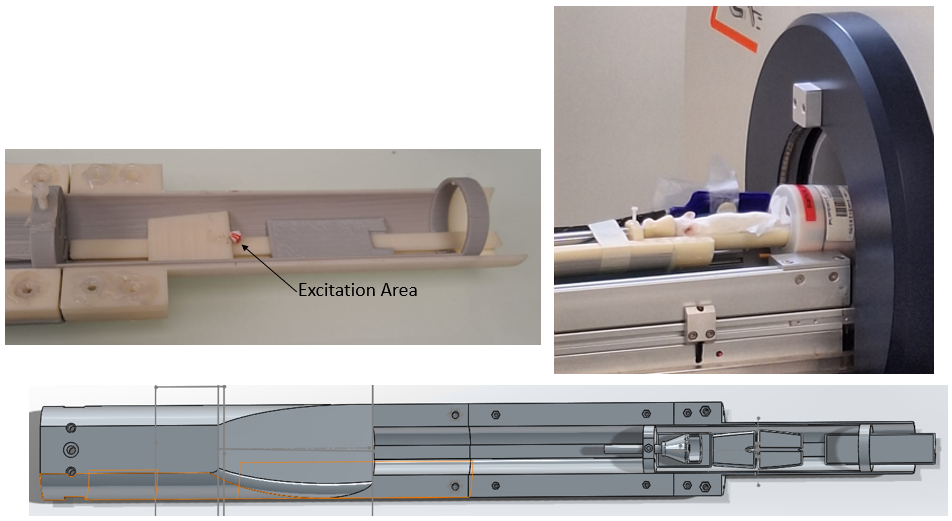
Figure 1: Presentation of the bench created for conducting non-invasive in vivo ERM acquisitions along with its design plan.
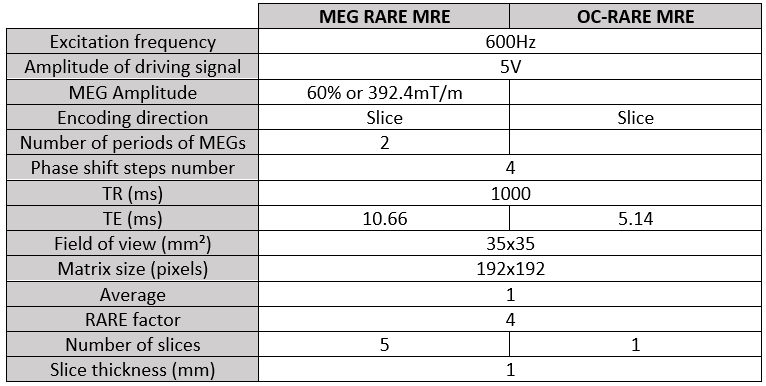
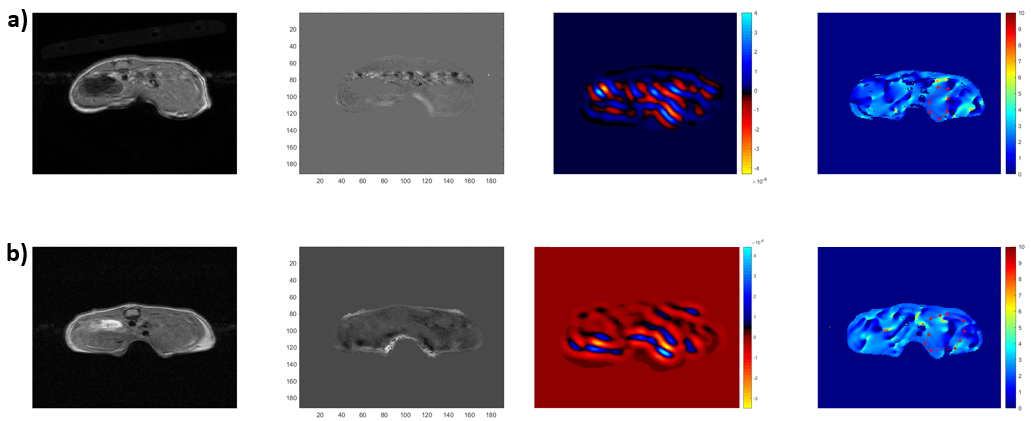
Figure 2: a) Summary of image reconstruction for the MEG-MRE (top line) and OC-MRE (bottom line) sequences. From left to right columns: magnitude, phase, wave images, and stiffness maps.
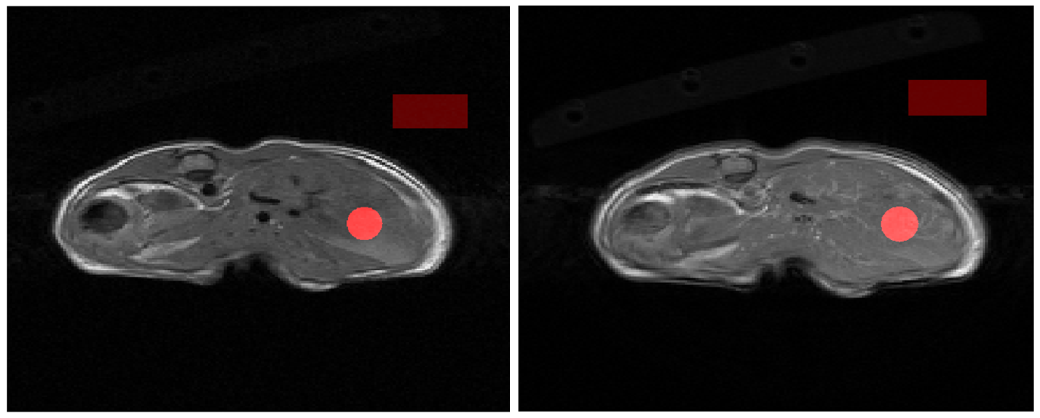
Figure 3: Magnitude images obtained with both sequences: OC-MRE sequence (right) and MEG-MRE sequence (left). ROIs used for signal-to-noise ratio calculations are displayed on the images.
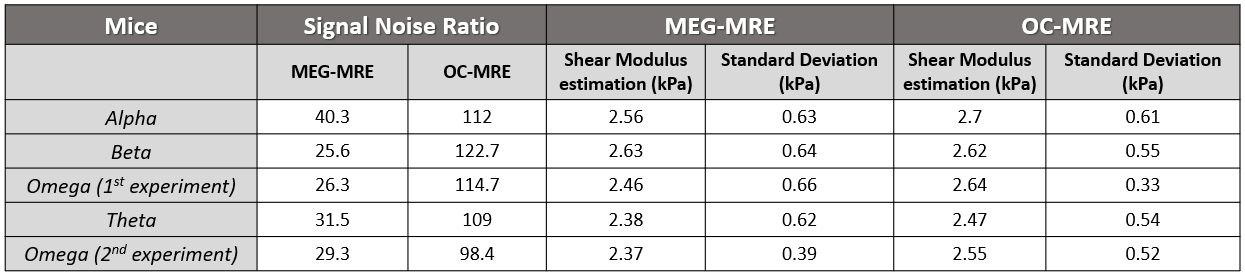
Table 2: Summary of results obtained on the4 mice with one (Omega) undergoing two examinations.