4797
Comparison of 2D and 3D MRE Performance in Prediction of MASLD-Associated Risk Factors1Mayo Clinic, Rochester, MN, United States, 2Resoundant, Inc., Rochester, MN, United States, 3Radiology, Mayo Clinic, Rochester, MN, United States, 4Radiology, UC San Diego, La Jolla, CA, United States, 5Gastroenterology and Hepatology, UC San Diego, La Jolla, CA, United States, 6Gastroenterology and Hepatology, Mayo Clinic, Rochester, MN, United States
Synopsis
Keywords: Elastography, Elastography, diagnosis/prediction, machine learning
Motivation: Pathology of steatotic liver disease is characterized by fat burden, inflammation, and ballooning. Mechanical properties of tissue acquire by 2D-MRE has improved the detection of this disease. However, 3D-MRE, an improvement over 2D-MRE is not widely adopted by clinicians.
Goal(s): We aimed to compare the predictive capabilities of these two in risk factors associated with this disease using machine learning to help motivate clinicians to use 3D-MRE.
Approach: Use machine learning to determine the predictive capabilities of 2D-MRE and 3D-MRE.
Results: Results showed 3D-MRE best predicts steatohepatitis, inflammation, and ballooning.
Impact: The demonstrated predictive value of 3D-MRE in identifying those with certain risk factors allows clinicians to better plan treatment for patients with steatotic liver disease.
Introduction
Metabolic-associated steatotic liver disease (MASLD), a.k.a. nonalcoholic fatty liver disease, is estimated to affect 25% of adults in the United States1. Pathologically, MASLD begins with simple steatosis. As steatosis worsens, mild inflammation appears in the affected area. Moreover, about 20% of adults with MASLD develop a more severe form whereby inflammation worsens, and cellular injury (ballooning) is present; this form is known as steatohepatitis (MASH) and leads to fibrous molecules, causing fibrosis and ultimately cirrhosis1. Markedly higher rates of mortality exist in MASH patients with at least fibrosis stage 2 (high-risk MASH), making it a crucial progression to detect, informing clinical management. Fat burden is accurately estimated by proton-density fat fraction (PDFF) in magnetic resonance imaging (MRI), making it a sensitive biomarker for steatosis2. Elastographic, quantitative markers in MRI like shear stiffness and storage modulus- related to tissue elasticity- have been shown to be predictive of fibrosis severity3. Additionally, tissue viscosity measured by loss modulus and damping ratio has shown sensitivity to inflammation grade. In clinical practice, two-dimensional (2D) sampling of tissue displacement in magnetic resonance elastography (2D-MRE) is widely used to diagnose hepatic fibrosis. However, three-dimensional (3D) MRE (3D-MRE), which provides a more accurate measure of stiffness4, in addition to other mechanical descriptors5, is not widely adopted by clinicians. To showcase the effectiveness of 3D-MRE in diagnosing risk factors in MASLD, this study compares the performance of 2D-MRE and 3D-MRE in predicting MASH, high-risk MASH, inflammation grade 1 and above, as well as ballooning grade 1 and above.Methods
We pooled three prospective clinical studies across two medical centers in 334 biopsy-proven MASLD patients who had baseline 2D and 3D-MRE as well as PDFF-MRI performed. Imaging parameters were extracted from three series that comprised of 6-point Dixon MRI, 2D, and 3D-MRE at 60Hz. From 3D-MRE exams: shear stiffness (SS3), shear modulus (Gd), loss modulus (Gi) and damping ratio (DR) were calculated. Shear stiffness from 2D-MRE was also derived (SS2). Since steatosis is a characteristic of MASLD, PDFF was also calculated from 6-point Dixon MRI. Occurrence of MASH and fibrosis stage greater than 1 (HRM), along with MASH diagnosis (Yes/No), inflammation grade greater than 0 (INF>=1), and ballooning grade greater than 0 (BAL>=1) were targeted as four different binary outcomes for our multivariate logistic regression models. We applied leave-one-out cross-validation for all models using 6 imaging predictors and their different combinations. Model performances (i.e., area under the curve (AUC)) were recorded where specificity was ≥ 90%, sensitivity was ≥ 90%, negative predictive value (NPV) ≥ 75% and positive predictive value (PPV) ≥ 75%. The best performing models and those that did well with fewer predictors were selected from the four constraints results.Results
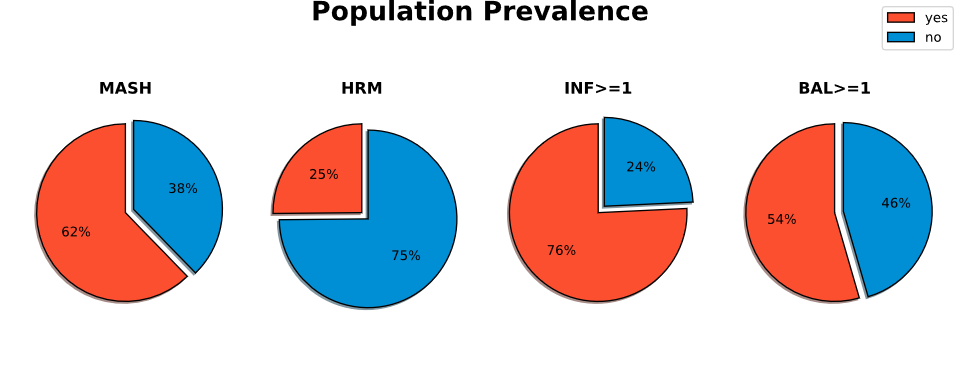
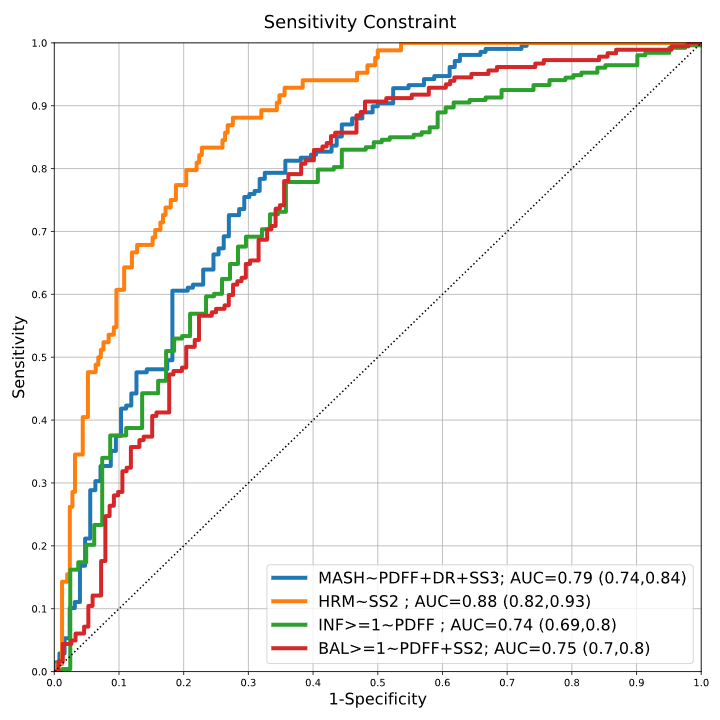
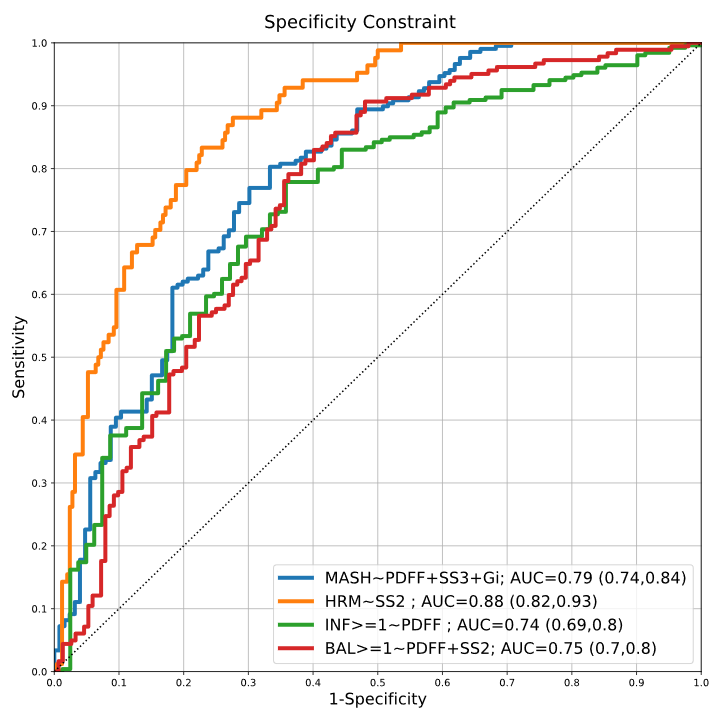
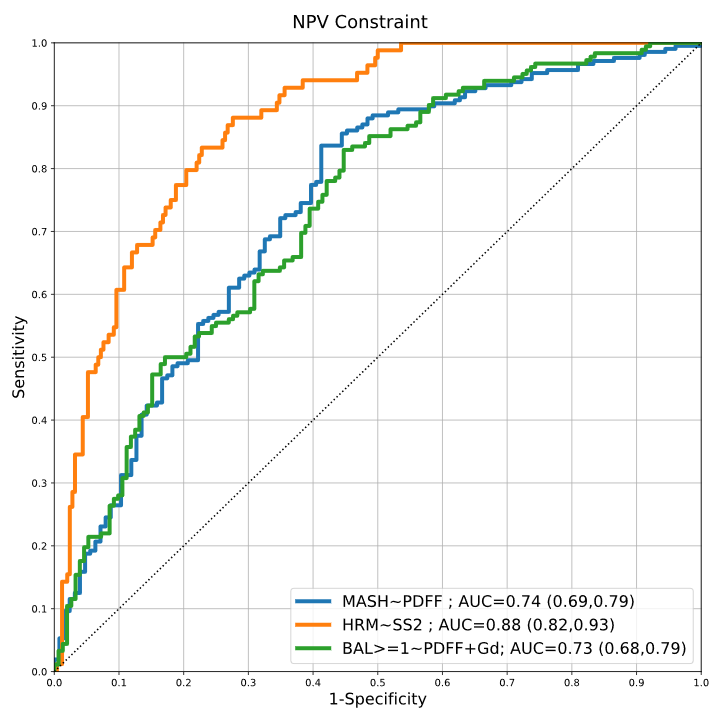
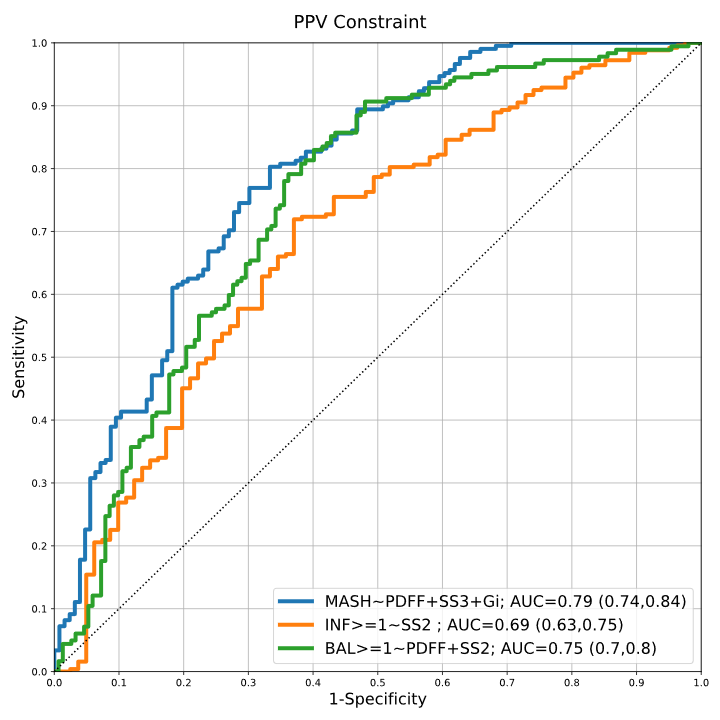
Of our population size, about 62% (207) were diagnosed with MASH, 25% (83) presented with a positive HRM diagnosis, 76% (259) had INF>=1, and 54% (180) had BAL>=1 (Figure 1). When constraining model performance for high sensitivity (Figure 2), prediction of HRM and BAL>=1 required SS2 + PDFF [AUC=0.87 (0.82, 0.93), AUC=0.75 (0.7, 0.8)]. Predicting MASH and INF>=1 showed PDFF and a mixture of 3D-MRE measures to be sufficient models. For the high specificity model performances, SS2 alone provided sufficient accuracy for predicting HRM (Figure 3). However, MASH, BAL>=1, and INF>=1 predictions, PDFF + 3D-MRE showed the best performance. From Figure 4 it appears SS2 alone is necessary for HRM diagnosis when NPV is a constraint on performance. Predictions of MASH and BAL>=1 showed PDFF + 3D-MRE had the best performance. Figure 5 shows that PDFF + SS2 predicts BAL>=1 when PPV is a constraint on performance. It also shows that 3D-MRE alone is adequate when diagnosing for INF>=1, though in conjunction with PDFF it also best predicts MASH.Discussion
Identification of fibrosis and inflammation by 3D-MRE is shown in clinical and preclinical6 studies and they support the findings of this retrospective study. 3D-MRE in conjunction with PDFF was consistently the best performing model when diagnosing MASH, signifying how well both characterize fat burden, fibrosis, and inflammation in the pathology. Its AUC also remained consistent under the constraints, making PDFF+3D-MRE an excellent biomarker for advising clinical management and clinical trial recruitment. When diagnosing INF>=1 and BAL>=1, specificity, sensitivity, and NPV constraints also showed PDFF+3D-MRE to be the best model. However, under PPV, 2D-MRE with PDFF proved superior. HRM predictions showed 2D-MRE performed best, however, 2D-MRE is prone to over-estimation in fibrotic livers and may increase false positives7. In NPV and PPV, we found that the models performed poorly when diagnosing INF>=1 and HRM, those models were not included here.Acknowledgements
This study is funded by NIH grants EB017197 (M.Y.), EB001981(R.L.E.), DK115594 (A.M.A.), and DoD grant W81XWH-19-1-0583-01 (M.Y.).References
1 Rinella, M. E. et al. AASLD Practice Guidance on the clinical assessment and management of nonalcoholic fatty liver disease. Hepatology 77, 1797-1835, doi:10.1097/hep.0000000000000323 (2023).
2 Starekova, J. & Reeder, S. B. Liver fat quantification: where do we stand? Abdominal Radiology 45, 3386-3399, doi:10.1007/s00261-020-02783-1 (2020).
3 Reeder, S. B. Emergence of 3D MR Elastography–based Quantitative Markers for Diffuse Liver Disease. Radiology 301, 163-165, doi:10.1148/radiol.2021211444 (2021).
4 Yin, M. et al. Hepatic and splenic stiffness augmentation assessed with MR elastography in an in vivo porcine portal hypertension model. Journal of Magnetic Resonance Imaging 38, 809-815, doi:https://doi.org/10.1002/jmri.24049 (2013).
5 Shi, Y. et al. Three-dimensional MR Elastography Depicts Liver Inflammation, Fibrosis, and Portal Hypertension in Chronic Hepatitis B or C. Radiology 301, 154-162, doi:10.1148/radiol.2021202804 (2021).
6 Li, J. et al. Quantitative assessment of portal hypertension with bi-parametric dual-frequency hepatic MR elastography in mouse models. European Radiology 31, 2303-2311, doi:10.1007/s00330-020-07341-3 (2021).
7 Yin, M., Rouvière, O., Glaser, K. J. & Ehman, R. L. Diffraction-biased shear wave fields generated with longitudinal magnetic resonance elastography drivers. Magnetic Resonance Imaging 26, 770-780, doi:https://doi.org/10.1016/j.mri.2008.01.019 (2008).
Figures