4795
Virtual MR elastography based on IVIM for assessment of tumor, node and prognostic stage in rectal cancer: compared with real MR elastography1Department of Radiology, Xiangya Hospital, Central South University, Changsha, China, 2MR Research Collaboration, Siemens Healthineers, Shanghai, China
Synopsis
Keywords: Elastography, Contrast Mechanisms
Motivation: It is not widely available to real MR elastography (r-MRE) for clinical because of external elastography equipment.
Goal(s): To assess the staging value of virtual MR elastography (v-MRE) preoperatively in rectal adenocarcinoma (RA).
Approach: Relationship between shift ADC (sADC) from IVIM and real shear-wave speed (Cr-MRE), inversion of the equation for generating virtual shear-wave speed (Cv-MRE), and assessment of pathological stages in RA patients.
Results: In diagnosing T, N and P stage, the virtual MR elastography has potential to replace real MR elastography.
Impact: This study overcomes the shortcomings of real MR elastography and facilitates MR elastography to be used in clinical practice.
INTRODUCTION
Real MR elastography (r-MRE) is used much less in the rectum than in the liver probably due to the external elastography equipment1,2. To solve this dilemmachallenge, some studies suggested that Intravoxel Incoherent Motion imaging (IVIM)-based virtual elastography (v-MRE) could been used as an alternative to r-MRE for the staging assessment of liver fibrosis, using the relationship between shifted apparent diffusion coefficient (sADC) and tissue stiffness3,4. However, the existence of a relationship between water diffusivity and tissue stiffness remains unclear in rectal adenocarcinoma (RA). Our aim was to (1) explore the optimal combination of b-values for v-MRE based on IVIM images in RA tissue; (2) investigate the feasibility of v-MRE based on IVIM images for preoperatively assessing the tumor (T), node (N) and prognostic (P) stage in RA with comparison of r-MRE.METHODS
Patient recruitment: The study was approved by local institutional ethics committee, and written informed consent was obtained from all patients. A total of 50 RA patients (mean age, 61 years ± 10 [standard deviation], 58% males) were prospectively enrolled with IVIM and r-MRE scans before surgery.MRI study: All images were acquired on a 3T MRI scanner (MAGNETOM Prisma, Siemens Healthineers, Erlangen, Germany). IVIM images were acquired with a single-shot echoplanar imaging (TR = 3700.0 ms; TE = 50.0 ms; FOV = 380×380 mm; image matrix = 164×164; voxel size = 1.2×1.2×3.0 mm3; b = 0, 30, 60, 100, 150, 200, 500, 1000, 1500 and 2000 sec/mm2; acquisition time = 5 min). r-MRE images were acquired with a 3D single-shot spin-echo echoplanar imaging along three motion-encoding directions (TR = 1670.0 ms; TE =56.0 ms; FOV = 300×300 mm; image matrix = 100×100; voxel size =3.0×3.0×3.0 mm3; acquisition time = 3 min 7 sec). v-MRE map was generated through research post-processing software using IVIM images.
Histopathology: 30 RA patients with direct surgical were staged by two specialized pathologists using the TNM classification system (8th edition) recommended by the American Joint Committee on Cancer (AJCC).
Data analysis: For r-MRE, real shear-wave speed (Cr-MRE) was measured on the maximum tumor level in each RA patient. For IVIM, sADC of the multiple b-value combinations was measured manually using the above methods in 20 RA patients,$$$sADC_{b1-2} (mm^2/s)=(b_2-b_1)\times\ln{(S_{b1}/S_{b2})}$$$. The optimal combination of b-values was determined by the best correlation between Cr-MRE and sADC, which decided the virtual shear-wave speed (Cv-MRE) with an equation. Then, Cv-MRE was measured on the software-generated v-MRE maps by two experienced radiologists and assessed for inter-reader agreement in 30 RA patients. Differences in the Cv-MRE were assessed between tumor (T1-2 vs T3-4), node (N- vs N+) and prognostic (P0-I vs PII-IV) stage by using the independent t-test. The diagnostic performance of Cv-MRE was compared with Cr-MRE for distinguishing T, N and P stage using the area under the curve (AUC). P < 0.05 was regarded as statistically significant.
RESULTS
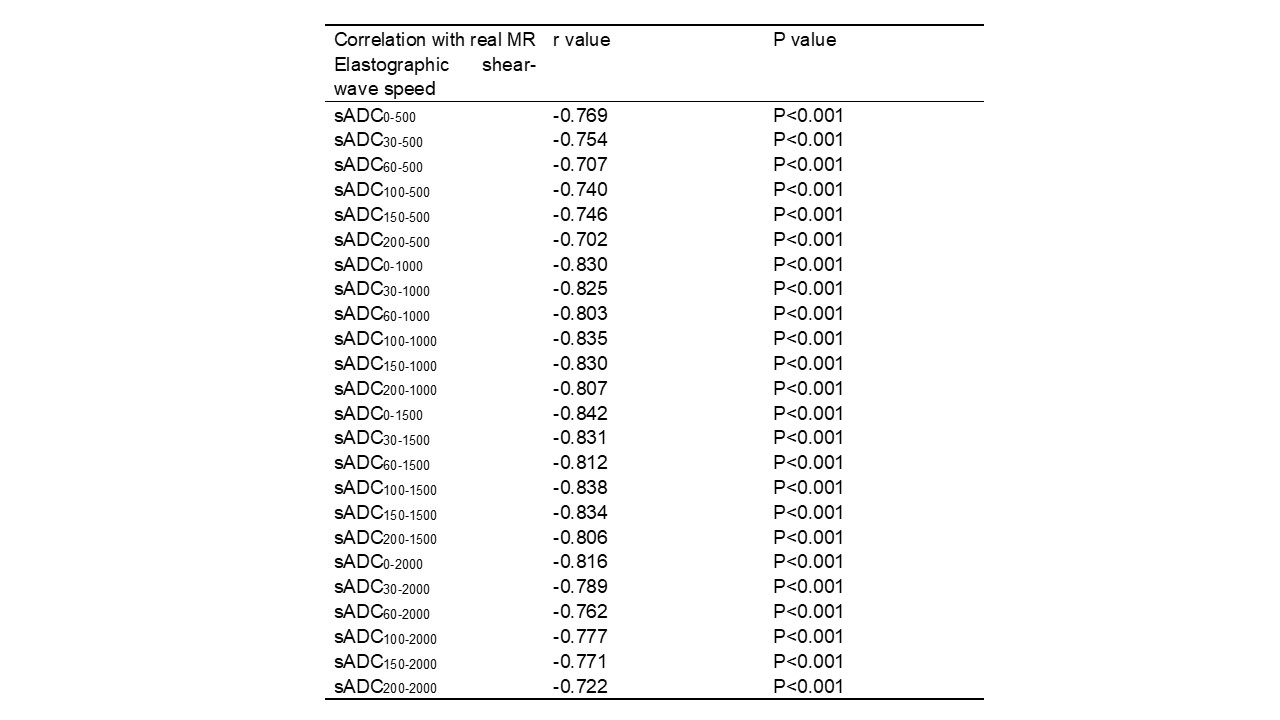
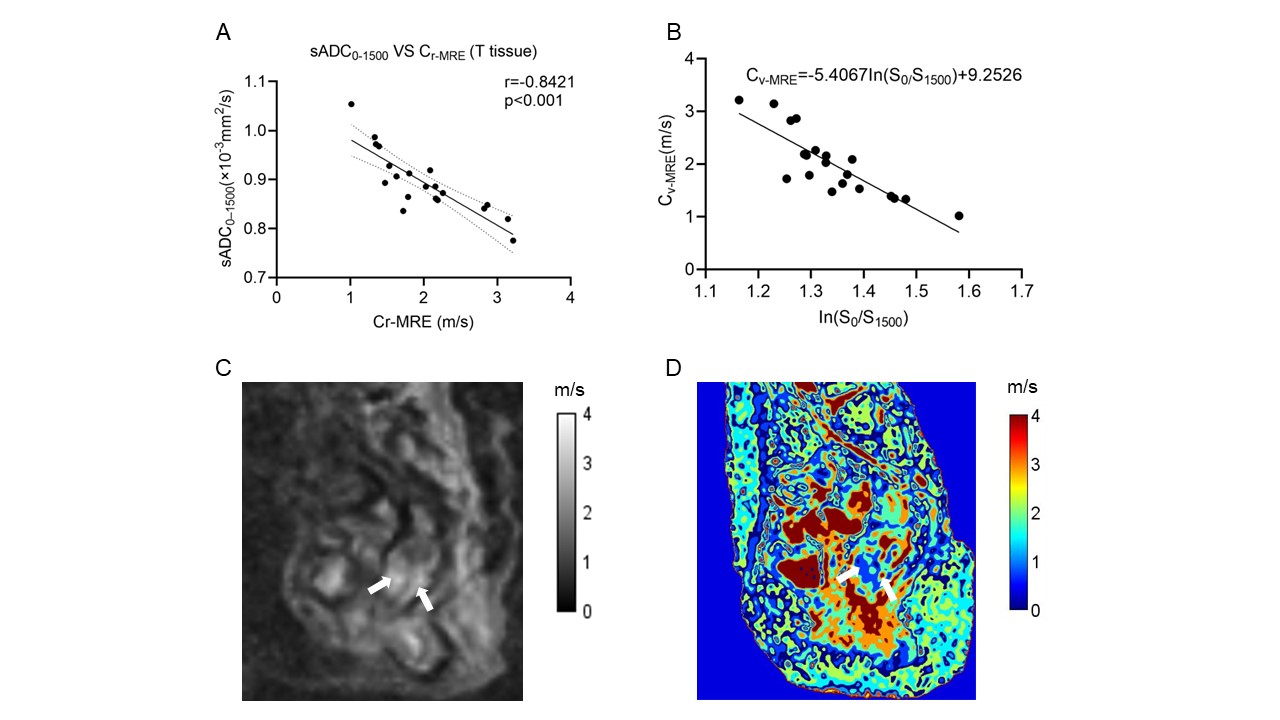
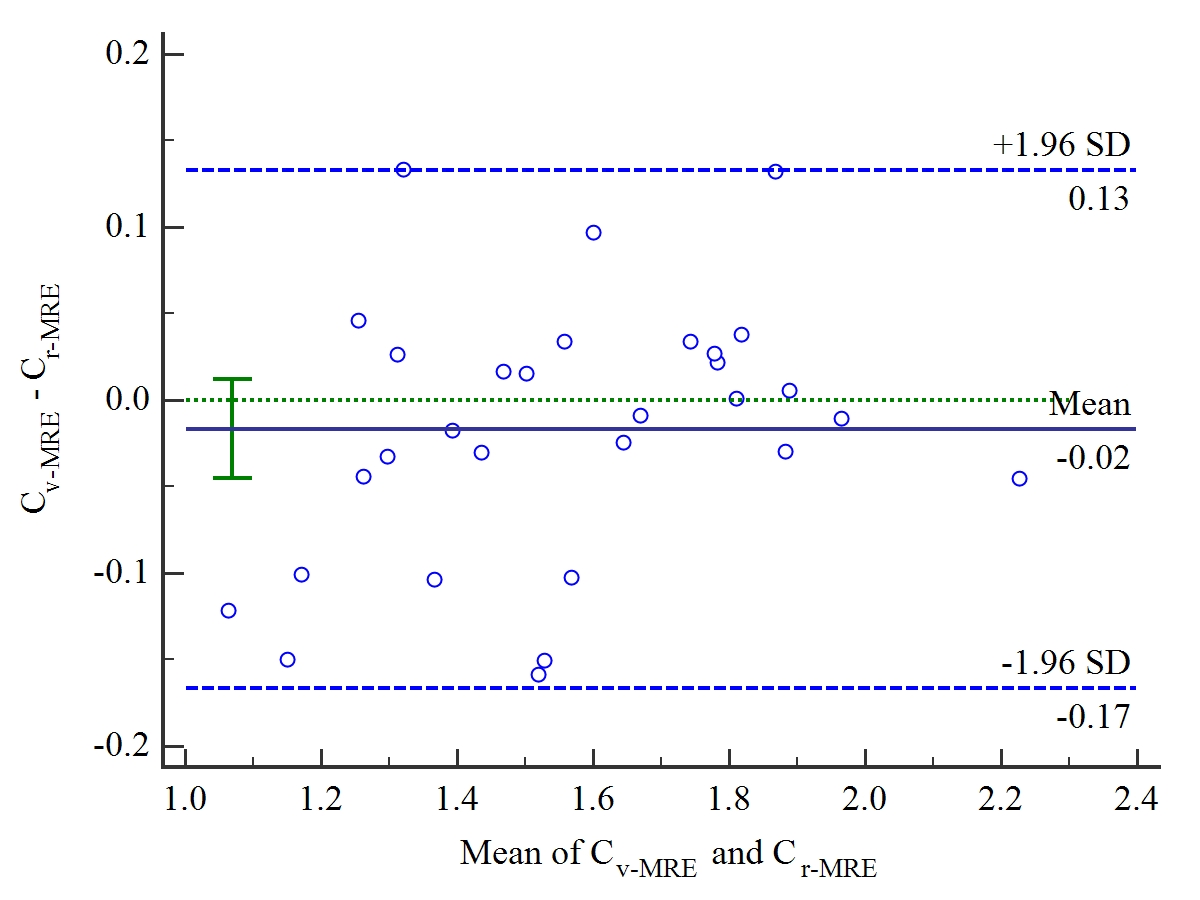
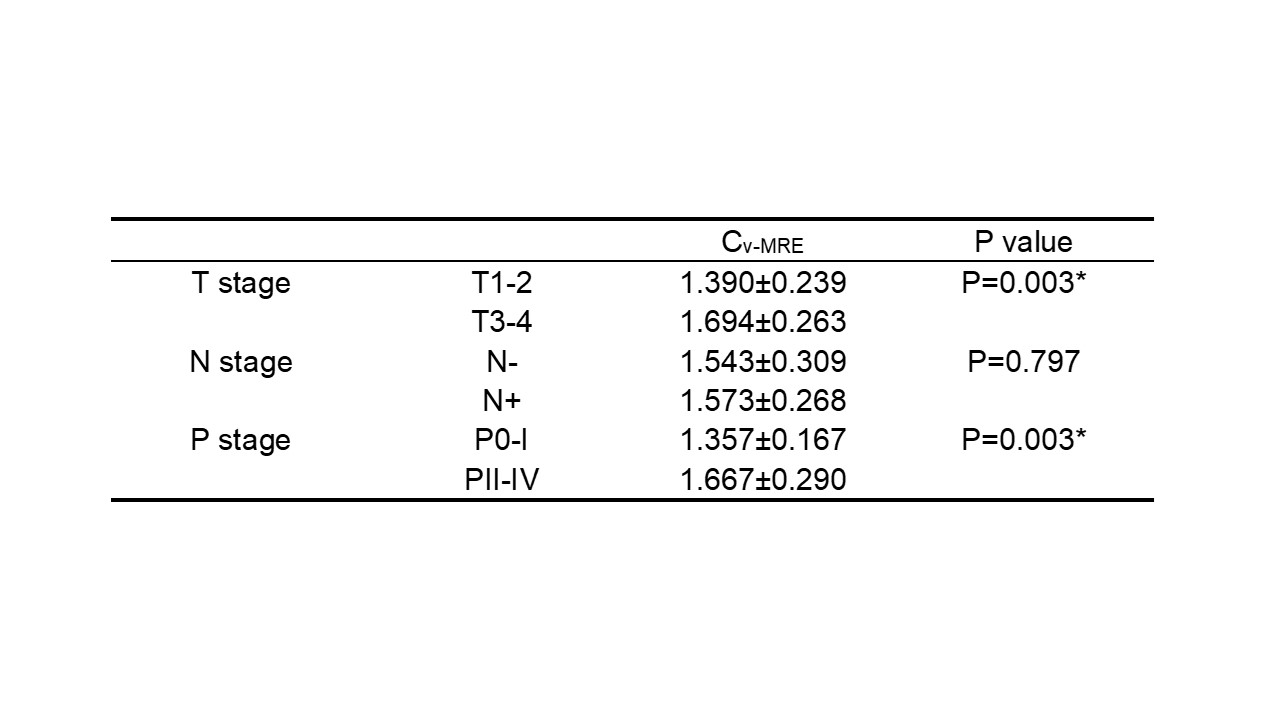
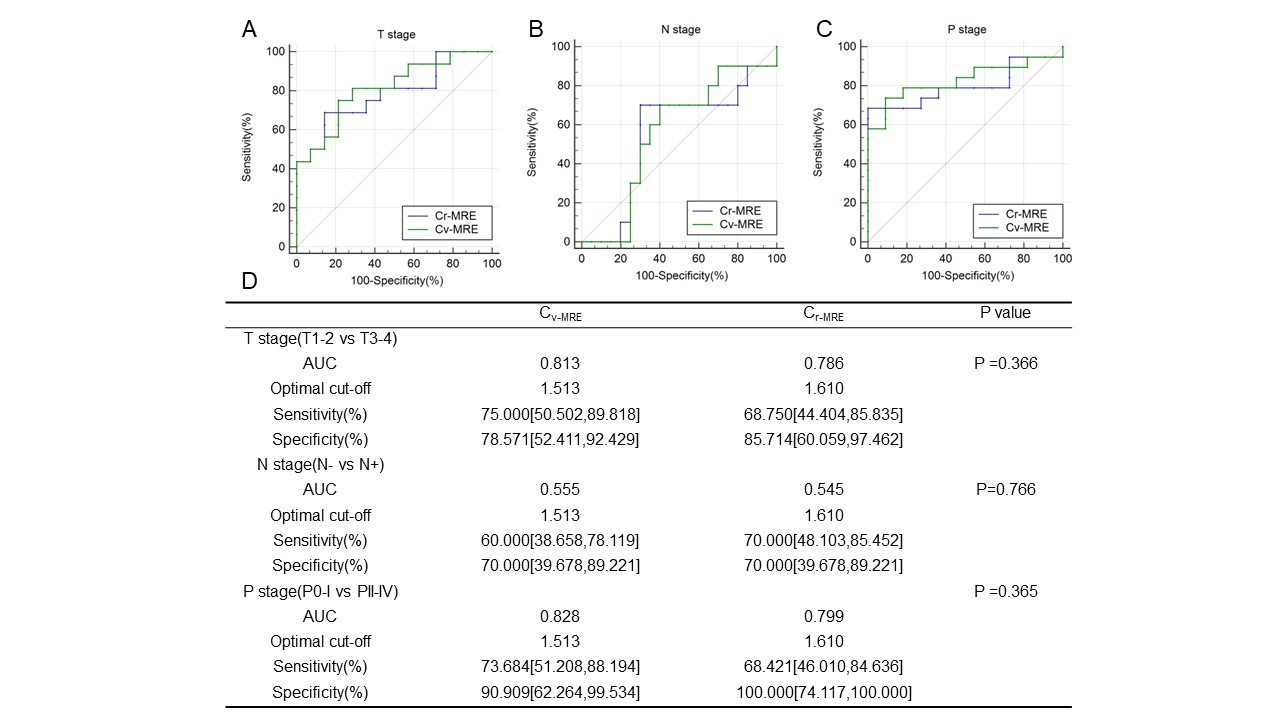
The optimal combination of b-values (0 and 1500 sec/mm2)was determined with the best relation between Cr-MRE and sADC (|r| = 0.842, P = < 0.001) (Table 1, Figure 1A) and then gained $$$C_{v-MRE}=(-5.4067\pm1.1714)\times\ln{(S_0/S_{1500})}+(9.2526\pm2.3056)$$$ (Figure 1B). Figure 1C, D shows an image example from a patient. Figure 2 shows that good consistency between Cv-MRE and Cr-MRE. Inter-reader agreement for Cv-MRE was high (P <0.05). Significant differences of Cv-MRE were observed in T and P stage (all P < 0.05) exception of N stage (P > 0.05) (Table 2). The Cv-MRE for the T1-2 group were substantially lower than that of the T3-4 group. The Cv-MRE for the P0-I group were substantially lower than that of the PII-IV group. The diagnostic performance of Cv-MRE was similar to Cr-MRE in the differentiation of T (AUC: 0.813 vs 0.786; P > 0.05), N (AUC: 0.555 vs 0.545; P > 0.05) and P stage (AUC: 0.828 vs 0.799; P > 0.05) in RA patients (Figure 3).DISCUSSION
This was a preliminary feasibility study of v-MRE for the preoperative assessment of tumor, node and prognostic stage in RA. The correlation analysis revealed the possibility of simulating v-MRE without an elastography equipment using IVIM. The results suggest that the quantitative Cv-MRE can be used to differentiate T and P stage. In T, N and P stage, the v-MRE images demonstrated comparable diagnostic performance to the r-MRE.CONCLUSION
The optimal combination of b-values (0 and 1500 sec/mm2) can be simulated v-MRE and Cv-MRE based on IVIM has an analogously diagnostic performance with Cr-MRE, which can be used to replace r-MRE in RA patients.Acknowledgements
This work was supported by the National Natural Science Foundation of China (grant number 82271984). We thank the MR Research Collaboration of Siemens Healthineers for technical support.
References
1 Yin, M. & Ehman, R. L. MR Elastography: Practical Questions, From the AJR Special Series on Imaging of Fibrosis. AJR Am J Roentgenol, doi:10.2214/AJR.23.29437 (2023).
2 Hu, J. et al. Rectal Tumor Stiffness Quantified by In Vivo Tomoelastography and Collagen Content Estimated by Histopathology Predict Tumor Aggressiveness. Front Oncol 11, 701336, doi:10.3389/fonc.2021.701336 (2021).
3 Le Bihan, D., Ichikawa, S. & Motosugi, U. Diffusion and Intravoxel Incoherent Motion MR Imaging-based Virtual Elastography: A Hypothesis-generating Study in the Liver. Radiology 285, 609-619, doi:10.1148/radiol.2017170025 (2017).
4 Kromrey, M. L., Le Bihan, D., Ichikawa, S. & Motosugi, U. Diffusion-weighted MRI-based Virtual Elastography for the Assessment of Liver Fibrosis. Radiology 295, 127-135, doi:10.1148/radiol.2020191498 (2020).
Figures