4793
Application of MR elastography (MRE) to measure oral posture related changes in the stiffness of the zygomaticus major muscle1University of Edinburgh, Edinburgh, United Kingdom, 2Radiology, Mayo Clinic, Rochester, MN, United States
Synopsis
Keywords: Elastography, Elastography, muscle stiffness, oral posture, phase gradient technique, Zygomaticus major
Motivation: The MR elastography (MRE) phase-gradient (PG) technique allows measurement of tissue stiffness for small structures.
Goal(s): To use the PG technique to measure oral postural related changes in stiffness of the zygomaticus major (ZM) muscle in a small cohort of participants.
Approach: The phase image of the first harmonic of Fourier-transformed, directionally filtered MRE wave images was analysed. The gradient of the change in phase along a 1D-profile drawn in the direction of the long axis of ZM corresponds to the wavenumber and provides a measure of ZM stiffness.
Results: ZM stiffness increased significantly in mouth-open posture compared to mouth-closed posture.
Impact: The feasibility of using the PG technique to measure oral posture related changes in the stiffness of ZM has been demonstrated. The method can potentially be applied to support the development of surgical treatments to rectify impaired oral posture.
Introduction
Development of a non-invasive technique for measuring the mechanical properties of the zygomaticus major (ZM) muscle may aid advances in clinical treatments for correcting abnormal oral posture. Magnetic resonance elastography (MRE) allows measurement of tissue stiffness non-invasively by analyzing the propagation of acoustic-frequency shear waves induced in the muscle1-4 In a previous MRE study the caliper technique was applied to measure ZM stiffness5. A drawback of this approach is that at least half a wavelength of the propagating wave must be well visualised in the muscle to allow measurement of peak-to-trough distance, which can be challenging for the study of small structures5. The MRE phase-gradient (PG) technique6,7 was therefore employed as an alternative approach for the study of small structures8. PG requires simple plane wave propagation to be present6, so a directional filter (DF)9 is applied to the wave images in the principal direction of the muscle fibres. The phase image of the first harmonic of the Fourier transform (FT) of the filtered MRE wave images is then computed and the gradient of the change in phase along a profile of interest (POI) in the muscle, and which corresponds to the shear wavenumber, is recorded and converted to a measurement of stiffness. A pilot study was performed using the PG technique to test the prediction that the stiffness of ZM will be increased when the mouth is opened.Methods
Three healthy volunteers were scanned on a 3T MRI system. A small drum driver (Figure 1a) was placed on the left cheek (Figure 1b-c) and 2D SE-EPI MRE and T2-weighted (T2W) anatomical images were acquired with the mouth closed for an imaging plane anteriorly tilted in an axial-oblique orientation along the long axis of ZM. MRE images were acquired with TR/TE 3200/43ms, FOV 24cm, 80x80 pixel matrix, slice thickness 3 mm, 8 phase offsets and 12 slices. The motion-encoding gradient (MEG) was applied in the slice direction (i.e. perpendicular to the imaging plane) at the vibration frequency of 90 Hz and the T2W images were acquired with TR/TE 5550/117ms and 320x320 pixel matrix. Next, the subject inserted a jawline exerciser (Jawliner, Waltenhofen, Germany) to maintain a consistent mouth-open posture (Figure 1d) and acquisition of both series of images was repeated. Data analysis was performed using MRE-Lab software (Mayo Clinic, USA). Firstly a 2D-DF (fourth-order Butterworth bandpass filter, low- and high-frequency cutoffs of 4 and 40 wave cycles/FOV) was applied to the wave images in the direction of wave propagation along the long axis of ZM. Next, the temporal FT of the filtered wave images was applied and the phase image of the first harmonic selected for analysis. A POI was drawn along the long axis of ZM in the phase image using the corresponding T2W image for reference. A linear curve fitting algorithm was used to determine the gradient of the change in phase along the POI (Figure 2). The gradient corresponds to the wavenumber $$$k$$$ and can be used to calculate wavelength $$$ λ $$$(m) according to the following equation $$$λ$$$(m) $$$=\frac{FOV∙2π}{n∙k}$$$ (where $$$ n $$$ is the number of pixels in the FOV)7. Stiffness $$$μ$$$ (kPa) is then computed according to the equation $$$μ=ρ(λf)^2$$$ (where $$$ρ$$$ is muscle density (~1000 kg/m3), and $$$f$$$ is the frequency of the vibrations produced by the actuator (Hz))1. A one-tailed paired t-test was used for the statistical comparison between stiffness measurements obtained in the mouth-open and mouth-closed postures for the three participants (p<0.05).Results
The application of the PG technique to measure wavenumber $$$k$$$ in both oral postures for the three participants is illustrated in Figure 3. Mean and standard deviation of ZM stiffness for the three participants in the mouth-closed and mouth-open postures was 6.75 ± 3.36 kPa, and 15.5 ± 5.15 kPa, respectively. The mean value of ZM stiffness was significantly greater in the mouth-open than mouth-closed posture (p=0.038).Discussion and Conclusion
The present study is to our knowledge the first time that the MRE PG technique has been applied to investigate muscle function in a cohort of subjects. The feasibility of using the PG technique to measure the stiffness of the small ZM muscle in different oral postures has been demonstrated. The PG technique is sensitive to noise6 so that application of a DF is highly recommended and the effect of this process on measurement reproducibility remains to be investigated. A wide range of applications of this technique potentially exists for the protocol that has been developed, both in clinical practice as well as in refining health and beauty practices and treatments.Acknowledgements
This work was supported by ROHTO Pharmaceutical Co., LTD. 1-8-1, Tatsumi-nishi, Ikunoku, Osaka, 544-8666, Japan.References
1. Bensamoun SF, Ringleb SI, Littrell L, et al. Determination of thigh muscle stiffness using magnetic resonance elastography. J Magn Reson Imaging 2006;23(2):242-247.
2. Chakouch MK, Charleux F, Bensamoun SF. Quantifying the Elastic Property of Nine Thigh Muscles Using Magnetic Resonance Elastography. PLoS One 2015;10(9):e0138873.
3. Ito D, Numano T, Takamoto K, et al. Simultaneous acquisition of magnetic resonance elastography of the supraspinatus and the trapezius muscles. Magn Reson Imaging 2019;57:95-102.
4. Numano T, Habe T, Ito D, et al. A new technique for motion encoding gradient-less MR elastography of the psoas major muscle: A gradient-echo type multi-echo sequence. Magn Reson Imaging 2019;63:85-92.
5. Ternifi R, Pouletaut P, Dakpé S, et al. Development of a new MR elastography protocol to measure the functional properties of facial muscles. Computer Methods in Biomechanics and Biomedical Engineering 2019;22:S317-S319.
6. Manduca A, Oliphant TE, Dresner MA, et al. Magnetic resonance elastography: non-invasive mapping of tissue elasticity. Med Image Anal 2001;5(4):237-254.
7. Ringleb SI, Bensamoun SF, Chen Q, et al. Applications of magnetic resonance elastography to healthy and pathologic skeletal muscle. J Magn Reson Imaging 2007;25(2):301-309.
8. Yin M, Woollard J, Wang X, et al. Quantitative assessment of hepatic fibrosis in an animal model with magnetic resonance elastography. Magn Reson Med 2007;58(2):346-353.
9. Manduca A, Lake DS, Kruse SA, Ehman RL. Spatio-temporal directional filtering for improved inversion of MR elastography images. Med Image Anal 2003;7(4):465-473.
Figures
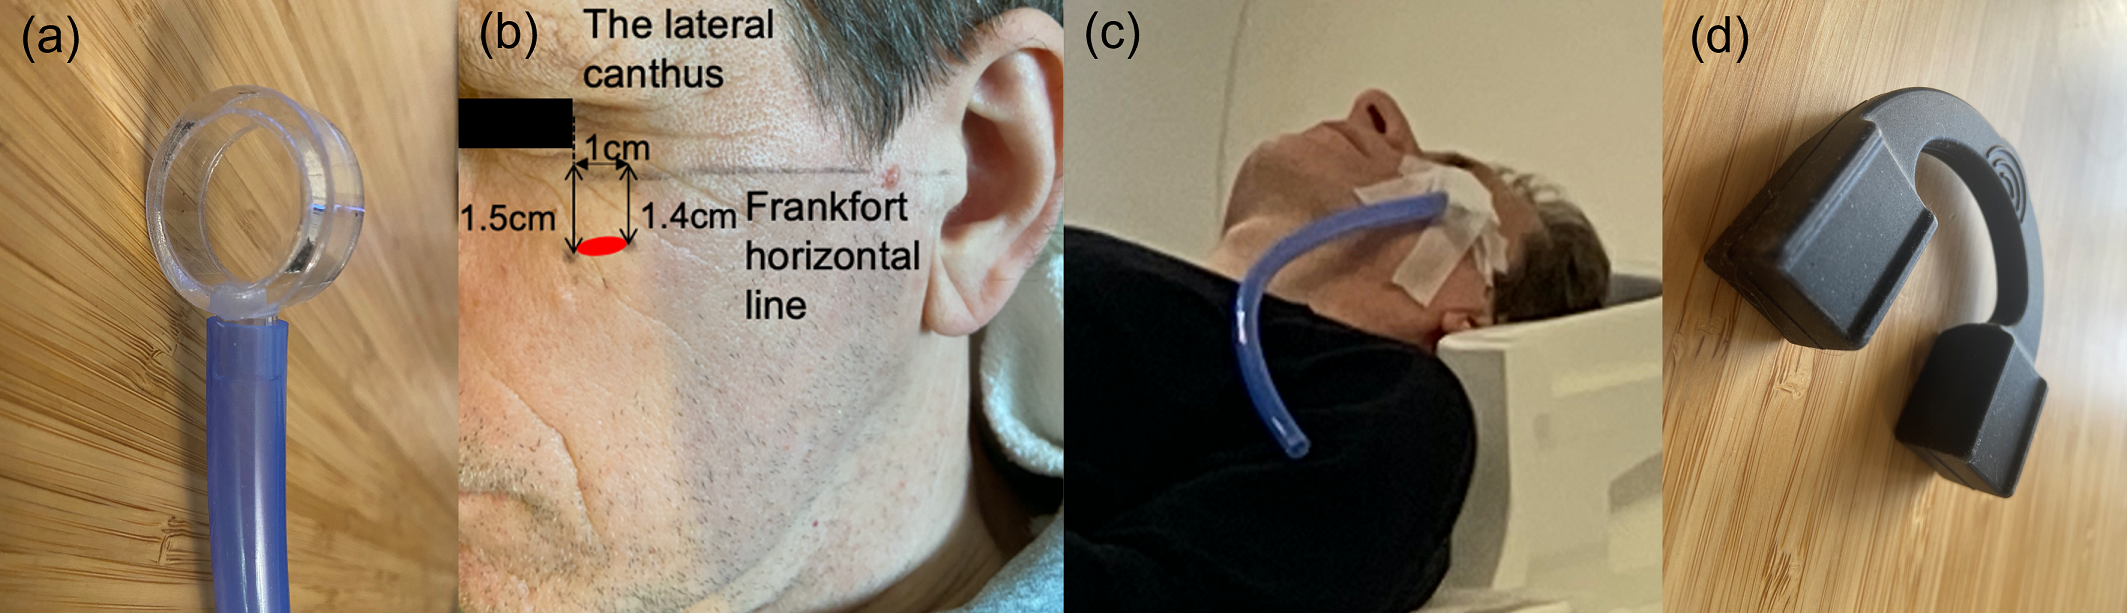
Figure 1: The small drum driver (a) was positioned inferior to the zygomatic arch above the origin of left ZM shown as a red ellipse in (b) and held in place by surgical tape with the subject lying in the supine position (c). A jawline exerciser shown in (d) was used to enable subjects to maintain a comfortable and consistent mouth-open posture.

Figure 2: The T2W MR image together with the POI (red line) is shown in (a). Wave images were viewed to check that waves were propagating in ZM and the region of interest (ROI) is shown overlaid on the T2W image in (b). Next a DF was applied (c) and the phase image corresponding to the first harmonic is shown overlaid on the T2W image in (d). A plot of the change in phase along the POI is shown in (e).
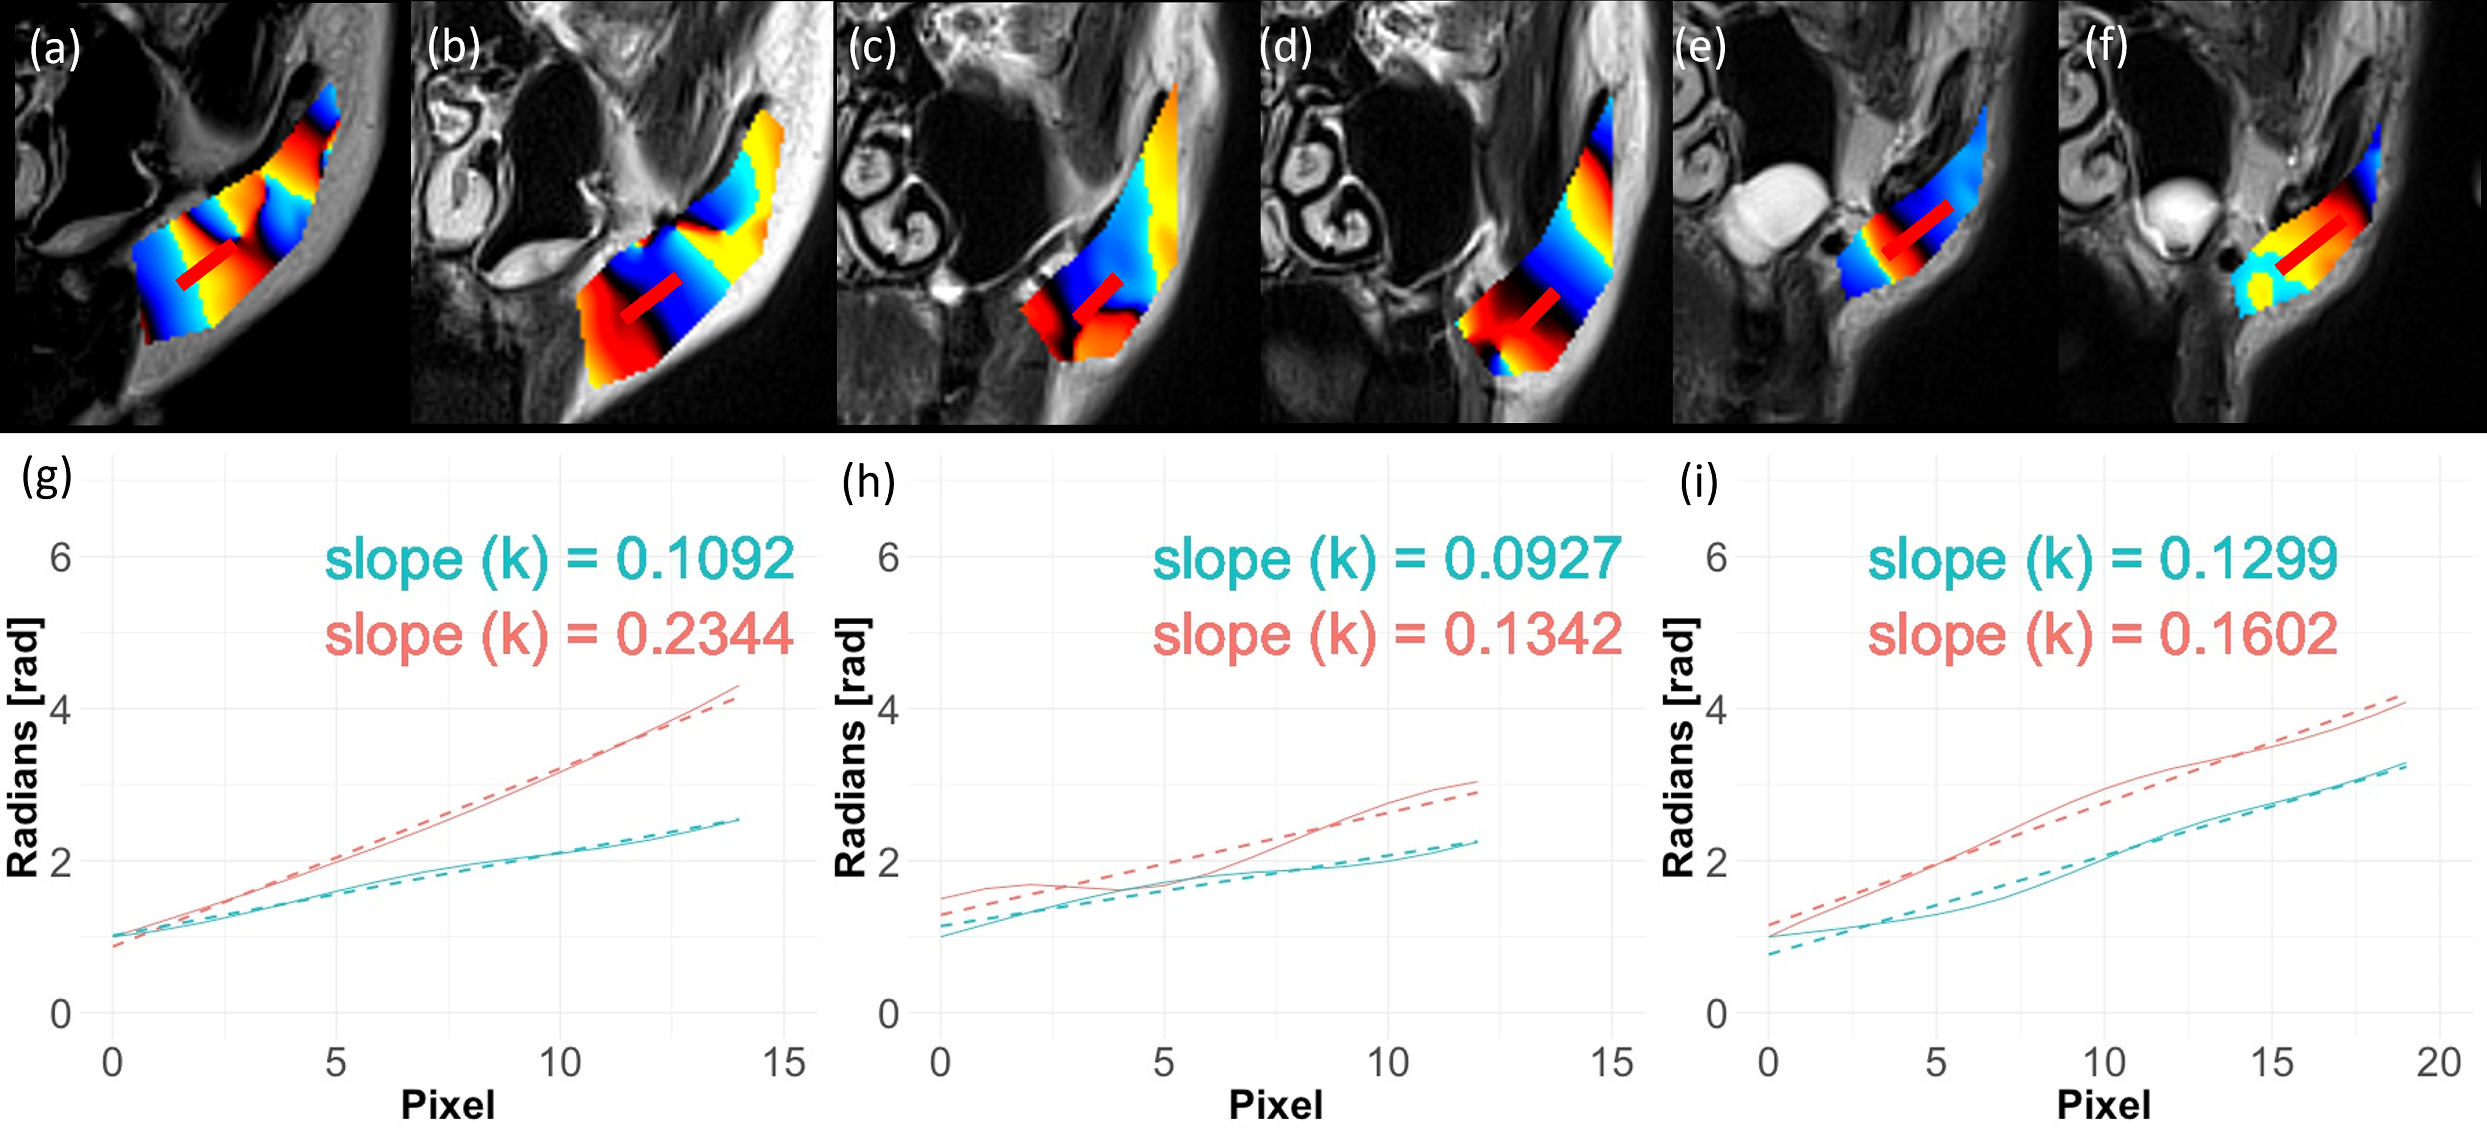
Figure 3: In the top row, pairs of images (e.g. (a) and (b)) show the phase image of the first harmonic overlaid on the T2W for the mouth-closed and mouth-open postures, respectively. In the bottom row, plots of the change in phase along the POI are shown in orange and blue for the mouth-closed and mouth-open postures, respectively. The gradient (i.e. slope of the plot) corresponds to the wavenumber k.