4788
TURBINE functional MR Elastography for Characterization of Whole Brain Neural Response to Visual and Motor Stimulus1Mayo Clinic, Rochester, MN, United States
Synopsis
Keywords: Elastography, Elastography, TURBINE fMRI, Functional MR Elastography
Motivation: To accurately characterize temporal dynamics of stiffness changes in the human brain in response to neural activity.
Goal(s): To understand the relationship between neurovascular (BOLD) and neuromechanical (stiffness) response to long (24s) and short (4s) stimulus durations.
Approach: We used a 3D TURBINE concurrent fMRI-fMRE sequence, which enabled full-brain coverage and faster acquisition of MRE time-series at shorter block duration (4s) in an attempt to decouple hemodynamic effects from the stiffness response.
Results: At a long (24s) block duration, the BOLD effect impacts brain stiffness while at a short (4s) duration no significant BOLD or stiffness response was observed.
Impact: Our preliminary findings suggest that brain stiffness is impacted on the same timescale as BOLD. Our future work aims to achieve higher temporal and signal SNR to decouple neurovascular (BOLD) response from neuromechanical (fMRE) response.
Introduction
The response of BOLD-fMRI and stiffness change as measured by functional MR Elastography (fMRE) due to visual and motor stimulus is an active area of research [1-10]. Recently, we have demonstrated a direct correlation between neurovascular response (fMRI) and neuromechanical response (fMRE) due to a controlled increase in the contrast and flickering frequency of a visual stimulus [11]. While we reported an increase in stiffness of 5.8±1% at long block durations of 24 seconds, other research groups [6-10] have reported a reduction in stiffness at shorter block duration of 0.1s suggesting two different mechanisms govern stiffness changes at fast and slow time scales. Here we demonstrate the feasibility of whole brain fMRI-fMRE using a 3D TURBINE GRE sequence [12-14] in humans to distinguish between the effects of longer (24s) and shorter (4s) block durations. This study lays the foundation for future work aimed at decoupling the neurovascular response (BOLD effect) from neuromechanical response (stiffness), using whole brain fMRE acquisition schemes.Methods
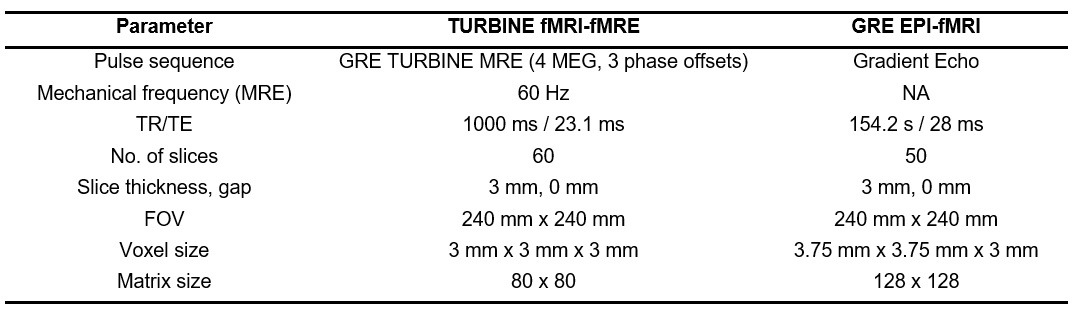
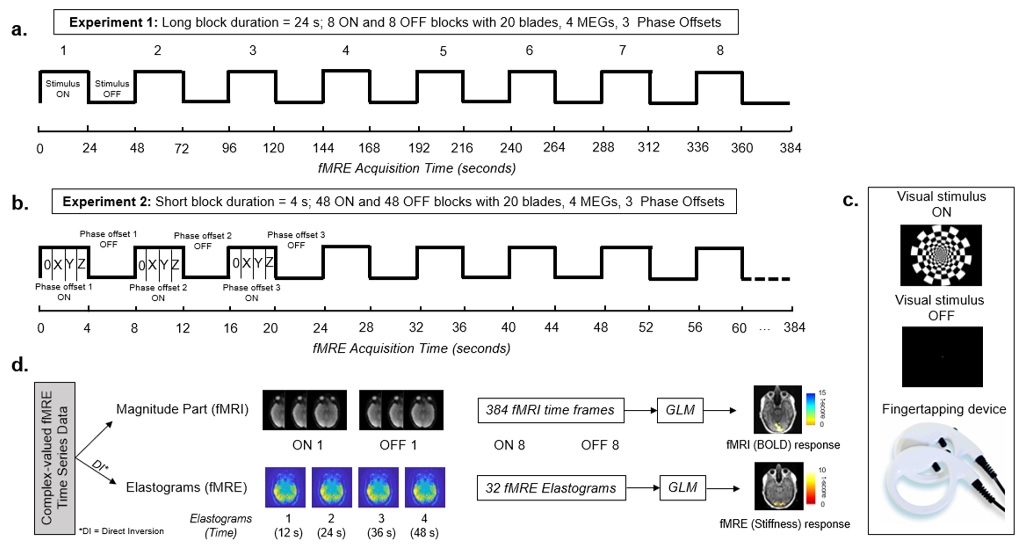
With institutional review board approval and written informed consent, 5 subjects underwent a fMRI/fMRE exam. Three participants underwent a motor stimulus exam while 2 underwent a visual stimulus exam. For each participant, experiment 1 used a 24s (long) block duration, while experiment 2 used a 4s (short) block duration. In the visual experiment, a flickering visual checkerboard pattern was displayed at the time of data acquisition (fig. 1c); during the motor experiment, the visual screen displayed “Tap Finger”/ “Stop Tapping” visual cues to instruct the participant to start and stop the fingertapping motor task using the device shown in fig 1c. Figure 1d shows the data analysis process. Complex-valued time series data acquired during each scan was separated into magnitude and phase components (Figure 1d) and a general linear model (GLM) was used to model activation maps by fitting experimental data to a standard hemodynamic response function (HRF) for BOLD fMRI and with a modified HRF with time to peak modified from 12s to 8s for the fMRE elastograms for experiment 1, based on prior work [15]. For experiment 2 (short 4s fMRE paradigm), the experimental data was fit to a modified HRF with a time to peak at 1s. The fMRI-fMRE experiment parameters are listed in Table 1.Results
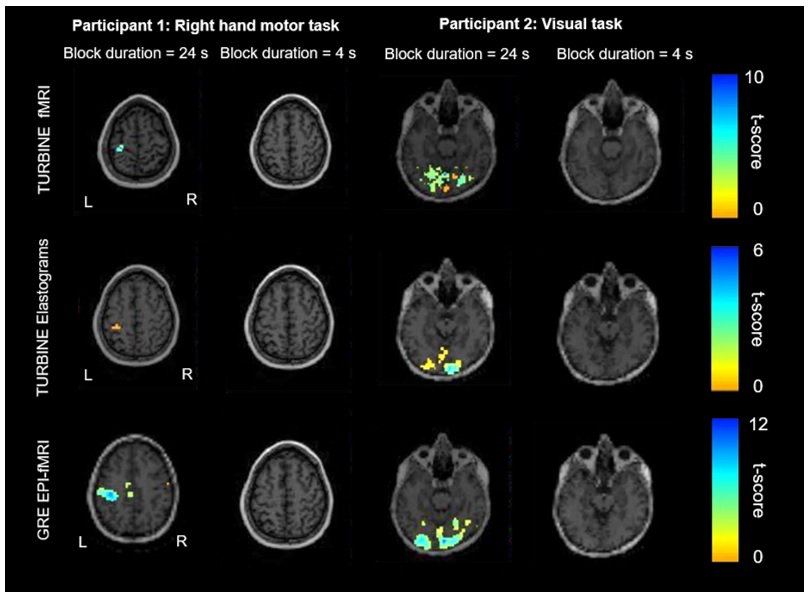
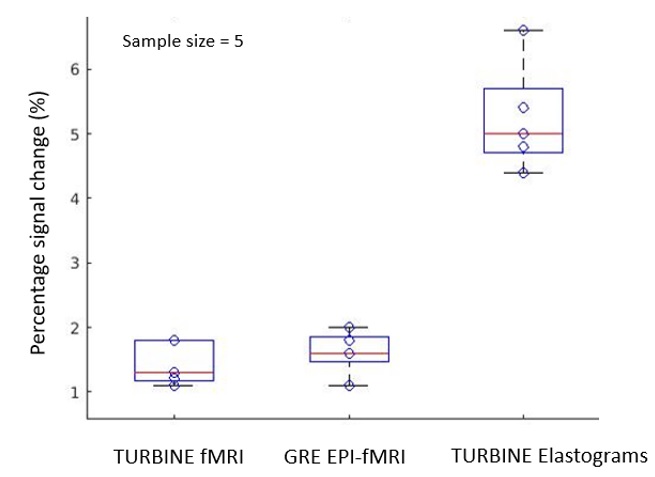
Typical experimental outputs of regional activation maps of 2 participants with a statistical threshold of p < 0.001 are shown in Figure 2. BOLD fMRI from TURBINE magnitude data, fMRE elastograms from TURBINE phase data, and GRE EPI fMRI activation maps are shown in Figure 2, rows 1, 2 and 3, respectively. The regions of activation for fMRI BOLD and fMRE elastograms demonstrate partial overlap. A comparison between percentage signal change associated with fMRI BOLD and the percentage stiffness increase in fMRE is shown in Figure 3. In regions of activation, stiffness increased by 5.4±0.8% while the BOLD signal increased by 1.5±0.5%.Discussion
This study demonstrates the sensitivity of fMRE (stiffness change) to long (24s) and short (4s) block durations. A 5.4±0.8% increase in the stiffness of activated regions of brain due to functional tasks (visual and motor) is reported at a 24s block duration. No signal change was observed at a block duration of 4s for either task. A comparison of activation regions between fMRI (BOLD) and fMRE elastograms shows partial overlap between the regions of activation. Our observation of no significant fMRI or fMRE signal at a 4s block duration suggests that sensitivity needs to be further improved, either through advances in reconstruction or signal modeling, or that stiffness effects are reduced at short time scales.Conclusion
For the first time, we demonstrate the feasibility of whole brain functional MR Elastography using a 3D TURBINE-MRE sequence. Our preliminary investigation suggests that a 4s block duration does not result in a significant response as measured by either fMRI or fMRE. Future studies will aim to improve temporal SNR to better support this finding.Acknowledgements
We would like to acknowledge our MR technologists John Felmlee and Maria Halverson, our study coordinator Timothy Waters for all their assistance with data collection. This study was funded by the NIH K12HD65987-12, 5R37EB001981, 1R01HL151379, U01EB024450, R01EB010065 grants, and the Mayo Clinic Department of Radiology RDCRAFA1 grant.References
1. Patz S, F.D., Schregel K, Nazari N, Palotai M, Barbone PE, Fabry B, Hammers A, Holm S, Kozerke S, Nordsletten D. Mapping neural circuitry at high speed (10hz) using functional magnetic resonance elastography (fmre). in ISMRM 26th Annual Meeting. 2018.
2. de Arcos J, F.D., Neji R, Patz S, Sinkus R. Spatial-temporal dynamics of the visual cortex stiffness driven by a flashing checkerboard stimulus. in ISMRM. 2019.
3. Mishra S, D.B., Hoge WS, Tie Y, Annio G, Sinkus R, Patz S. Imaging Neuronal Activity at Fast Timescales in Humans using MR Elastography. in ISMRM. 2022.
4. Forouhandehpour R, B.M., Gilbert G, Butler R, Whittingstall K, Van Houten E, Cerebral stiffness changes during visual stimulation: Differential physiological mechanisms characterized by opposing mechanical effects. Neuroimage, 2021.
5. Patz S, N.N., Earborne P. Functional neuroimaging in the brain using magnetic resonance elastography. in Proceedings of International Society of Magnetic Resonance in Medicine. 2017.
6. Fehlner A, H.S., Guo J, Braun J, Sack I. The viscoelastic response of the human brain to functional activation detected by magnetic resonance elastography. in Proceedings of International Society of Magnetic Resonance in Medicine. 2014.
7. Patz S, S.K., Muradyan I, Kyriazis A, Wuerfel J, Mukundan S, Sinkus R. Observation of Functional Magnetic Resonance Elastography (fMRE) in Mouse Brain. in Proceedings of International Society of Magnetic Resonance in Medicine. 2015.
8. Holub O, L.S., Schregel K, Bilston L, Patz S, Sinkus R. Fingertapping Experiment Observed by Brain Magnetic Resonance Elastography. 2015.
9. Patz S, F.D., Schregel K, Nazari N, Palotai M, Barbone PE, et al., Imaging localized neuronal activity at fast time scales through biomechanics. Sci Adv, 2019(5).
10. de Arcos J, F.D., Schregel K, Neji R, Patz S, Sinkus R. Imaging primary neuronal activity in the human optical cortex at 1.35 Hz. in Proceedings of International Society of Magnetic Resonance in Medicine. 2018.
11. Palnitkar, H.R., Murphy, Matthew C., Sui, Yi, Glaser, Kevin J., Manduca, Armando, Huston, John III, Ehman, Richard, L., Arani, Arvin. Characterization of Functional MR Elastography Responses to Variations in Visual Stimulus Frequency and Contrast. in Proceedings of International Society of Magnetic Resonance in Medicine. 2023. Toronto: ISMRM.
12. Sui, Y., et al., TURBINE‐MRE: a 3D hybrid radial‐Cartesian EPI acquisition for MR elastography. Magnetic resonance in medicine, 2021. 85(2): p. 945-952.
13. McNab, J.A., D. Gallichan, and K.L. Miller, 3D steady‐state diffusion‐weighted imaging with trajectory using radially batched internal navigator echoes (TURBINE). Magnetic Resonance in Medicine: An Official Journal of the International Society for Magnetic Resonance in Medicine, 2010. 63(1): p. 235-242.
14. Graedel, N.N., et al., Motion correction for functional MRI with three‐dimensional hybrid radial‐C artesian EPI. Magnetic resonance in medicine, 2017. 78(2): p. 527-540.
15. Lan P S, G.K.J., Ehman R L, Glover G H, Imaging brain function with simultaneous BOLD and viscoelasticity contrast: fMRI/fMRE. Neuroimage, 2020. 211: p. 116592.
Figures