4781
Rotational flow as a marker of left ventricular function between youth and adult T2D subjects1Department of Radiology, Children's Hospital Colorado, University of Colorado Anschutz Medical Campus, Aurora, CO, United States, 2Institute of Medical Devices, Kangwon National University, Chuncheon, Korea, Republic of, 3Department of Pediatrics, Division of Endocrinology, University of Colorado School of Medicine, Aurora, CO, United States, 4Division of Endocrinology, Metabolism, and Diabetes, Department of Medicine, University of Colorado Anschutz Medical Campus, Aurora, CO, United States, 5Rocky Mountain Regional Veterans Administration Medical Center (VAMC), Aurora, CO, United States, 6Department of Bioengineering, University of Colorado Anschutz Medical Campus, Aurora, CO, United States
Synopsis
Keywords: Flow, Cardiovascular, 4D flow MRI, rotational flow, vorticity
Motivation: Rotational flow within the aorta has been associated with cardiovascular disease and ventricular-vascular coupling, but no study has investigated its direct correlation with LV function.
Goal(s): This study aims to explore whether the assessment of rotational flow can effectively identify left ventricle dysfunction between youth and adult type 2 diabetes (T2D) subjects.
Approach: Correlation between global function and strain changes by CMR and rotational flow indices and pulse wave velocity by 4D flow MRI were evaluated.
Results: Adult T2D had significant decrease in vorticity indices with CMR biomarkers, while showing less significance in CMR biomarkers compared to youth T2D.
Impact: Vorticity indices are potential biomarkers to assess LV dysfunction and understand ventricular-vascular coupling even in the absence of geometric anomalies within the aorta. A comprehensive examination of rotational flow and LV function is required.
Introduction
Rotational flow through aorta has been closely associated with various cardiovascular abnormalities such as bicuspid aortic valve1,2, aneurysm3, and dissection4. Geometrical anomalies of these diseases significantly influence flow patterns within the aorta. As such, elevated rotational flow indices are considered as potential biomarkers to identify these anomalies. Our group has also demonstrated rotational flow indices, such as helicity and vorticity, in patients with pulmonary hypertension are strongly correlated with ventricular-vascular coupling between right ventricle and vascular arteries5. In contrast to geometrical anomalies, helicity and vorticity increased in control groups, while patients with pulmonary disease had significantly low rotation flow indices, potentially limiting efficient flow conduction to distal pulmonary arteries. Thus, it has been postulated that the intraventricular-vascular rotational moment of flowing blood plays an essential role in conserving flow propagation and mitigates flow instabilities6.This led us to hypothesize that rotational flow in the aorta could be a potential marker in identifying left ventricular (LV) dysfunction even in the absence of a geometric anomaly. To the best of our knowledge, no studies have investigated a direct relationship between rotational flow through aorta and global function and strain changes. As such, this study aims to examine if rotational flow is capable of discerning LV function in youth-onset and adult type 2 diabetes (T2D) subjects by employing cardiac magnetic resonance imaging (CMR) and time-resolved three-dimensional flow sensitive CMR (4D flow MRI) techniques.
Methods
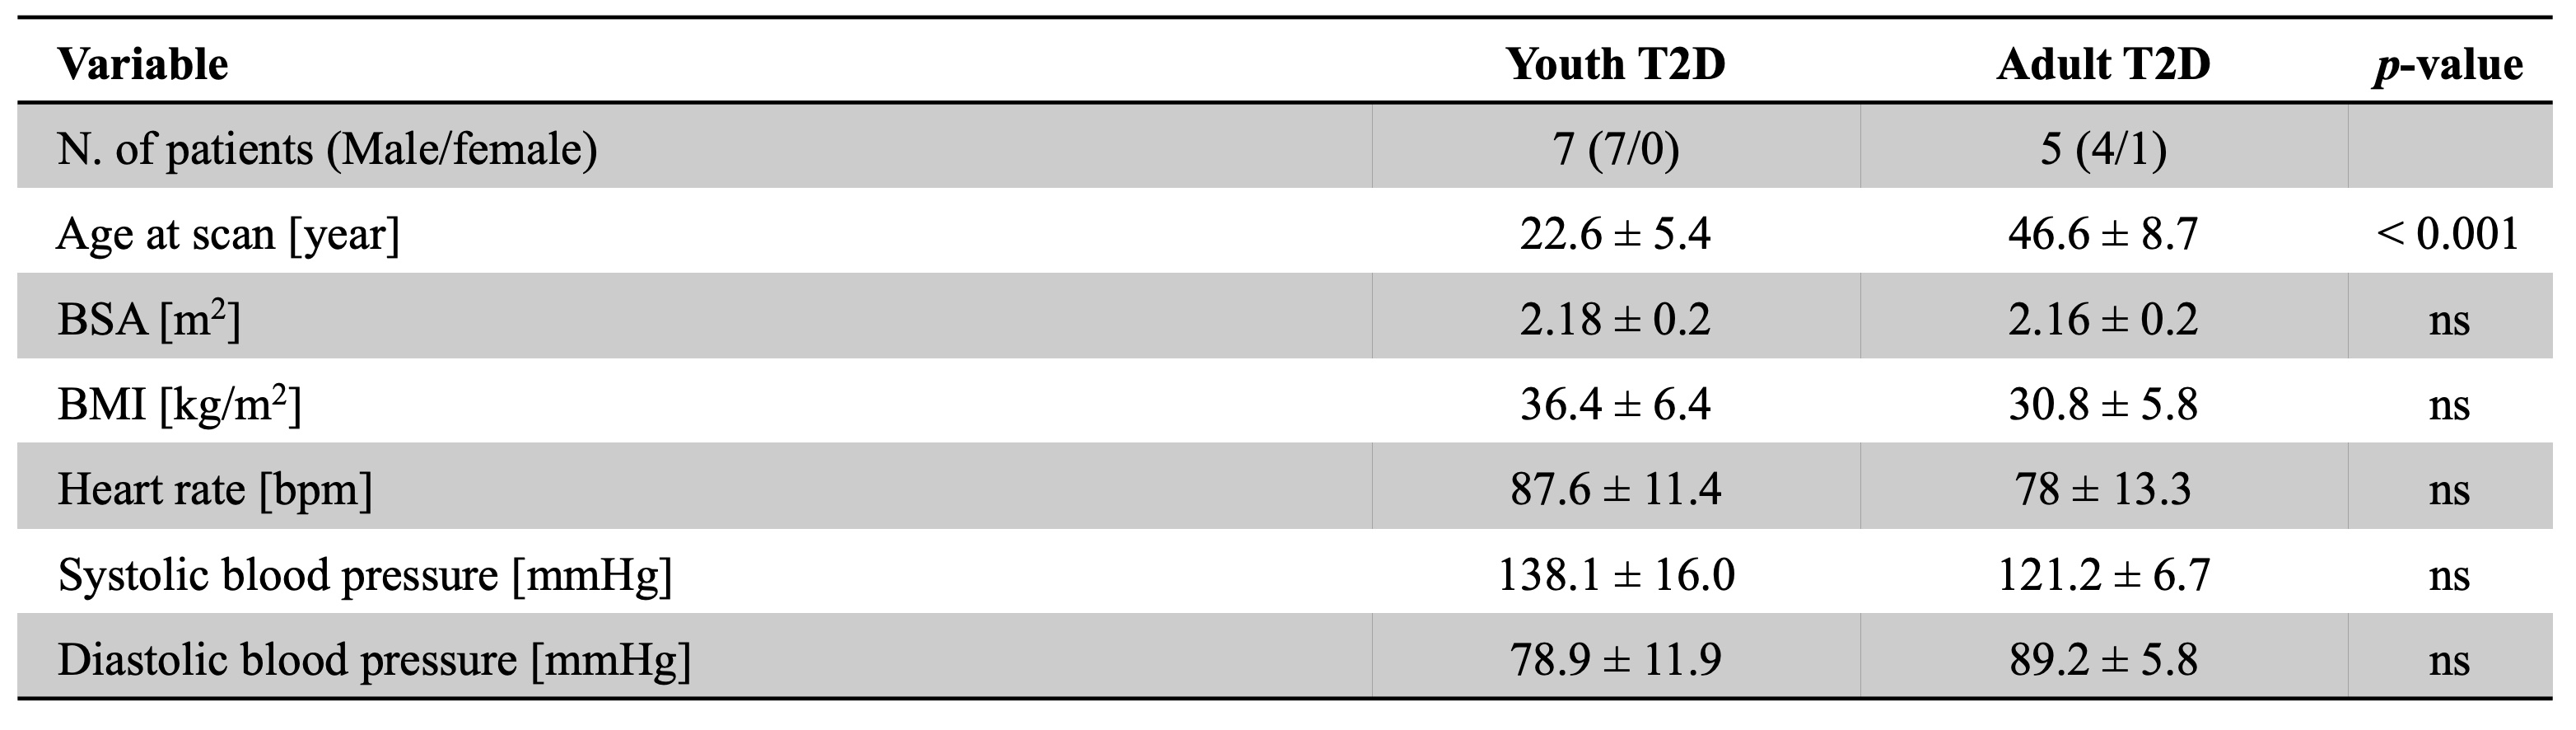
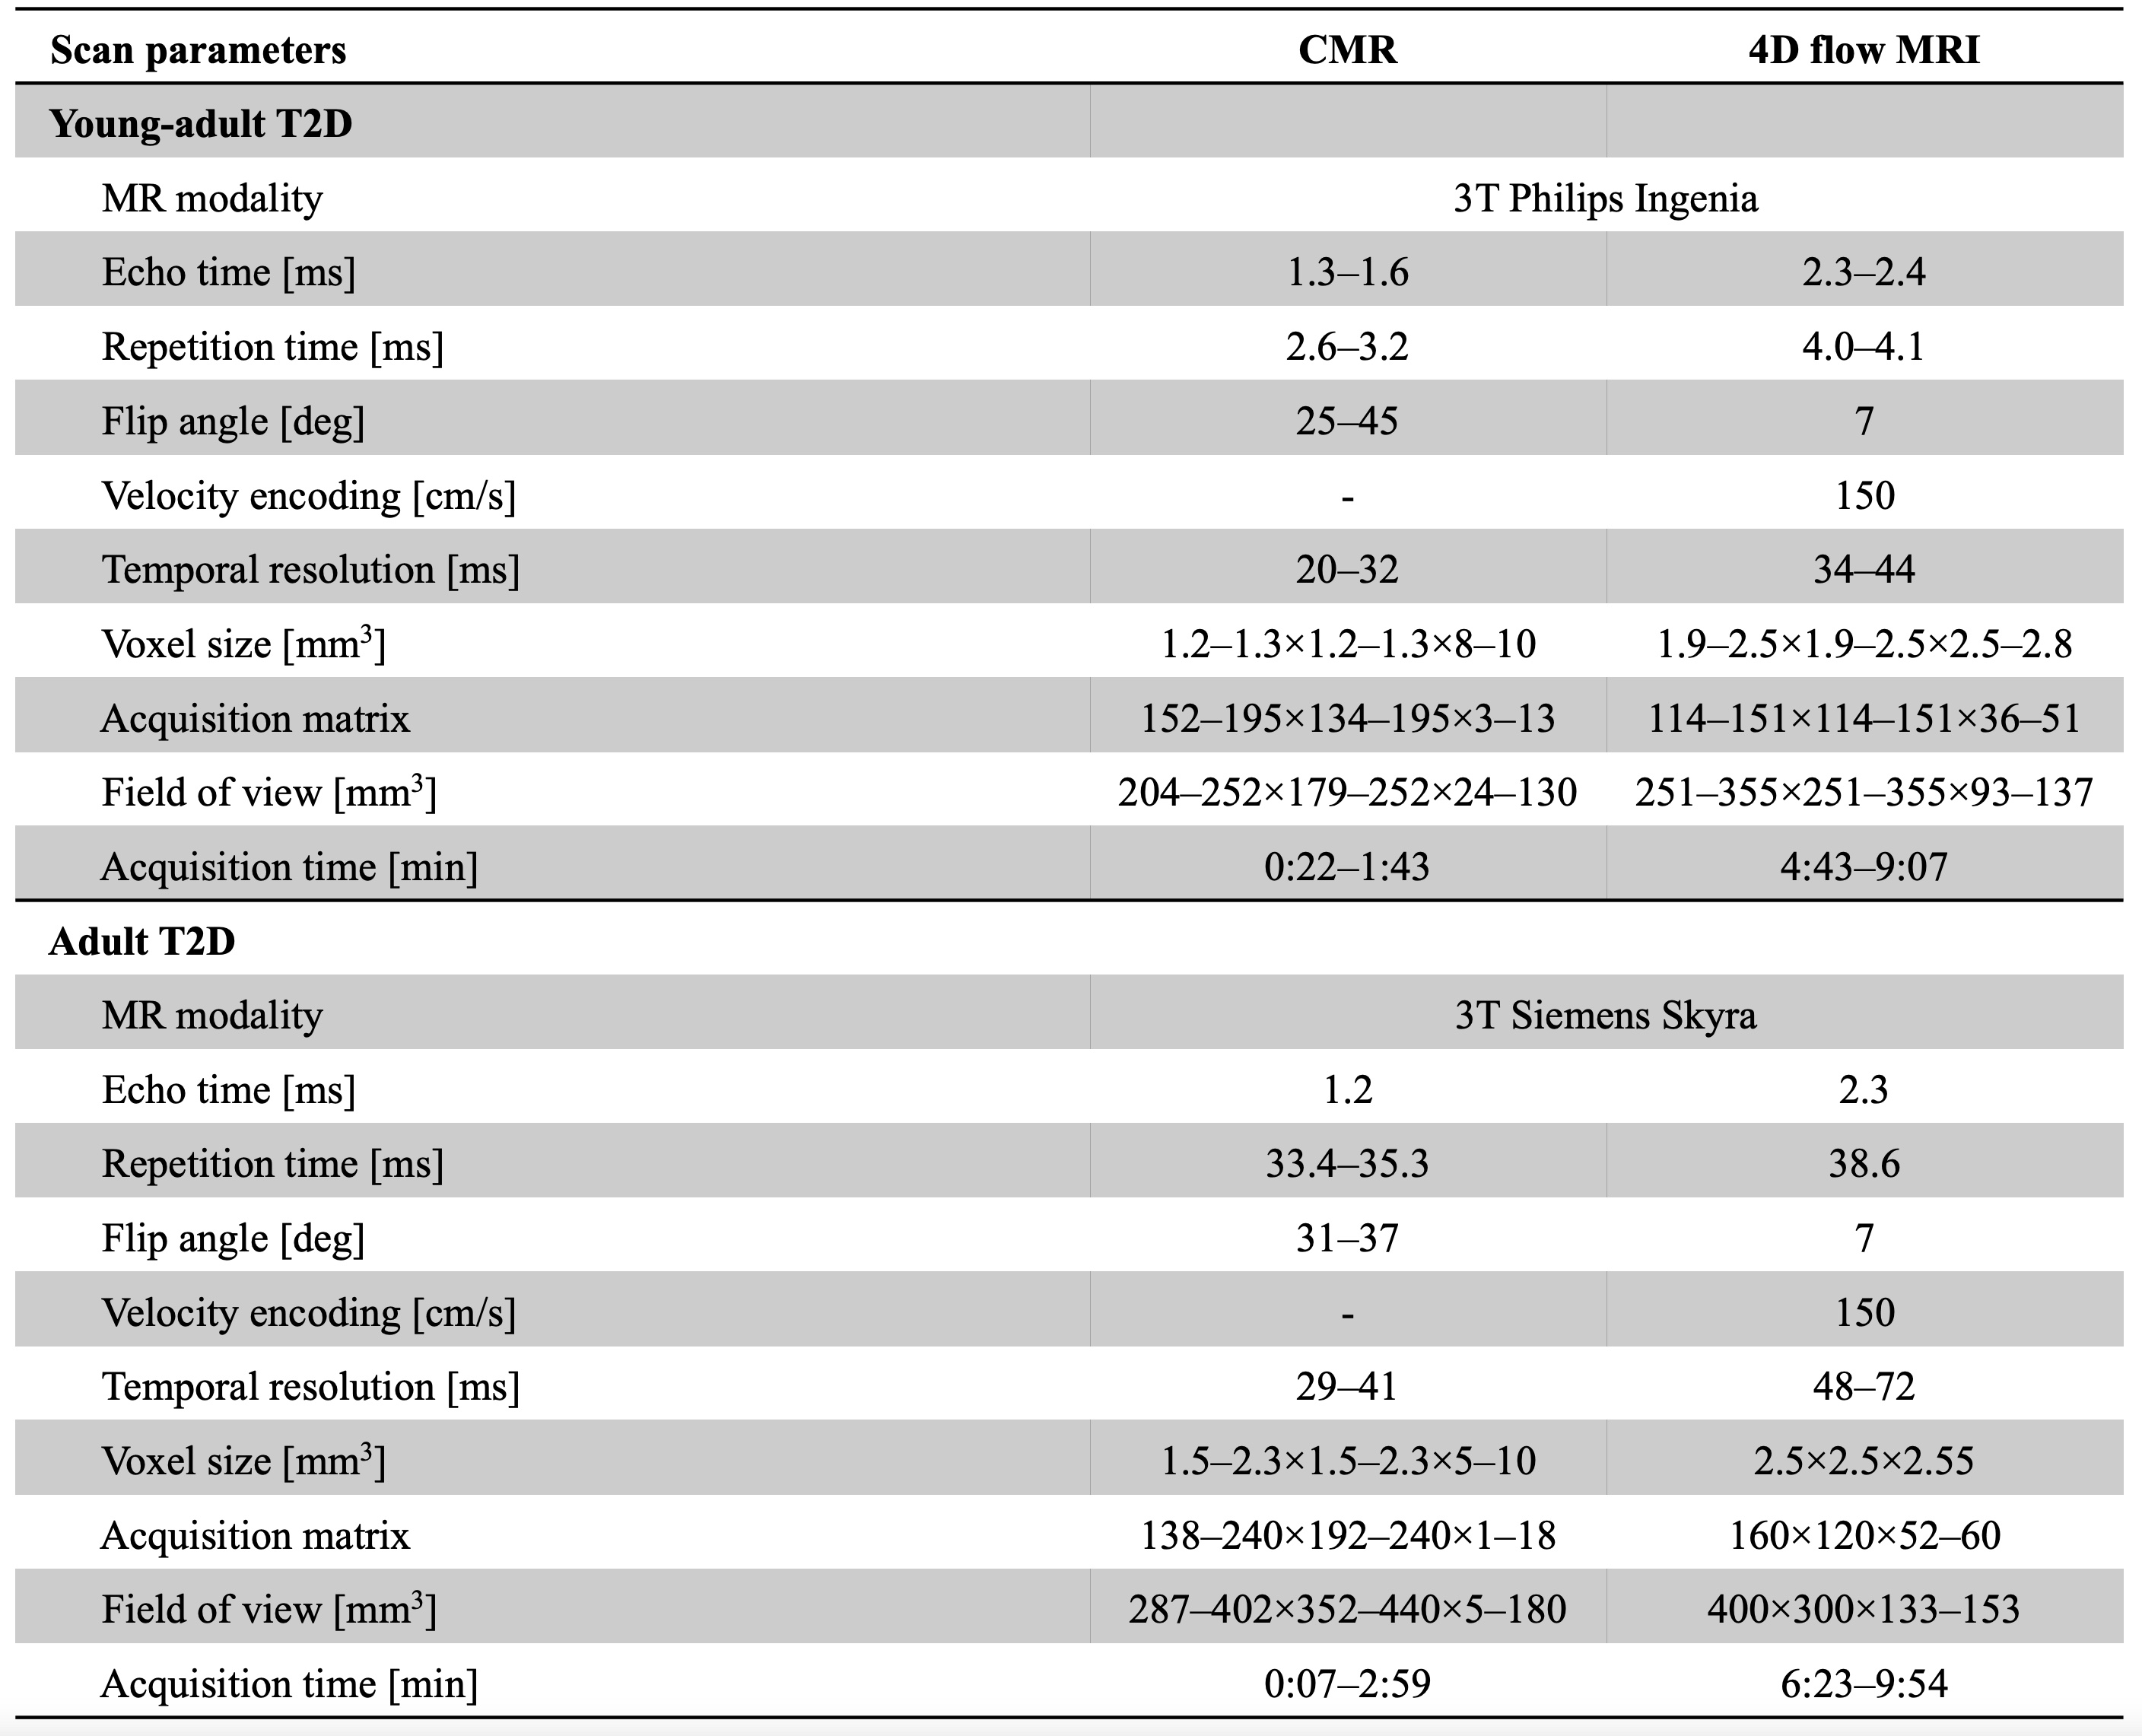
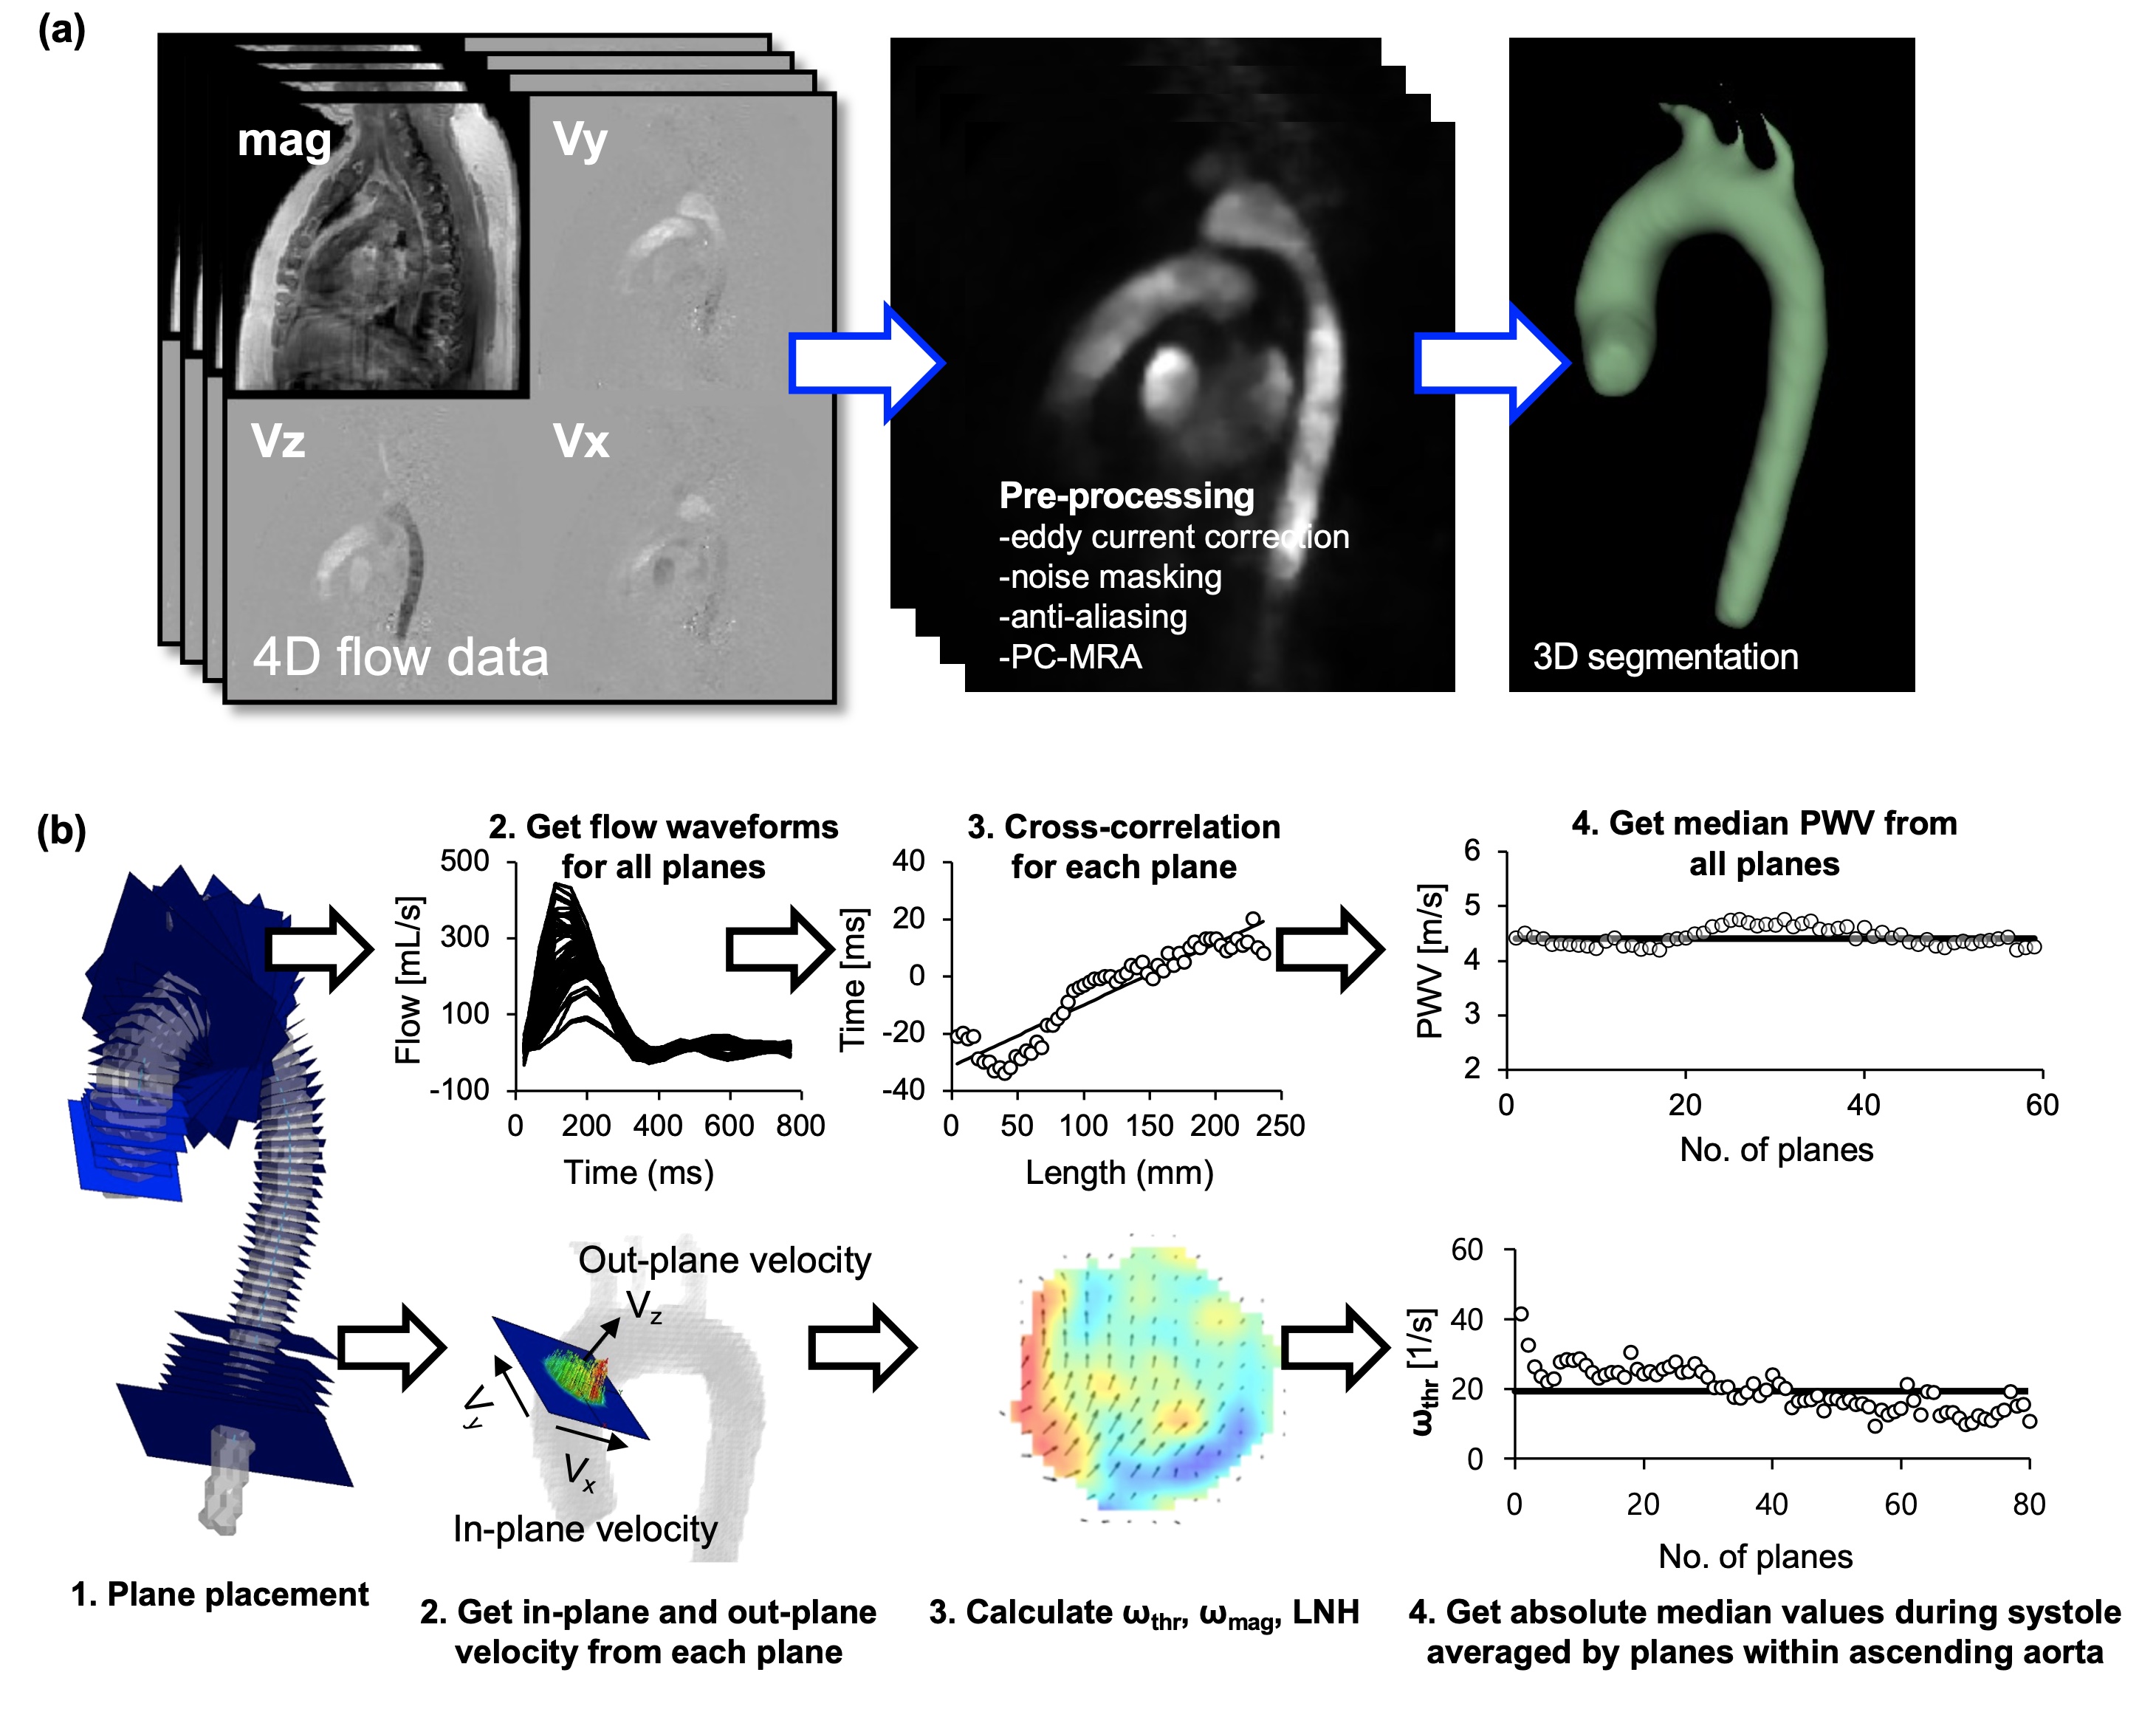
Seven youth and five adults with T2D subjects were prospectively recruited. Subjects had no history of prior cardiovascular events and were included prior to receiving therapeutic treatment. The mean age of the youth and adult T2D subjects was 22.6±5.4 years and 46.6±8.7 years, respectively. Other demographic variables, as summarized in Table 1, did not show significant differences. CMR and 4D flow MRI images were acquired for youth T2D using a 3T Philips Ingenia MRI system (Philips Healthcare, Best, Netherlands) and for adults with T2D using a 3T Siemens Skyra MRI system (Siemens Healthineers, Erlangen, Germany). MR scan parameters were summarized in Table 2. Global function and strain changes were measured using time-resolved CMR, while pulse wave velocity (PWV), in-plane rotational flow of through-plane vorticity (ωthr), magnitude vorticity (ωmag), and localized normalized helicity (LNH) were obtained through 4D flow MRI analysis employing machine learning-based auto-segmentation7 (Fig. 1). Unpaired two-tailed t-test was conducted to assess statistical significance, while Pearson correlation between CMR and 4D flow MRI metrics was evaluated.Results
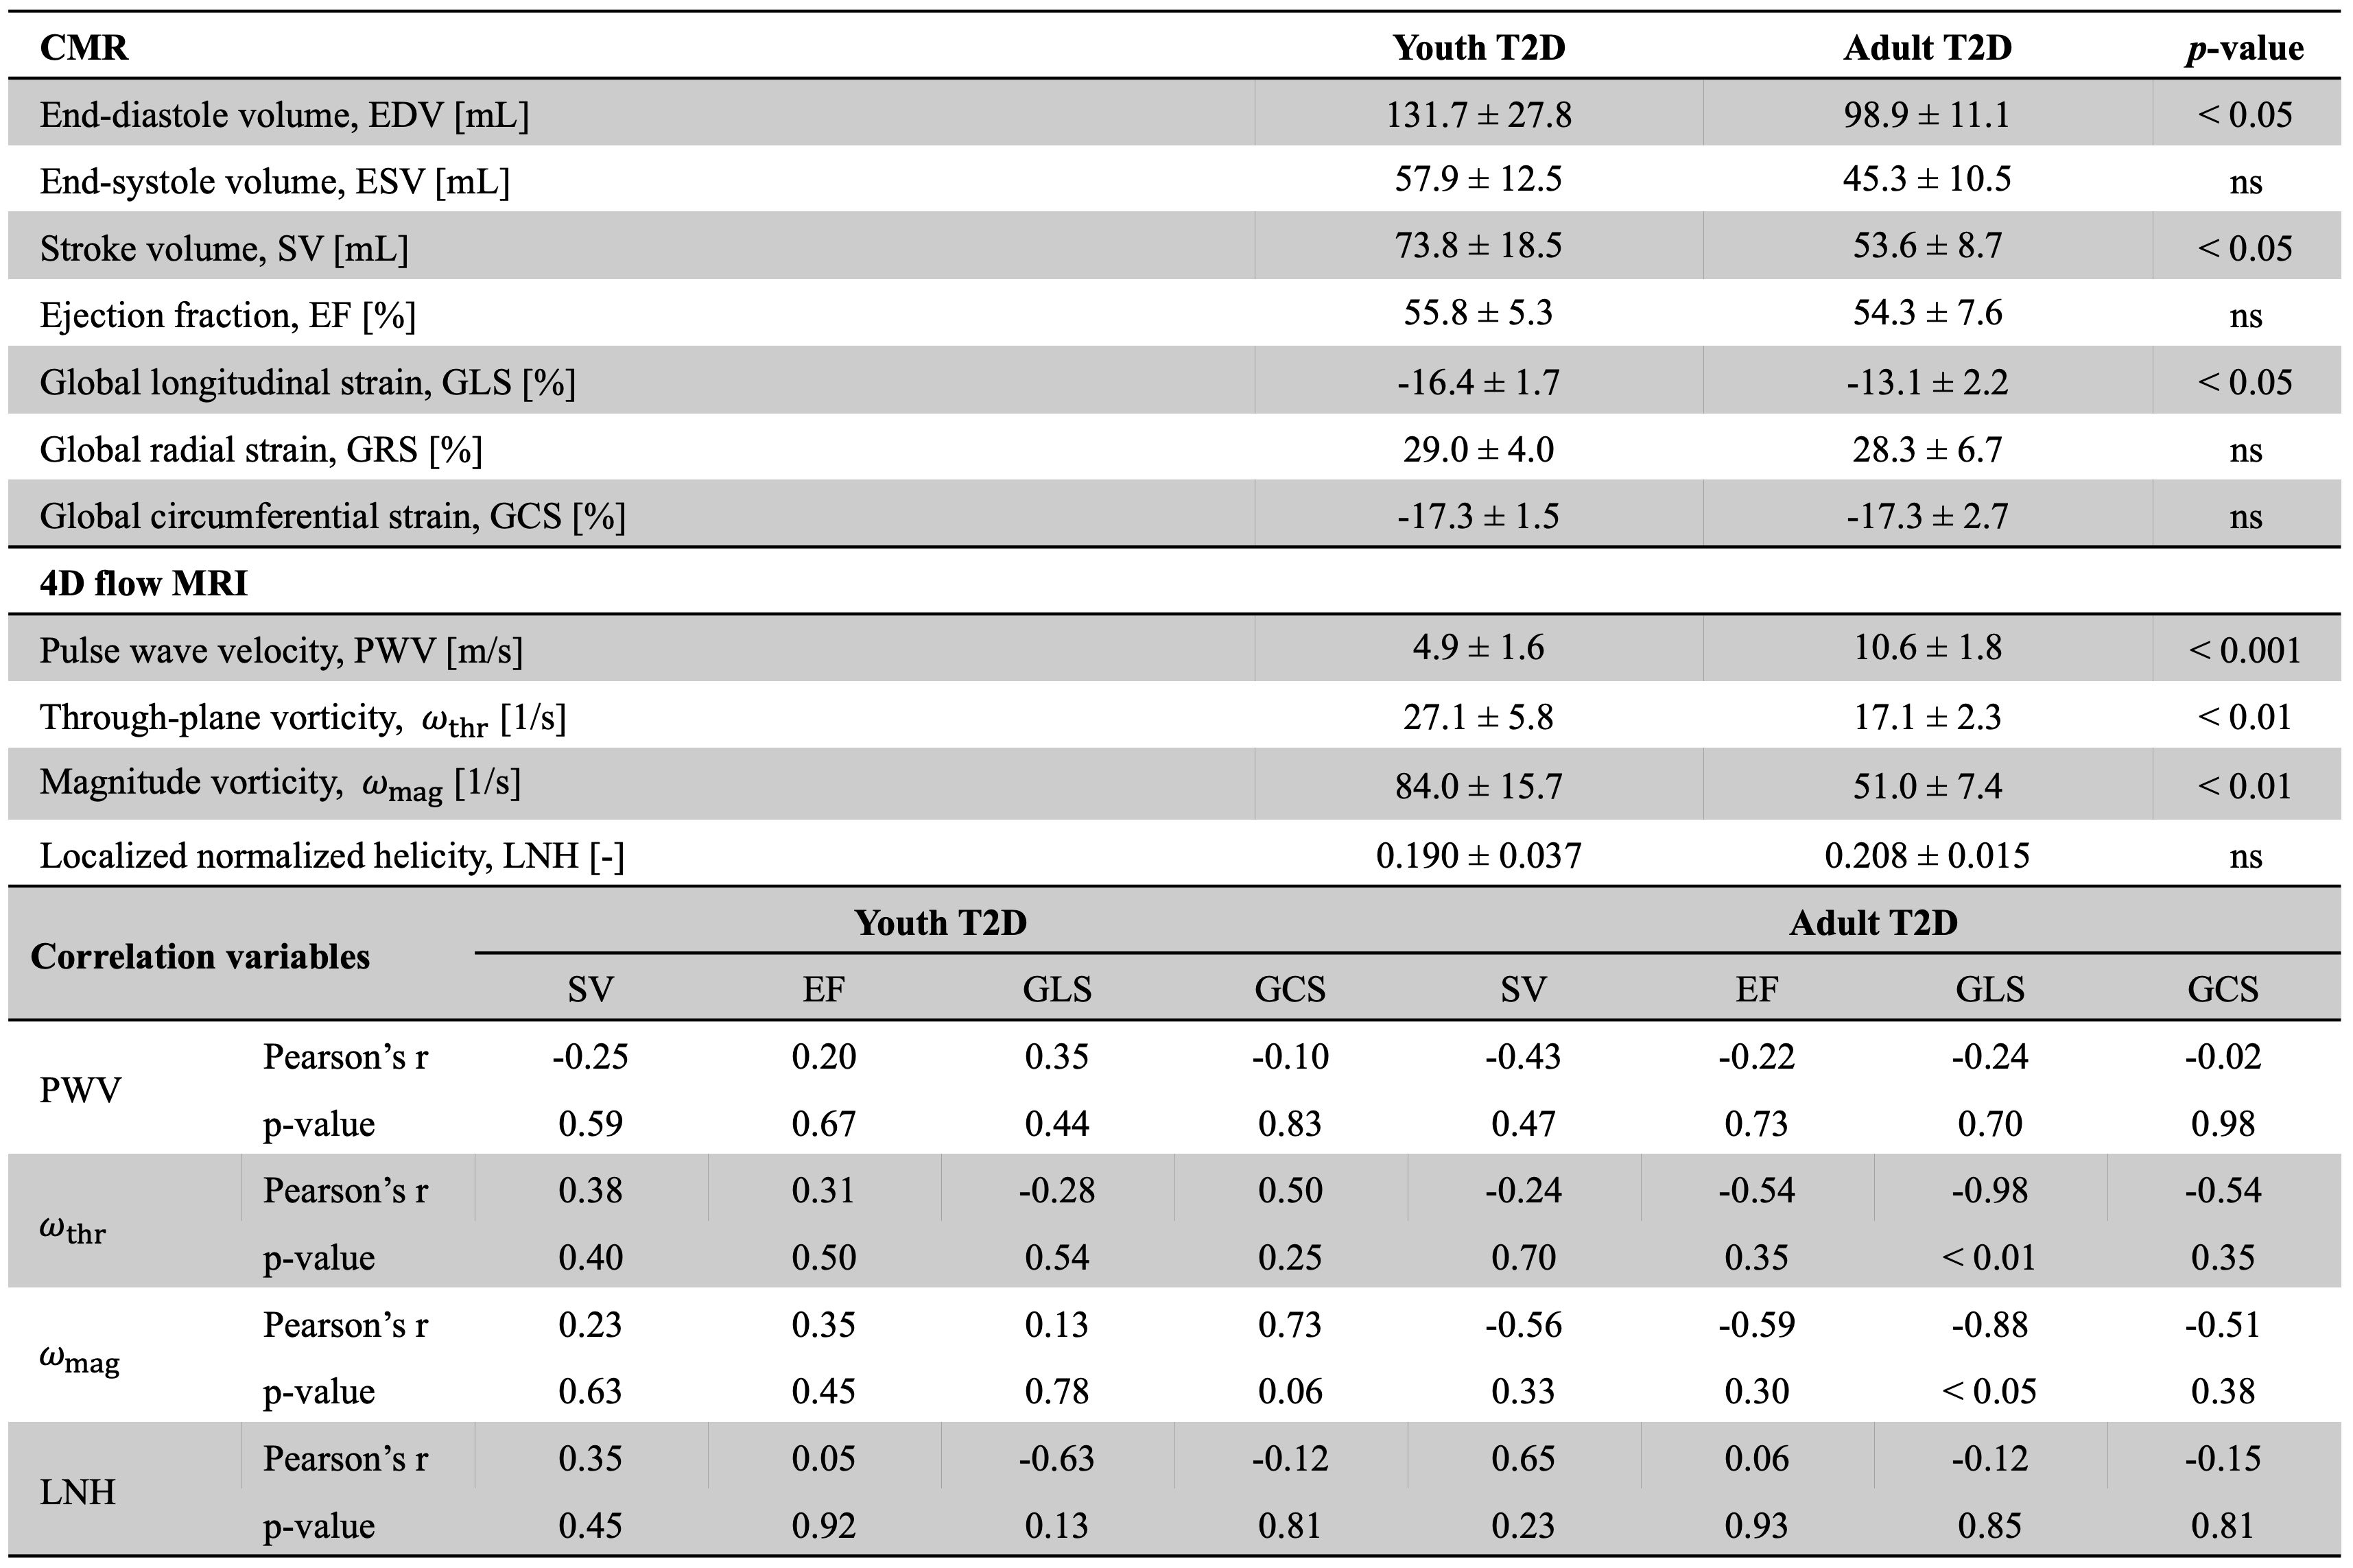
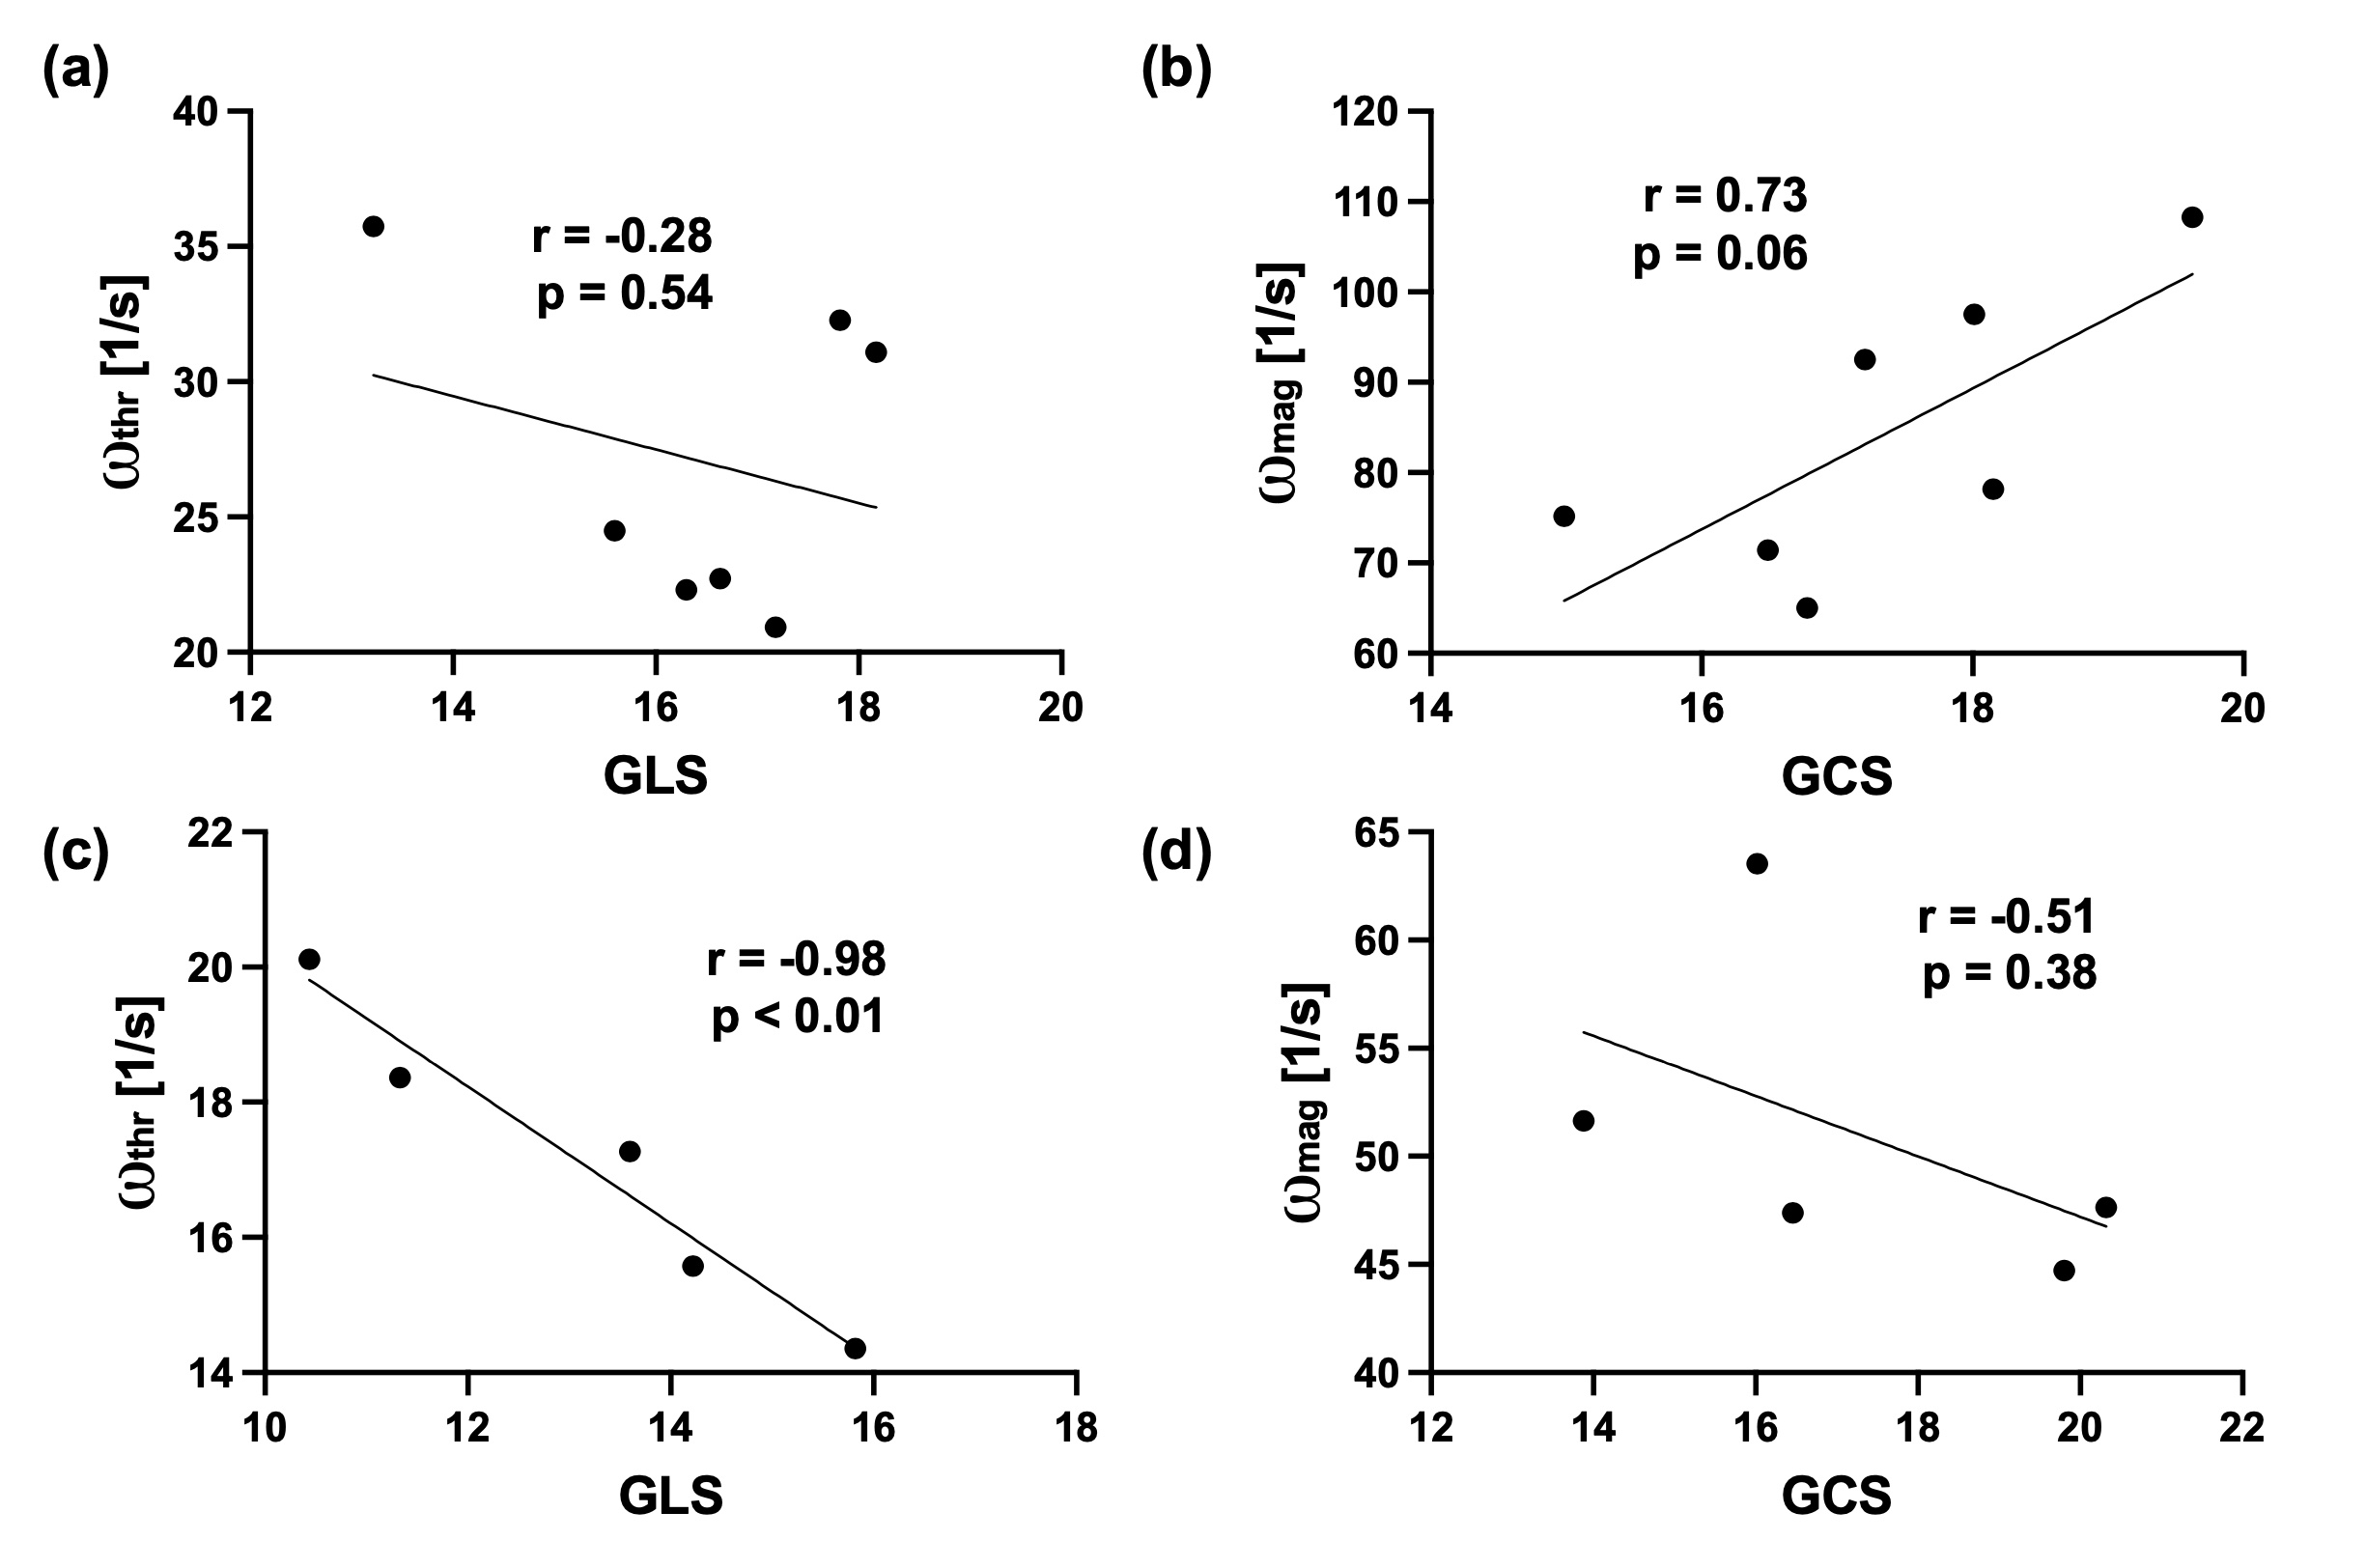
CMR results demonstrate significantly low end-diastolic volume (EDV; p<0.05), stroke volume (SV; p<0.05), and magnitude of global longitudinal strain (GLS; p<0.05) for adult T2D (Table 3). 4D flow MRI results indicate significantly higher vascular stiffness, measured by PWV, in adult T2D compared to that in youth T2D (p=0.001). In addition, ωthr and ωmag were significantly higher in youth T2D, while no significant difference was observed for LNH. Correlation analysis in each group showed strong correlation between vorticity indices and changes in global function and strain (Table 3 and Fig. 2).Discussion
PWV is a promising hemodynamic parameter capable of measuring a surrogate for aortic stiffness. Furthermore, our previous results show that adult T2D subjects are significantly at higher risk for CVD with arterial stiffening, which is associated with age, and progression of T2D8,9. On the contrary, EF, GLS, and GCS, recognized as strong biomarkers to predict LV dysfunction and CVD10,11, had fewer or no significant differences. Some studies have speculated that LV dysfunction is masked by changes in global function and strain, even while preserving EF10,12. This implies that CMR biomarkers may underestimate the impact of LV dysfunction despite evidence of vascular impacts in the form of stiffening.Our study firstly demonstrates strong correlations between rotational flow indices and global function and strain changes even in the absence of a geometric anomaly, while observing significant decreases in ωthr and ωmag for adult T2D. This suggests that changes in LV systolic function could be reflected with rotational flow, suggesting the possibility for increased energy dissipation and flow instabilities in adult T2D. Thus, vorticity indices and PWV may be potential biomarkers to identify the severity of ventricular-vascular dysfunction. However, we also observed that LNH seems to be less affected possibly due to normalization by vorticity and velocity magnitude. In addition, rotational flow was regulated differently in each group. A detailed analysis is further required for understanding the mechanism of rotational flow formation.
Conclusion
Adult T2D had significant decreases in vorticity indices and increased PWV, while showing less significance in CMR biomarkers compared to youth T2D.Acknowledgements
KHIDI HI22C1915 (SP)
VA Clinical Merit CX001532 (J.E.B.R.)
VA Merit BX002046 (J.E.B.R.)
Horizon Pharma
Supported by NIH/NCATS Colorado CTSA Grant Number UM1 TR004399. Contents are the authors’ sole responsibility and do not necessarily represent official NIH views
References
1. Rodríguez-Palomares, J.F., et al. Aortic flow patterns and wall shear stress maps by 4D-flow cardiovascular magnetic resonance in the assessment of aortic dilatation in bicuspid aortic valve disease. Journal of Cardiovascular Magnetic Resonance 20, 1-15 (2018).
2. Bissell, M.M., et al. Differential flow improvements after valve replacements in bicuspid aortic valve disease: a cardiovascular magnetic resonance assessment. Journal of Cardiovascular Magnetic Resonance 20, 1-10 (2018).
3. Hope, M.D., et al. Bicuspid aortic valve: four-dimensional MR evaluation of ascending aortic systolic flow patterns. Radiology 255, 53-61 (2010).
4. Ruiz-Muñoz, A., et al. False lumen rotational flow and aortic stiffness are associated with aortic growth rate in patients with chronic aortic dissection of the descending aorta: a 4D flow cardiovascular magnetic resonance study. Journal of Cardiovascular Magnetic Resonance 24, 1-13 (2022).
5. Schäfer, M., et al. Helicity and vorticity of pulmonary arterial flow in patients with pulmonary hypertension: quantitative analysis of flow formations. Journal of the American Heart Association 6, e007010 (2017).
6. Morbiducci, U., et al. In vivo quantification of helical blood flow in human aorta by time-resolved three-dimensional cine phase contrast magnetic resonance imaging. Annals of biomedical engineering 37, 516-531 (2009).
7. Fujiwara, T., et al. Segmentation of the Aorta and Pulmonary Arteries Based on 4D Flow MRI in the Pediatric Setting Using Fully Automated Multi‐Site, Multi‐Vendor, and Multi‐Label Dense U‐Net. Journal of Magnetic Resonance Imaging 55, 1666-1680 (2022).
8. Jarvis, K., et al. Aortic pulse wave velocity evaluated by 4D flow MRI across the adult lifespan. Journal of Magnetic Resonance Imaging 56, 464-473 (2022).
9. Ferreira, M.T., Leite, N.C., Cardoso, C.R. & Salles, G.F. Correlates of aortic stiffness progression in patients with type 2 diabetes: importance of glycemic control: the Rio de Janeiro type 2 diabetes cohort study. Diabetes Care 38, 897-904 (2015).
10. Stokke, T.M., et al. Geometry as a confounder when assessing ventricular systolic function: comparison between ejection fraction and strain. Journal of the American College of Cardiology 70, 942-954 (2017).
11. Murphy, S.P., Ibrahim, N.E. & Januzzi, J.L. Heart failure with reduced ejection fraction: a review. Jama 324, 488-504 (2020).
12. Skaarup, K.G., et al. Link between myocardial deformation phenotyping using longitudinal and circumferential strain and risk of incident heart failure and cardiovascular death. European Heart Journal-Cardiovascular Imaging, jead075 (2023).
Figures