4778
Impact of Wall Shear Stress and Flow Displacement on Aortic Root Dilation in Bicuspid Aortic Valve Patients with Varied Regurgitation Severity1Biomedical Engineering, University of Calgary, Calgary, AB, Canada, 2Department of Radiology, University of Calgary, Calgary, AB, Canada
Synopsis
Keywords: Flow, Velocity & Flow, 4D flow MRI, Advance flow biomarkers, Aortic valve
Motivation: Congenital bicuspid aortic valve (BAV) effects and its associated lesions on hemodynamic alterations, leading to aortic root dilation as the most severe form of aortopathy, remains unexplored.
Goal(s): We aimed to examine the relationship between BAV phenotypes, considering various regurgitation severities, and aortic root dilation by analyzing abnormal wall shear stress (WSS) and normalized flow displacement (NFD) related to retrograde and anterograde flow jets.
Approach: We utilized time-resolved three-dimensional phase contrast MRI to measure these velocity-derived flow biomarkers in healthy and BAV cohorts.
Results: WSS proved a more sensitive and reliable metric than NFD in distinguishing BAV from healthy controls.
Impact: Validating and quantifying advanced flow biomarkers in the aortic root due to its different biomechanical properties could enhance risk assessment, prognosis, and prevention of clinical complications in BAV patients with secondary valvular insufficiency.
Introduction
Bicuspid aortic valve (BAV) as the most common congenital heart defect is associated with various secondary diseases1. Studies employing time-resolved three-dimensional (3D) phase-contrast magnetic resonance imaging (4D-flow MRI) indicate each BAV phenotype is associated with different downstream flow jet, causing different aortic dilatation morphotypes2,3. However, the effect of BAV phenotypes and related lesions on wall shear stress (WSS) alteration and aortic root dilation remains unclear. Hence, we aimed to evaluate the association between BAV phenotypes with different regurgitation severities and aortic root dilatation by assessing abnormal WSS and normalized flow displacement (NFD) due to systolic blood flow and diastolic regurgitant jets. We hypothesized that in BAV-induced regurgitation, aortic root WSS and FD will elevate not only during the systole but in diastole due to the regurgitation jet.Method
We retrospectively identified 77 BAV cases (age=48.67 ± 13.99, female=20), encompassing right-left coronary (R/L), right-non coronary (R/N) cusp fusions and Type0 4. We also included 25 (age=37.98 ± 14.01, female=9) healthy volunteers. Standard cardiovascular MRI techniques were performed followed by 4D flow MRI using 3T MRI scanners (Skyra, Prisma, Siemens, Erlangen, Germany). 4D flow MRI parameters were as follows: velocity encoding range= 150–200 cm/s, FA = 15°, spatial resolution = 2.0–3.6 x 2.0–3.0 x 2.5–3.5mm3, temporal resolution = 25–35ms, cardiac phases = 30. 4D flow MRI data were corrected and analyzed using in-house MATLAB software (MathWorks, Natick, MA). The workflows have been shown in Figure 1.WSS analysis:
The WSS algorithm requires inputs of a time-resolved 3D surface of the vessel lumen and an associated 3D velocity vector field derived from phase contrast-MRI measurements5 The aortic root was identified, and the maximum WSS was measured during the peak systolic and peak regurgitation timepoints, extracted from the personalized flow profile.
NFD analysis:
The 3D segmented aorta's centerline was calculated using a validated algorithm that generates precise volumetric skeletons through subvoxel distance field computation6. Two planes, placed at the sinotubular junction (STJ) and the left ventricular outflow tract (LVOT), were employed to obtain velocity data for assessing FD during peak systole and peak regurgitation. The FD was calculated by measuring the distance from the centerline to the velocity-weighted centroid of each plane. This FD value was then divided by the diameter of the planes to calculate the NFD.
Shapiro-Wilk test, t-tests, ANOVA, and Kruskal-Wallis H test were conducted using IBM SPSS (Version 28). P-values <0.05 were considered statistically significant.
Results
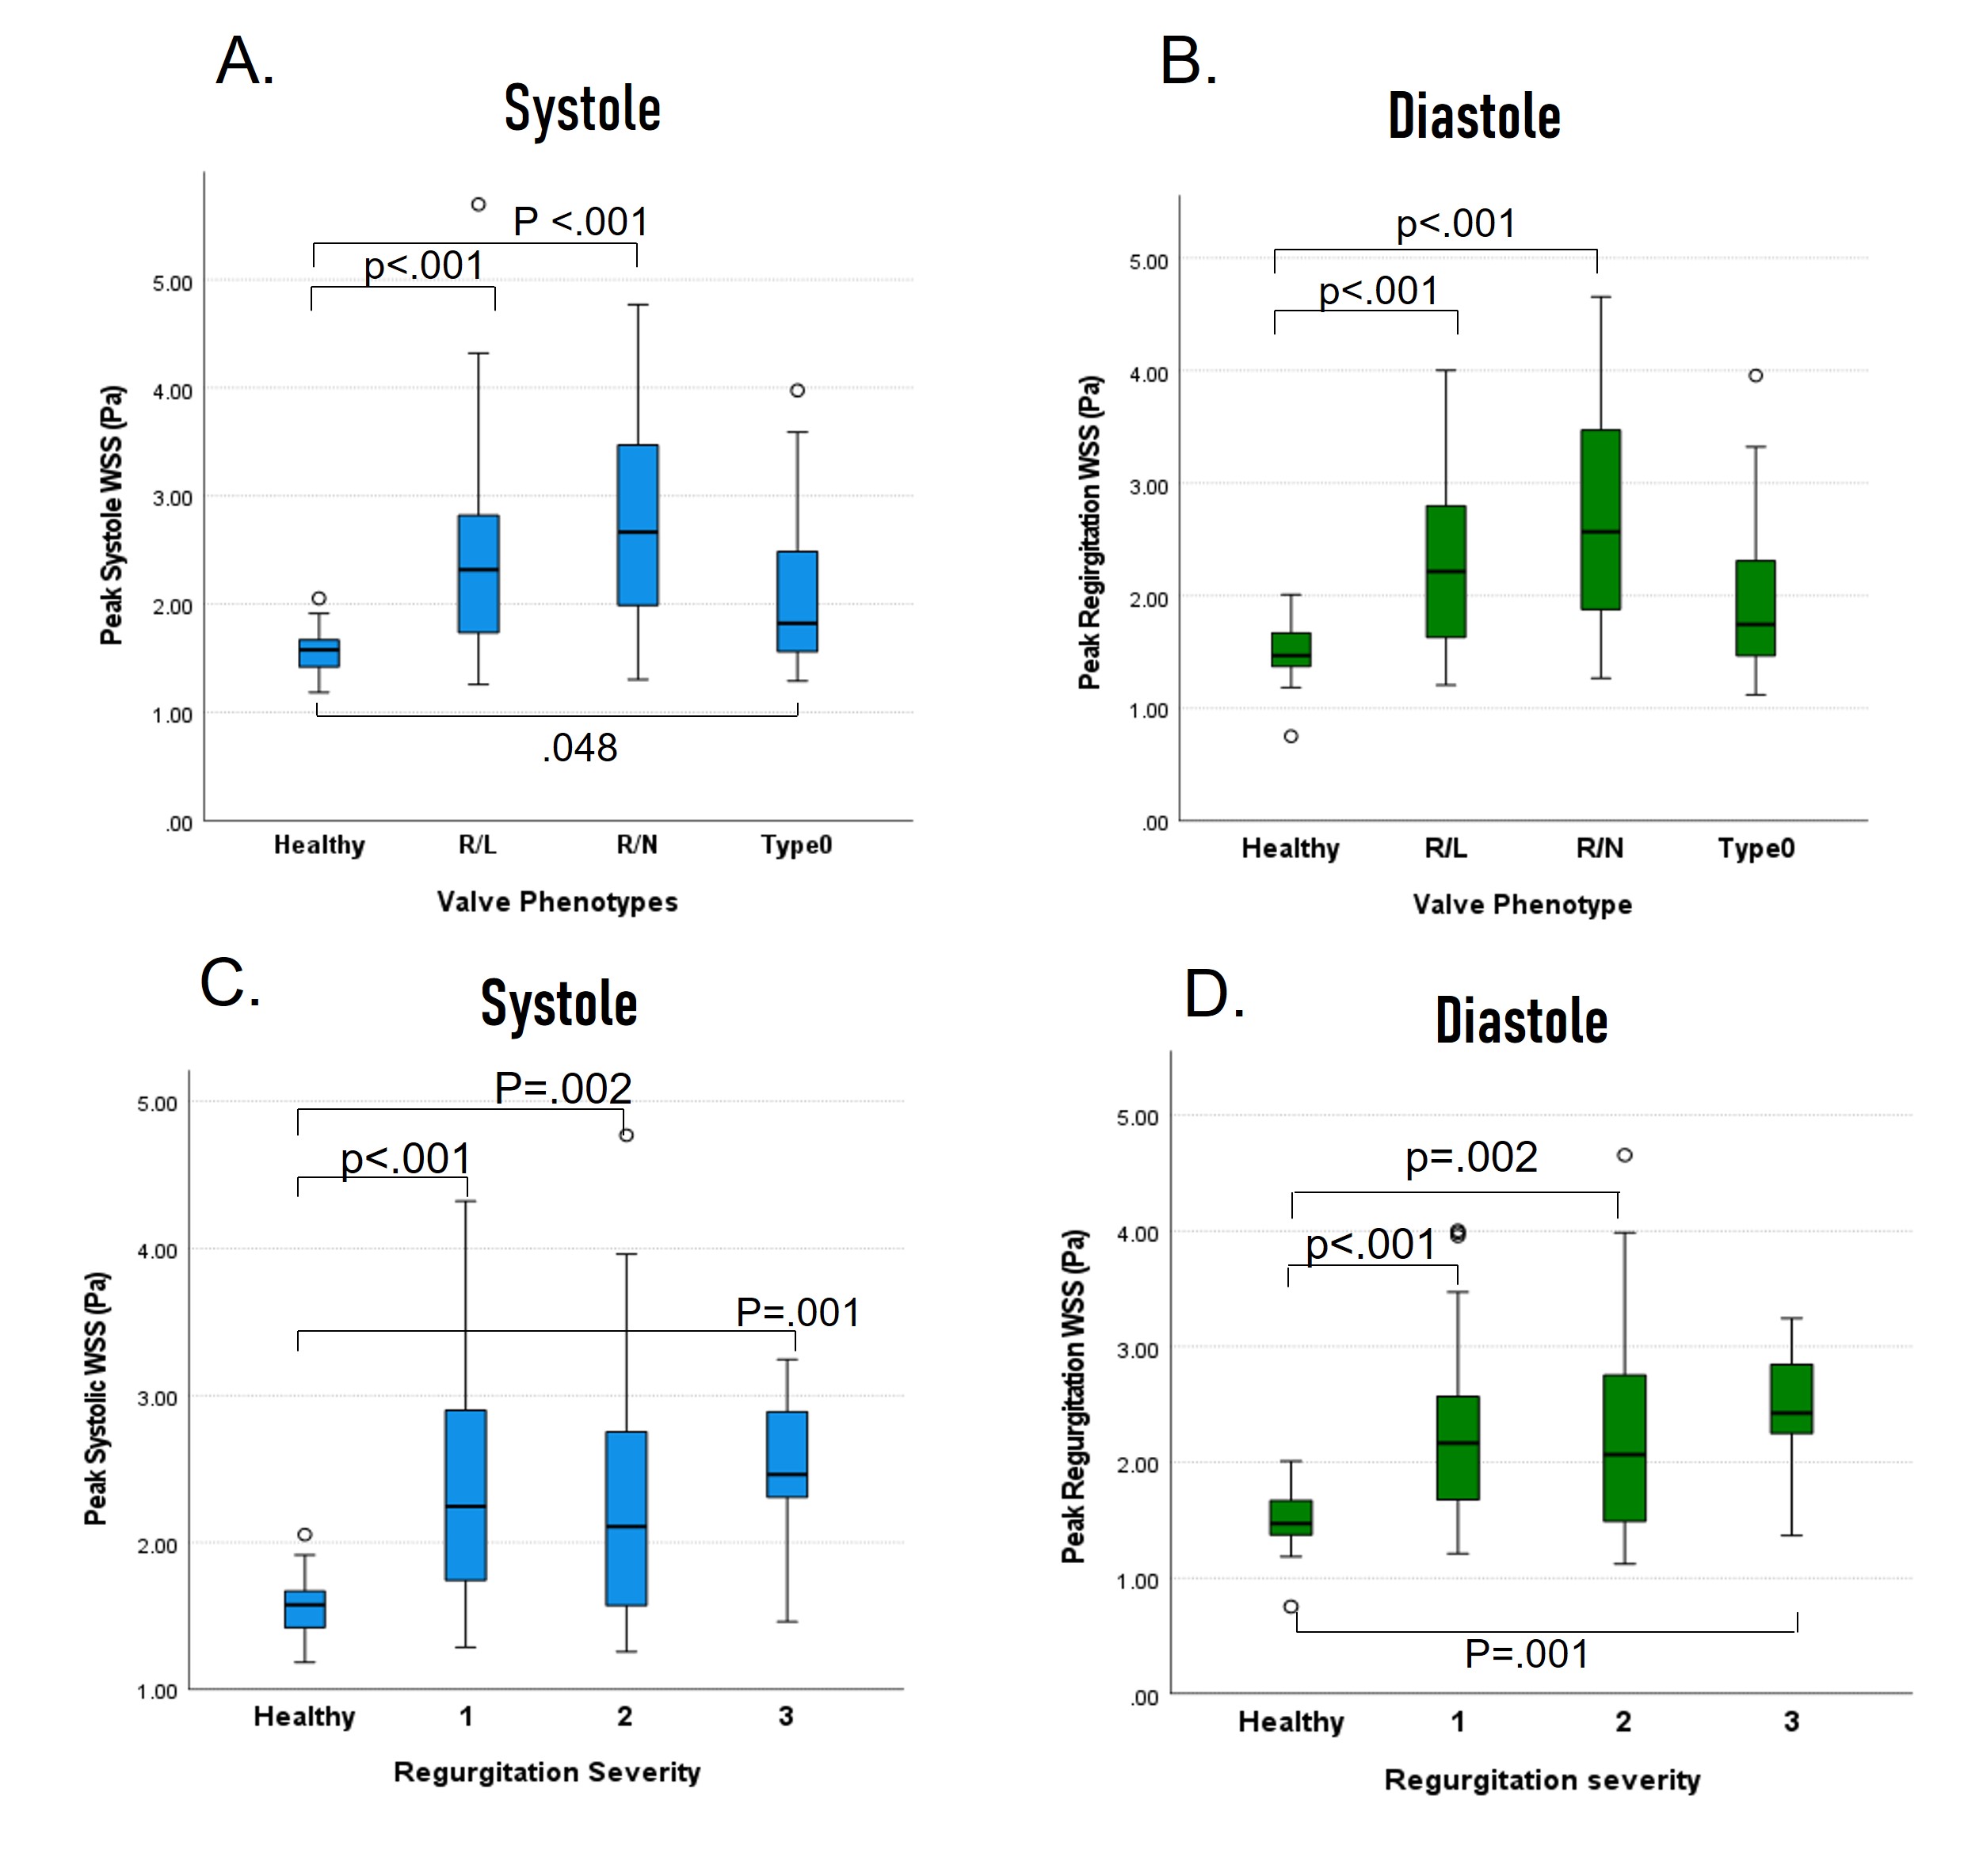
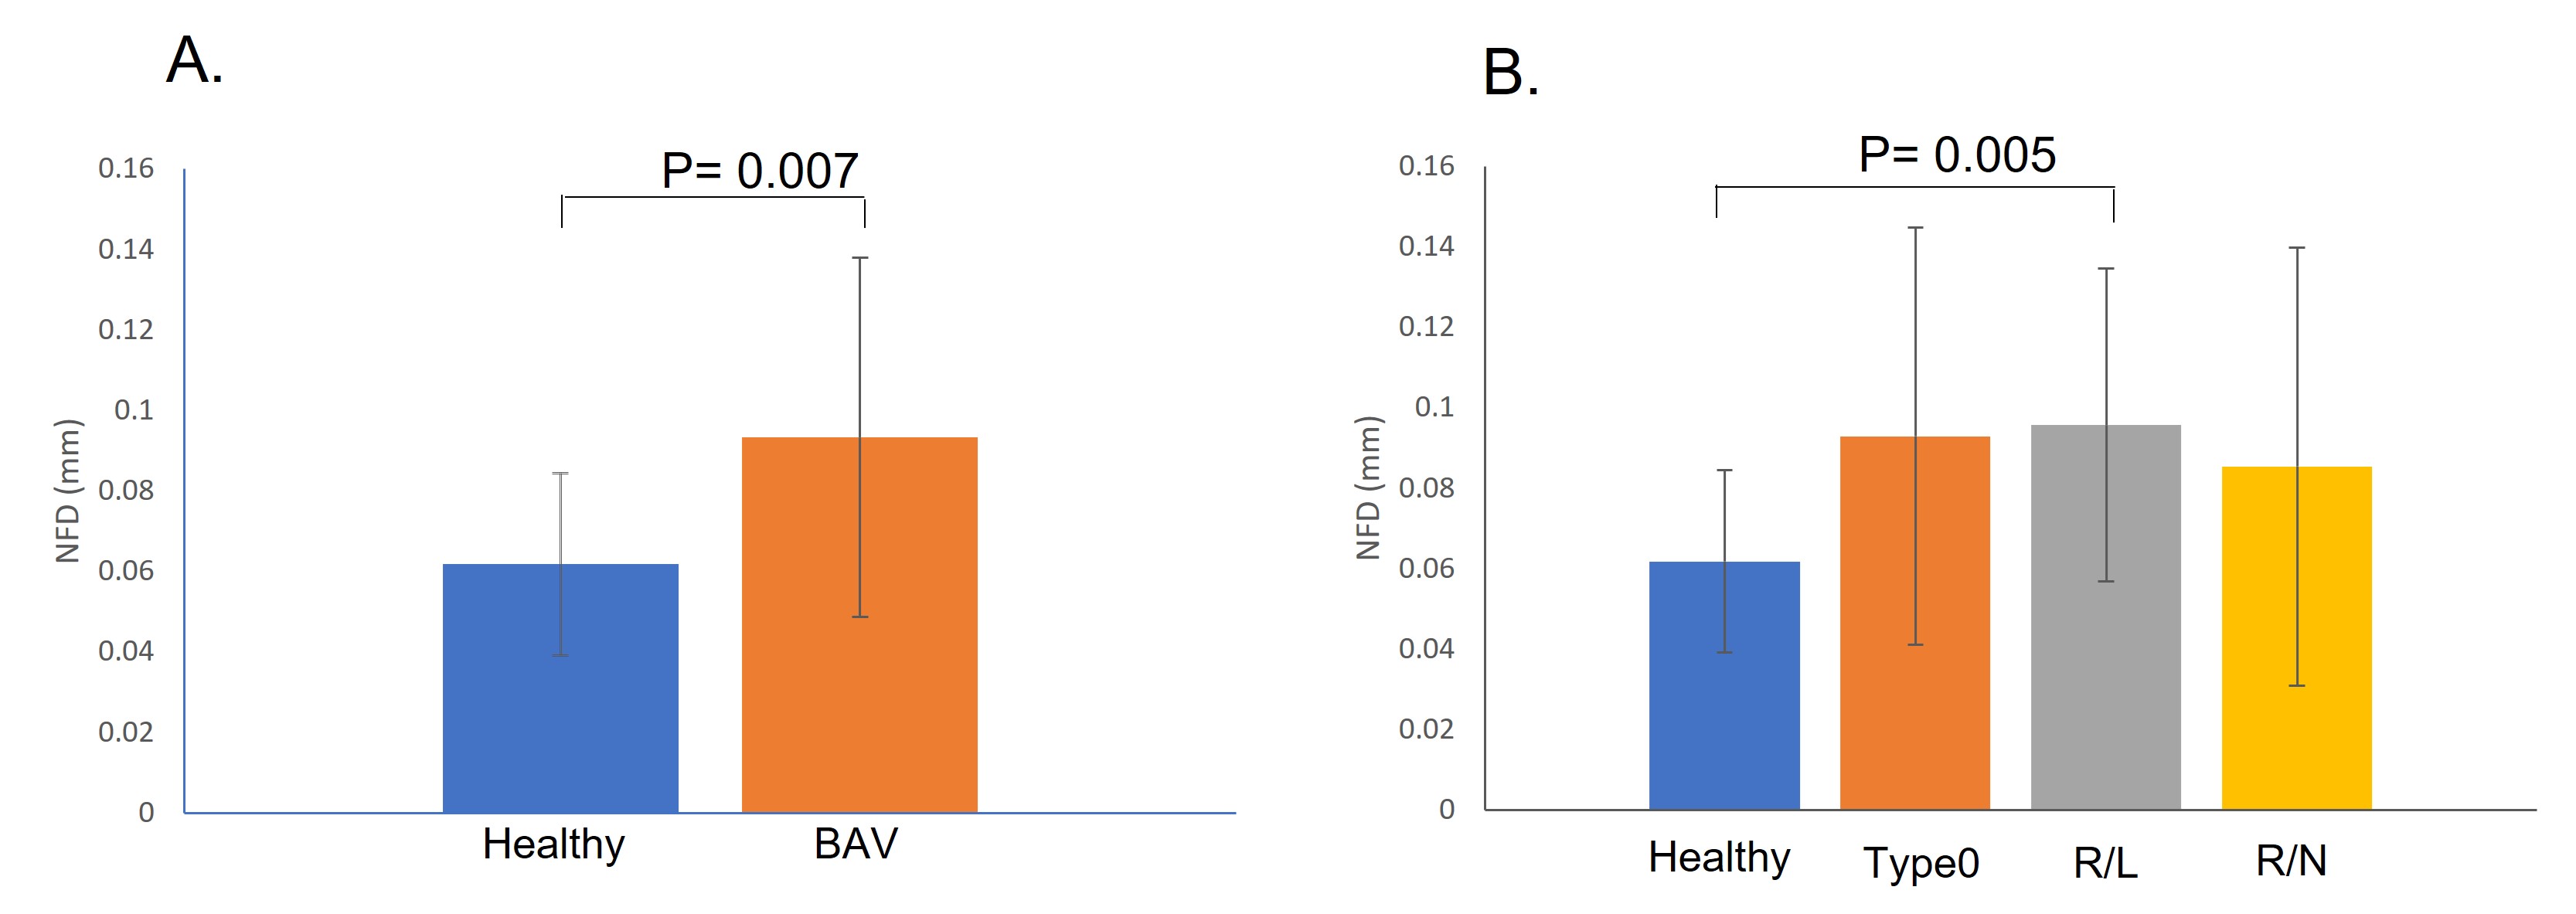
Table 1 illustrates BAV cohorts’ categorization. In all BAV phenotypes, the peak systolic WSS in the aortic root significantly differs from control. WSS at peak diastolic regurgitation timepoint was significantly different in R/L and R/N cusp fusions compared to control except for type 0 (p=0.09). Moreover, significant differences were observed in both peak systolic and peak regurgitation WSS in the aortic root among BAV cases considering regurgitation severities compared to controls (Figure 2).NFD showed a significant difference between the BAV and control cohorts (0.061±0.022 vs. 0.093±0.044 mm, p= 0.007) at the peak systolic timepoint in the plane at STJ. Nonetheless, among the available BAV phenotypes, a substantial difference in NFD was solely observed in the R/L phenotype compared to the healthy control (0.061±0.022 vs. 0.095±0.038 mm, p=0.005) (Figure 3).
NFD showed no significant difference between BAV subgroup and control at peak regurgitation. However, a significant difference was observed when comparing control and BAV with moderate-severe regurgitation (0.092±0.038 vs. 0.117±0.076 mm, p=0.03).
Discussion
We considered the peak regurgitation timepoint in BAV cohorts, in addition to the peak systolic timepoint, to assess the impact of the two parameters associated with vessel wall remodeling and injury, namely WSS and FD 7. WSS significantly differed at both timepoints compared to the healthy condition, except for type 0 during peak regurgitation, aligning with previous findings suggesting type 0 has a less pronounced effect on altering flow jet direction8. The significantly different diastolic WSS attributed to the regurgitation jet suggests that diastolic WSS could serve as a validated marker for aortopathy at the aortic root, similar to systolic WSS.While FD is suggested as a potential surrogate for wall shear stress in risk stratification9, we argue that it is less reliable compared to WSS as a predictor for root dilation in BAV patients.
Conclusion
Considering WSS in both retrograde and anterograde flows and their corresponding effects may provide early, subtle indications of the aortic root remodeling. This could ultimately lead to improved risk assessment, prognosis, and the quality of care for BAV patients with secondary valvular insufficiency who need regular follow-ups.Acknowledgements
No acknowledgement found.References
1. Nistri, S., Basso, C., Marzari, C., Mormino, P. & Thiene, G. Frequency of bicuspid aortic valve in young male conscripts by echocardiogram. Am J Cardiol 96, 718–721 (2005).
2. Bissell, M. M. et al. 4D Flow cardiovascular magnetic resonance consensus statement: 2023 update. Journal of Cardiovascular Magnetic Resonance 25, 40 (2023).
3. Markl, M. et al. Advanced flow MRI: emerging techniques and applications. Clin Radiol 71, 779–795 (2016).
4. Michelena, H. I. Speaking a common language: the international consensus on bicuspid aortic valve nomenclature and classification. Ann Cardiothorac Surg 11, 402 (2022).
5. Van Ooij, P. Phase contrast MRI in intracranial aneurysms. IEEE Trans Biomed Eng 58, 3447–3450 (2011).
6. Van Uitert, R. & Bitter, I. Subvoxel precise skeletons of volumetric data based on fast marching methods. Med Phys 34, 627–638 (2007).
7. Stalder, A. F. et al. Quantitative 2D and 3D phase contrast MRI: optimized analysis of blood flow and vessel wall parameters. Magnetic Resonance in Medicine: An Official Journal of the International Society for Magnetic Resonance in Medicine 60, 1218–1231 (2008).
8. Hattori, K. et al. Bicuspid aortic valve morphology and aortic valvular outflow jets: An experimental analysis using an MRI-compatible pulsatile flow circulation system. Sci Rep 11, 1–12 (2021).
9. Sigovan, M., Hope, M. D., Dyverfeldt, P. & Saloner, D. Comparison of four‐dimensional flow parameters for quantification of flow eccentricity in the ascending aorta. Journal of Magnetic Resonance Imaging 34, 1226–1230 (2011).
Figures
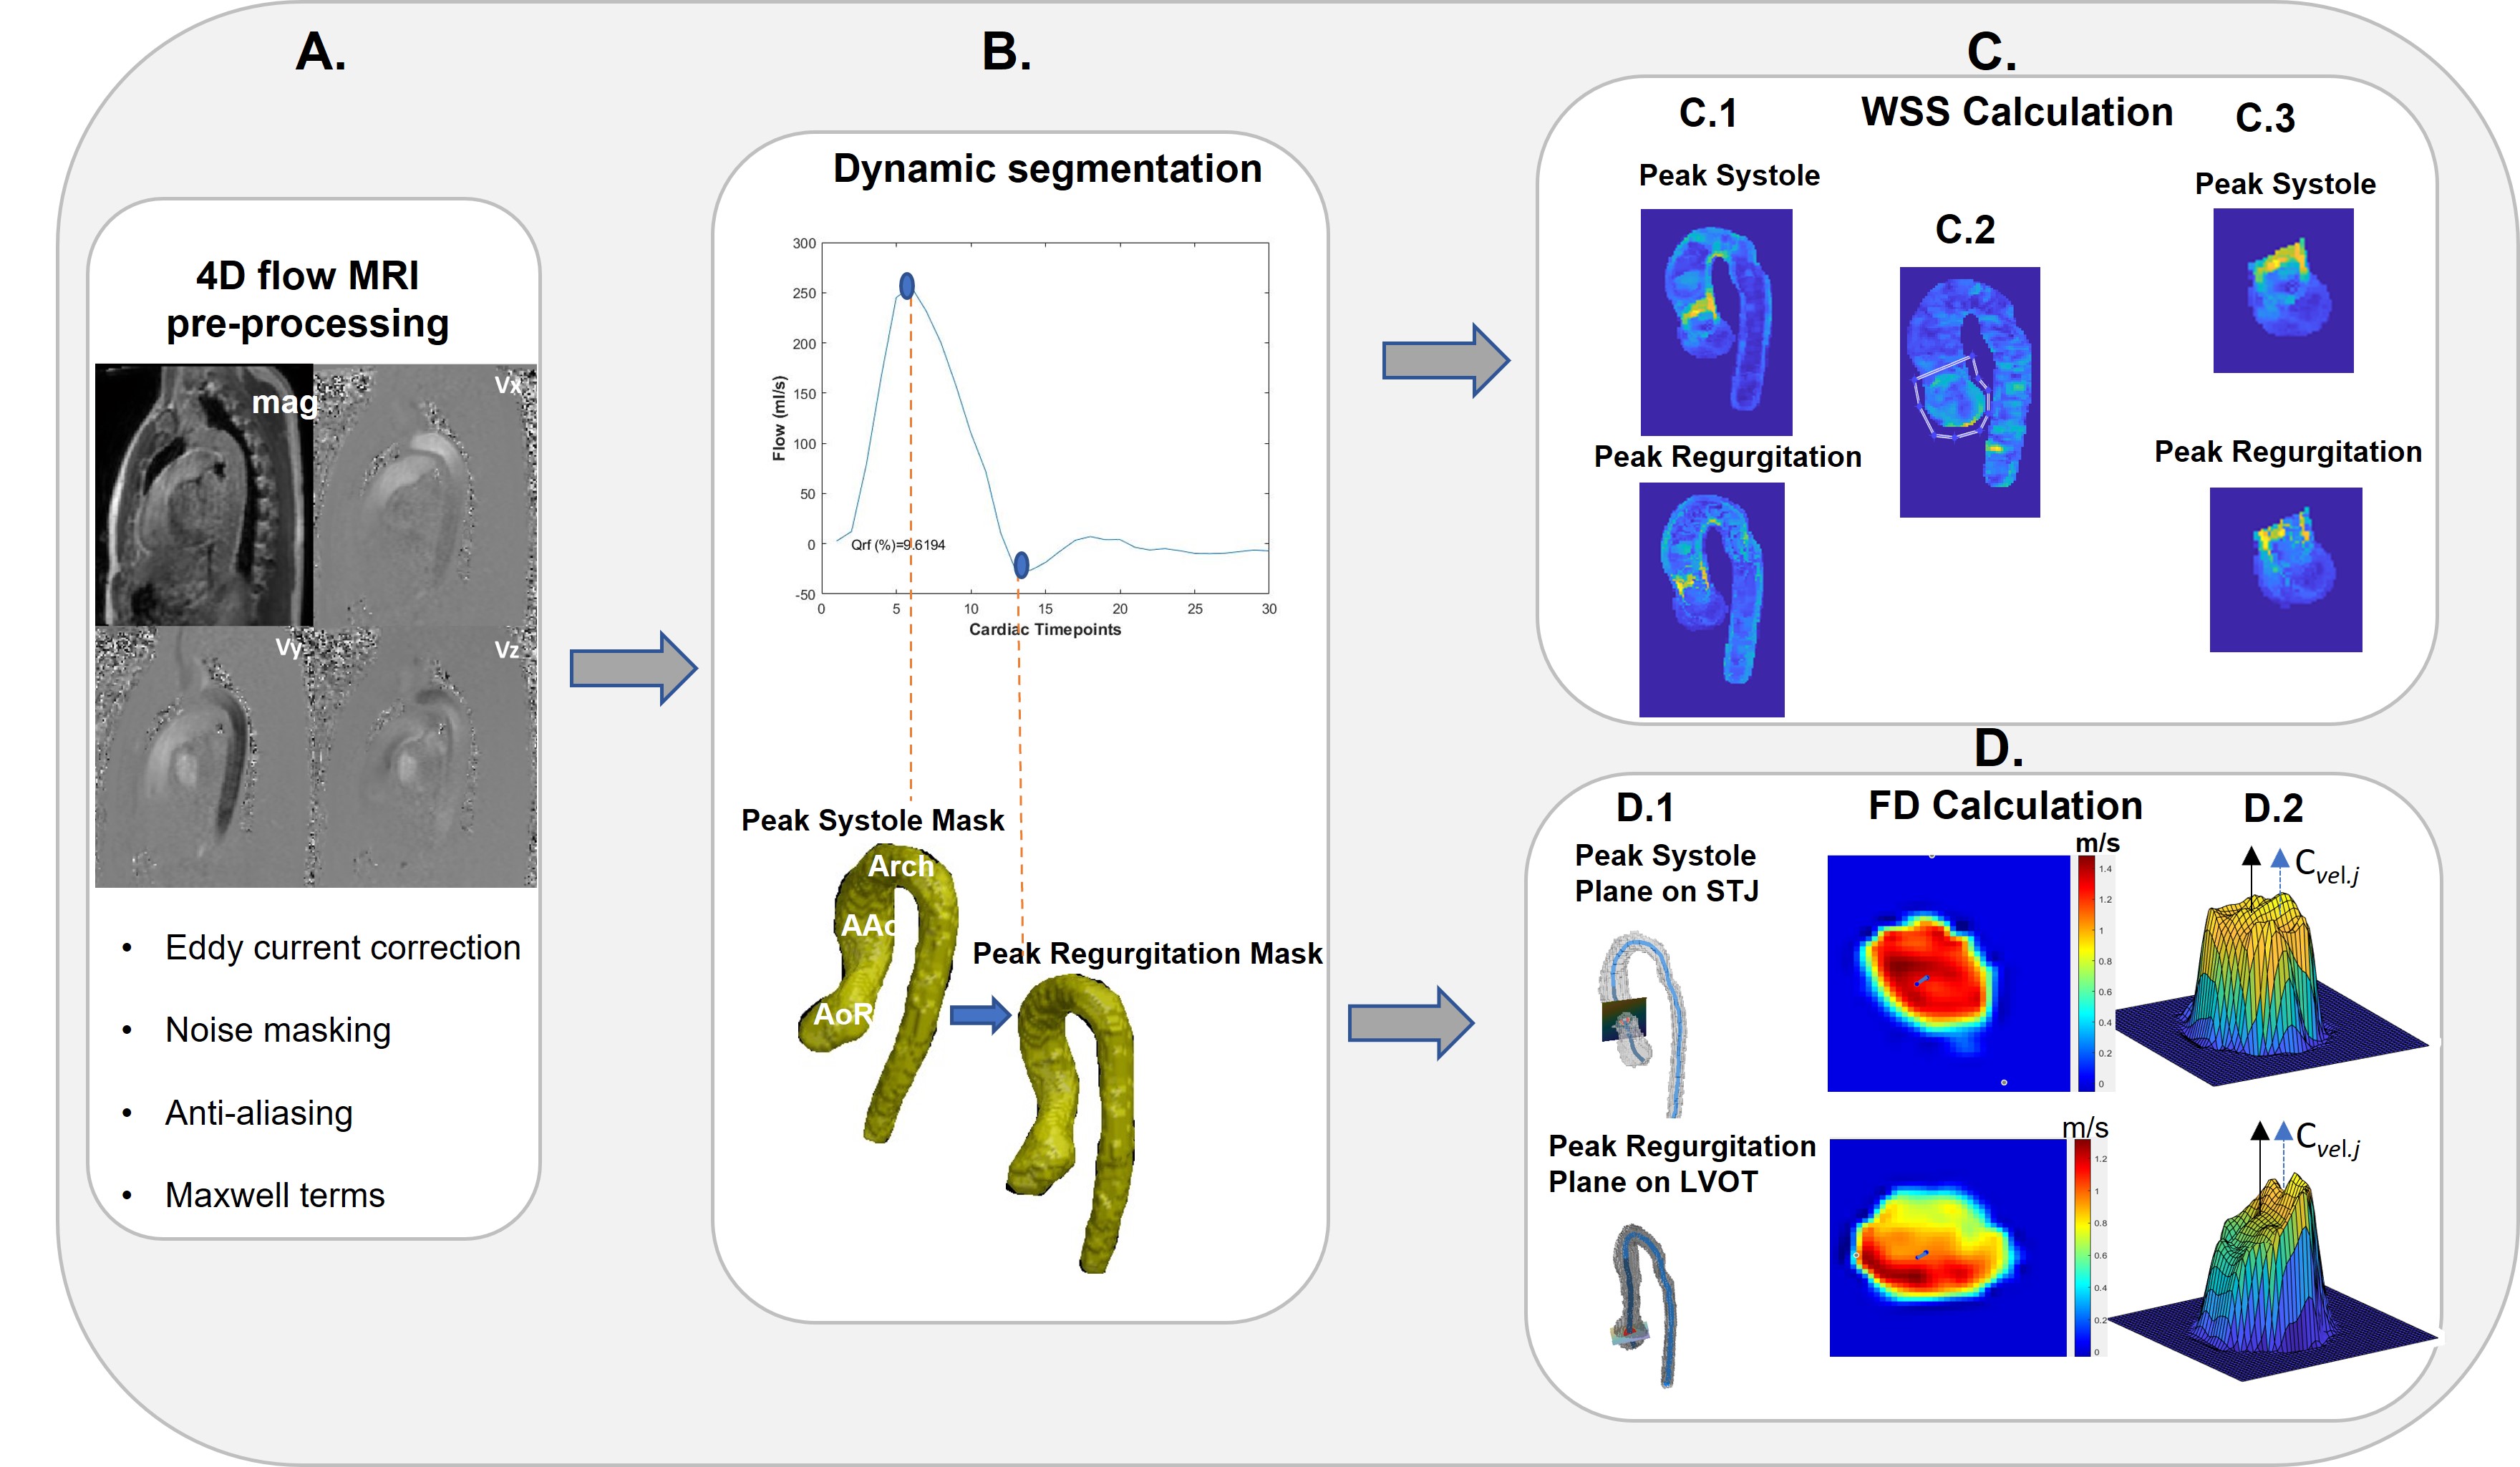
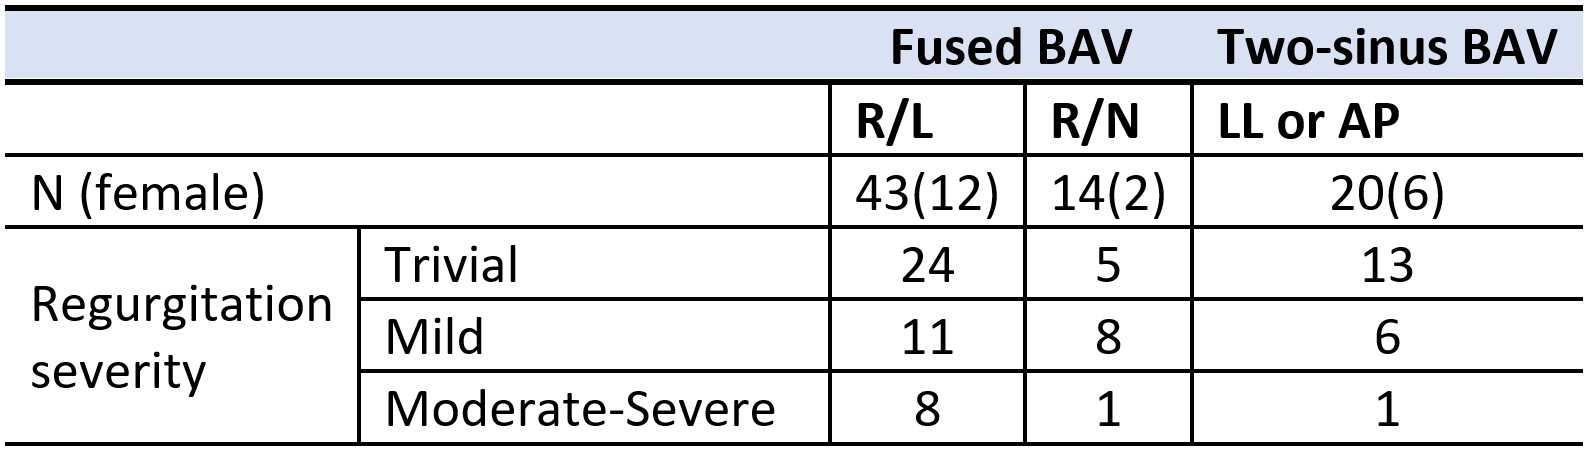
Table 1: Bicuspid Aortic Valve Categorization, BAV stands for bicuspid aortic valve; R/L, right and left coronary cusps fusion; R/N, right and non coronary cusps fusion; LL and AP, laterolateral and anteroposterior two-sinus BAV phenotypes respectively.