4776
Neural Network-based Classification of Aortic Stenosis Severity and Velocity Inlet Prediction from Cine 2D Flow MRI1D-ITET, ETH Zurich, Zurich, Switzerland
Synopsis
Keywords: Flow, Cardiovascular, Analysis/Processing, Aortic Stenosis, Blood Vessels, Cardiovascular, Data Analysis, Data Processing, Flow, In Silico, Machine Learning/Artificial Intelligence, Simulations, Velocity
Motivation: Imaging stenotic aortic valves using cine 2D and 4D Flow-MRI is compromised by flow-related image artefacts, making estimation of the effective orifice area challenging.
Goal(s): To estimate aortic valve orifice area and inlet velocity profiles from 2D PC-MRI slices, acquired downstream of the aortic valve.
Approach: Synthetic 2D PC-MRI slices were generated from personalized synthetic flow simulations of pulsatile flow in realistic stenosed aortae.
Two U-Nets were trained to predict valvular orifice and inlet velocity profiles.
Results: This work demonstrates that classification of aortic stenosis and prediction of peak systolic velocities from synthetic 2D PC-MRI slices acquired downstream of the valve is possible.
Impact: Our work indicates that aortic valvular orifice area and inlet velocity profiles can indeed be predicted from a few cine 2D PC-MRI slices acquired downstream of the valve. The approach potentially enables time-efficient standard imaging using a few breathheld scans as available on all clinical MR systems.
Introduction
Aortic stenosis (AS) is the most common valve disease in developed countries. The presence of AS severely affects the flow in the aorta and quantifying its severity (e.g. area reduction) is fundamental to inform diagnosis and guide treatment1.The use of 4D flow MRI to assess valvular anatomy and flow involves relatively long scans and may lead to inaccuracies due to the limited spatial resolution and flow-related image artefacts. Additionally, 4D flow MRI sequences may not be available on all scanners. Accordingly, approaches are sought to allow for aortic valve assessment using standard cine 2D PC-MRI acquired in a few planes downstream of the aortic valve.
Taking inspiration from echocardiography2,3 utilizing deep learning methods to predict the degree of stenosis, the present study seeks to investigate the possibility of using 2D PC-MRI slices located downstream of the aortic valve to estimate aortic valve area and the inlet velocity profile.
We test the approach on a synthetically generated dataset of personalized 4D time-varying pulsatile flow CFD simulations, modelling different stages of aortic severity on realistic aortic anatomies from which 2D PC-MRI slices are extracted.
Methods
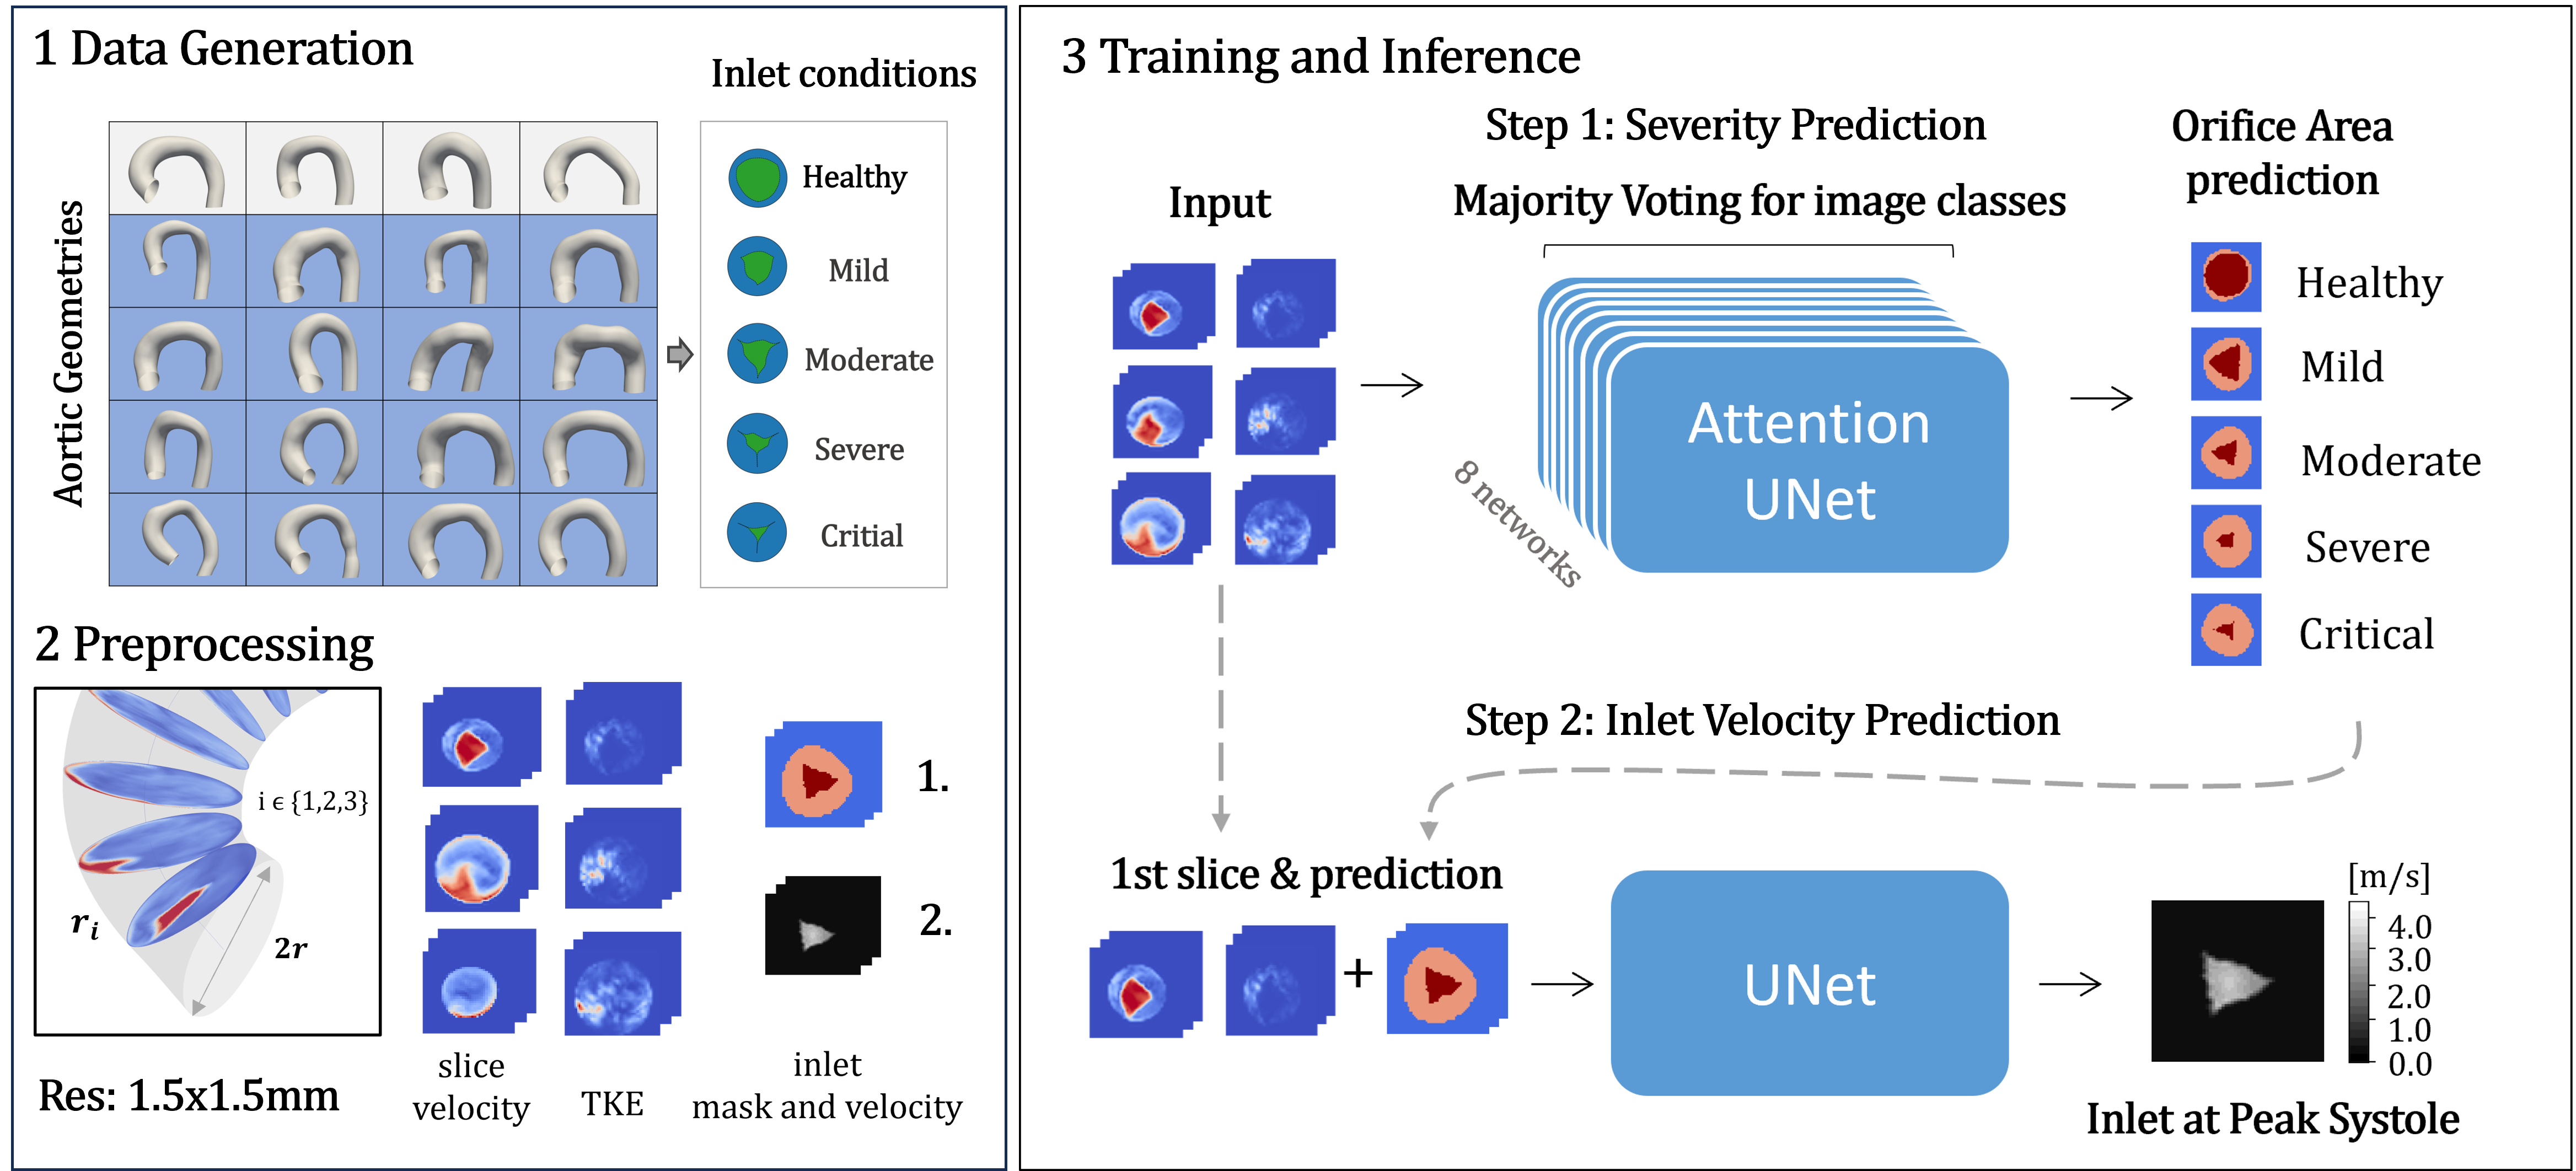
Personalised CFD data with pulsatile flow were used to train two convolutional neural networks. One network was used to first predict the valve orifice area across the cardiac cycle and the second to subsequently predict the inlet velocity profile at peak systole. High-resolution CFD data was generated for 20 subjects with varying degrees of stenosis (healthy, mild, moderate, severe, critical)4. The aortic shapes were based on meshes from healthy5 and stenosed aortae6.The synthetic 2D PC-MRI data consisted of 3 slices perpendicular to and positioned along the aortic centerline downstream of the aortic valve (Figure 1). Velocity and turbulence kinetic energy (TKE) were projected to typical 2D PC-MRI resolution of 1.5 x 1.5 mm², and normalized between [0,1]. The target inlet prediction was composed of 3 classes: background, calcified valve and stenotic orifice.
For training, the images were upsampled to 64 x 64 pixels using spline interpolation and Gaussian noise with a standard deviation of was added to obtain realistic signal-to-noise ratios . The data was cropped around systolic frames and split into train, validation and test set resulting in a total of 800, 400, 400 respective images for all severities.
The batch size was selected to align with the duration of one cardiac cycle. The Huber loss8 was applied. Early stopping and a reduction of the learning rate on plateau prevented overfitting.
Eight multi-model attention U-Nets9 were trained to predict inlet masks across the cardiac cycle. The final mask prediction was determined by averaging the results from the eight network votes (Figure 1). Next, a multi-model U-Net was pretrained to relate the velocity and TKE fields of the first slice and the predicted inlet masks onto the inlet velocity field, allowing to predict the peak systolic velocity.
Results
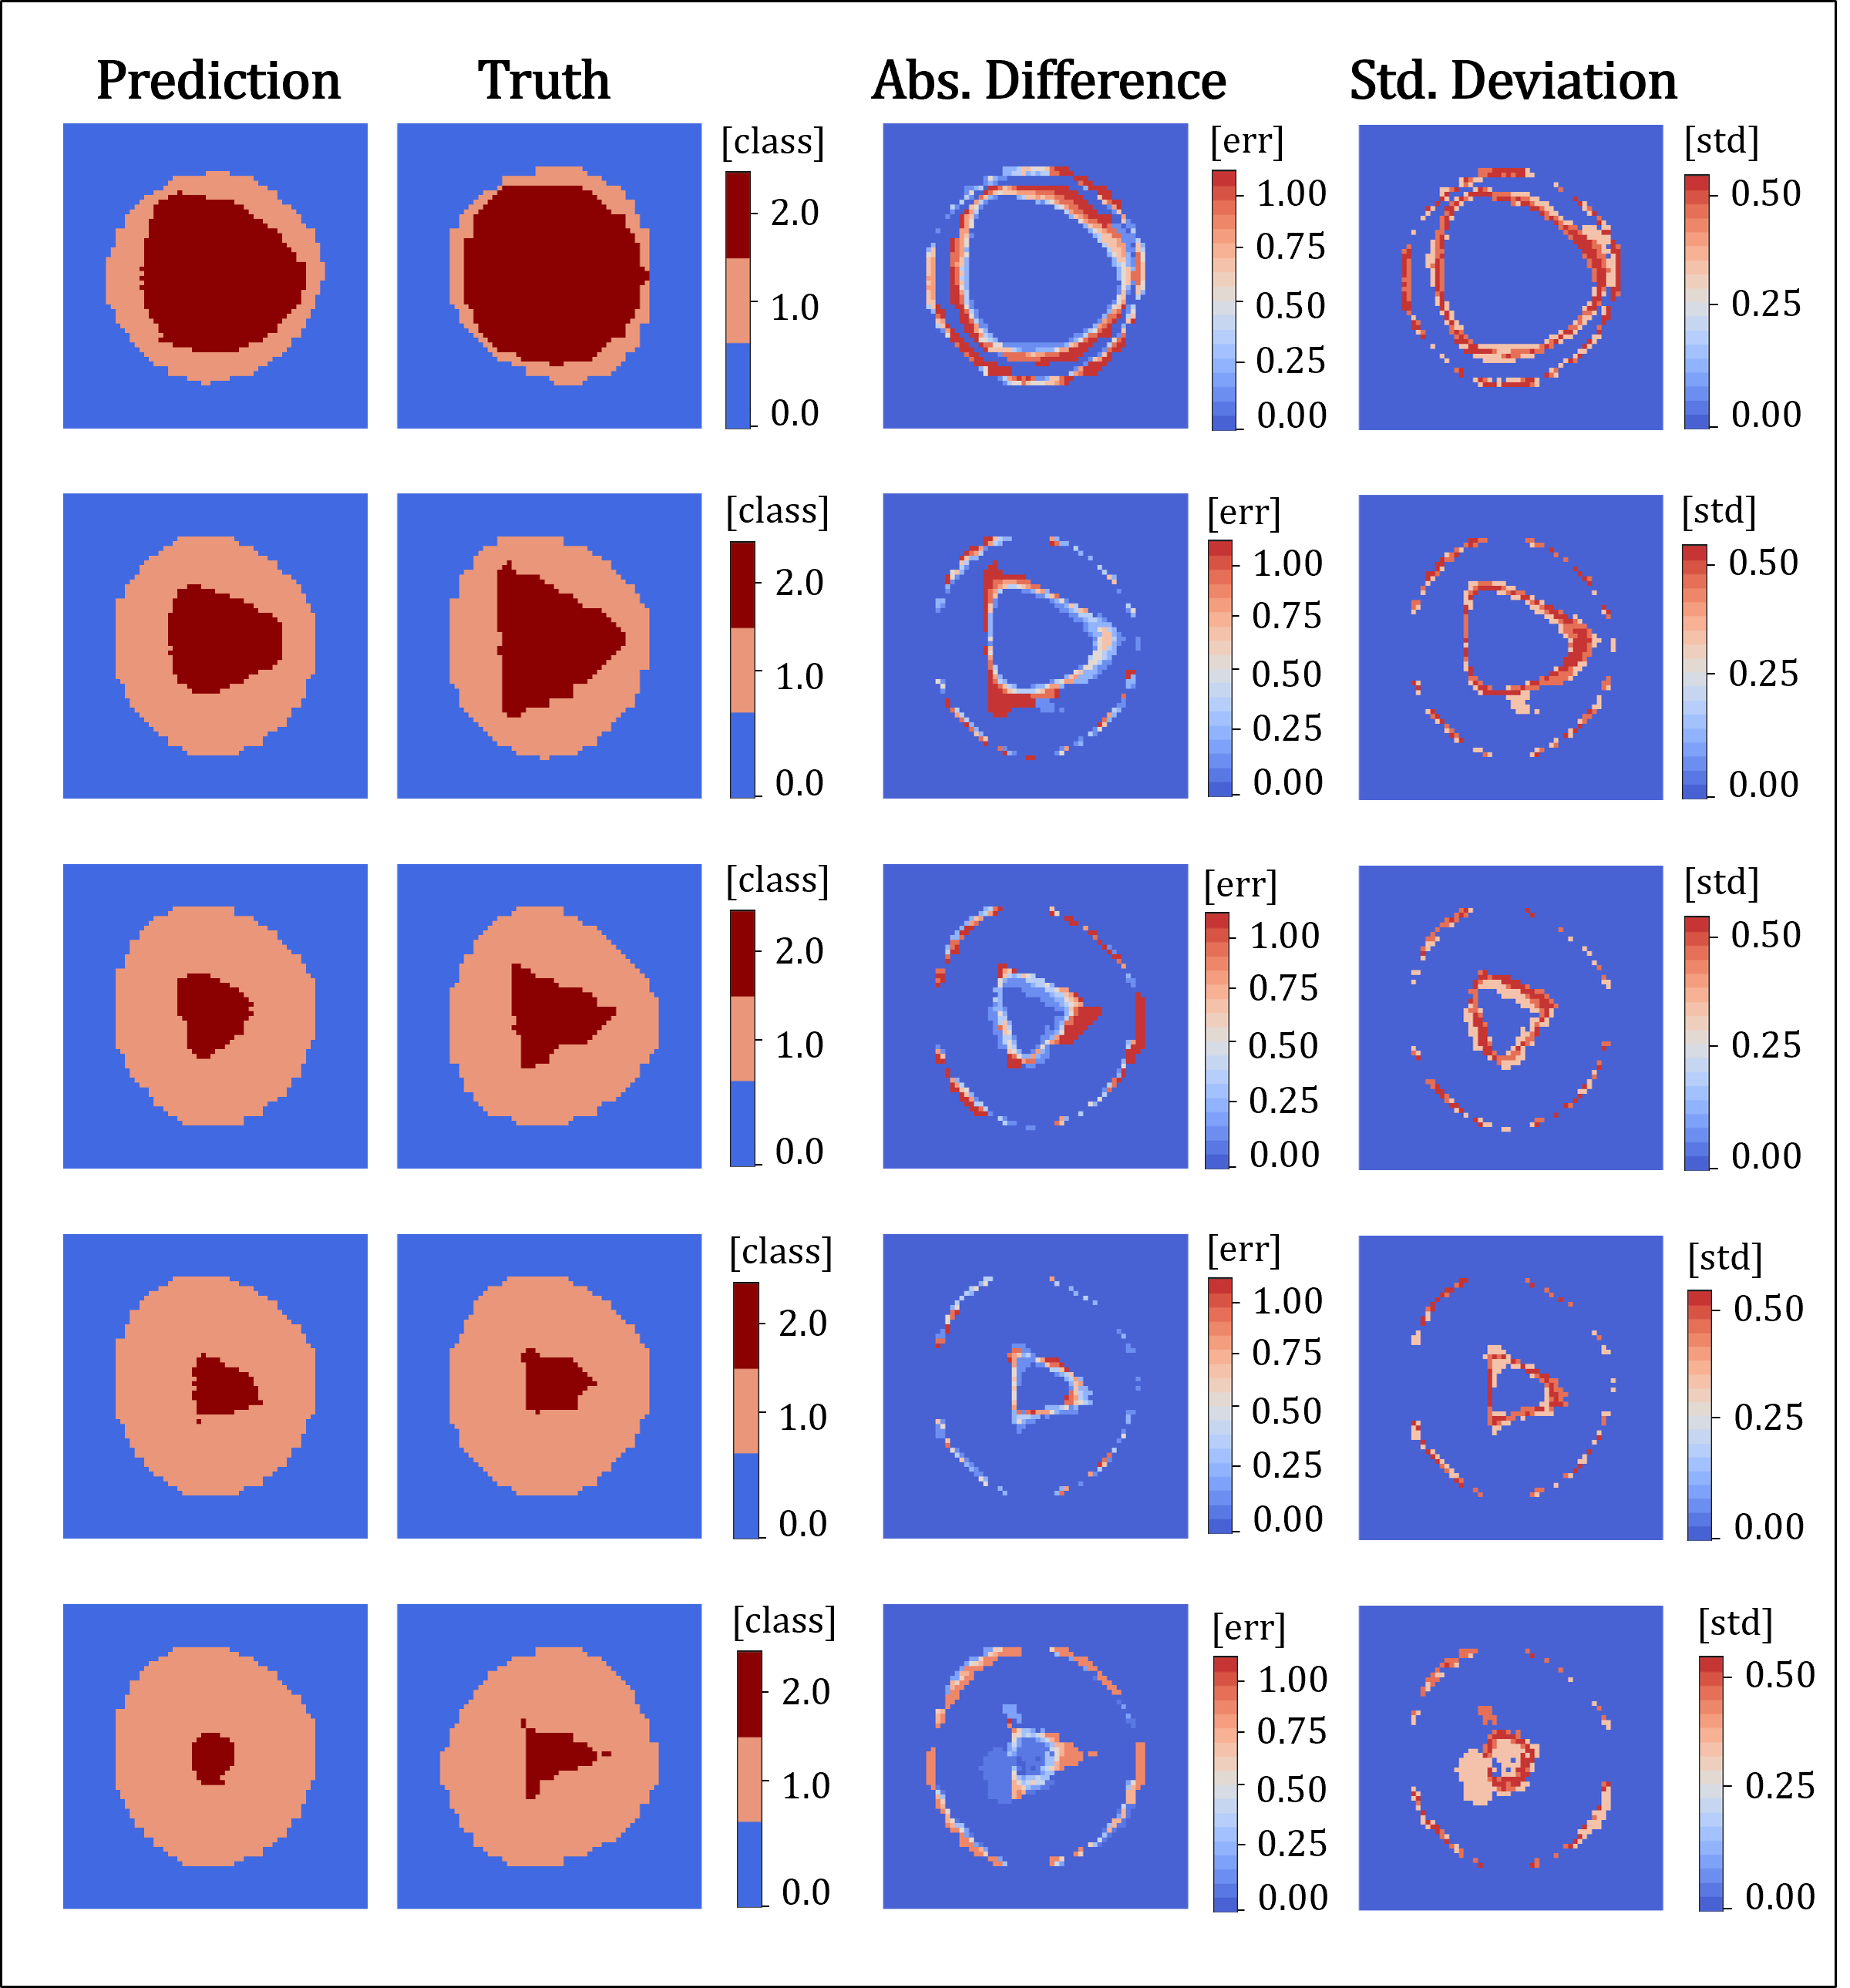
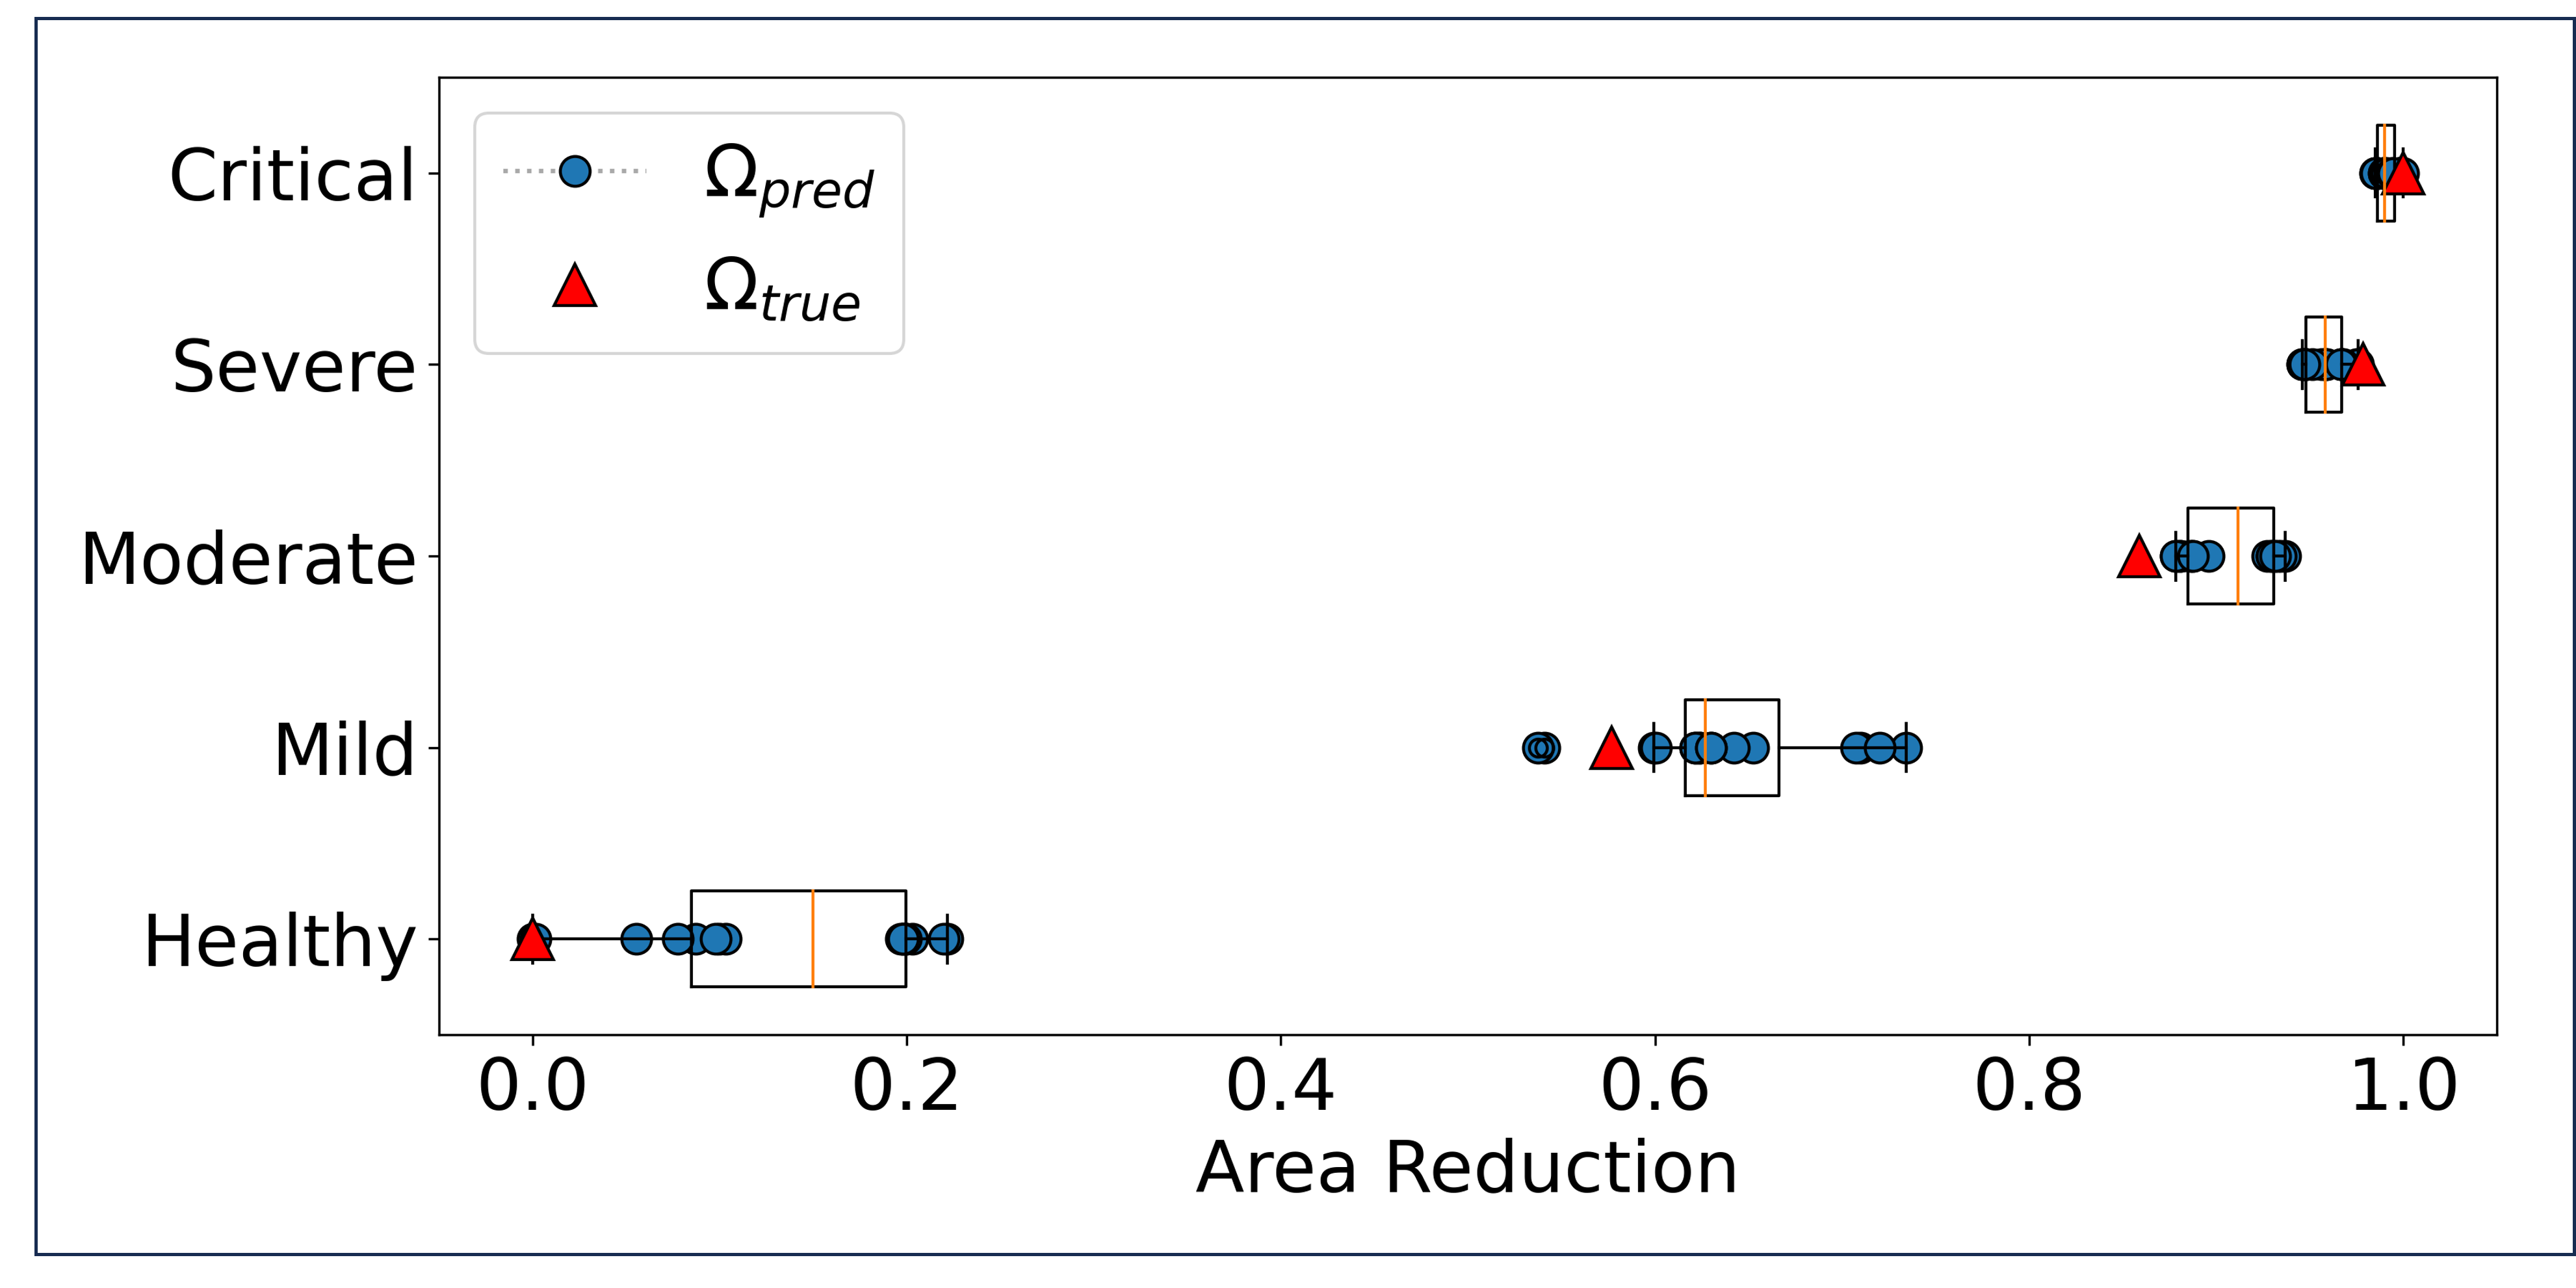
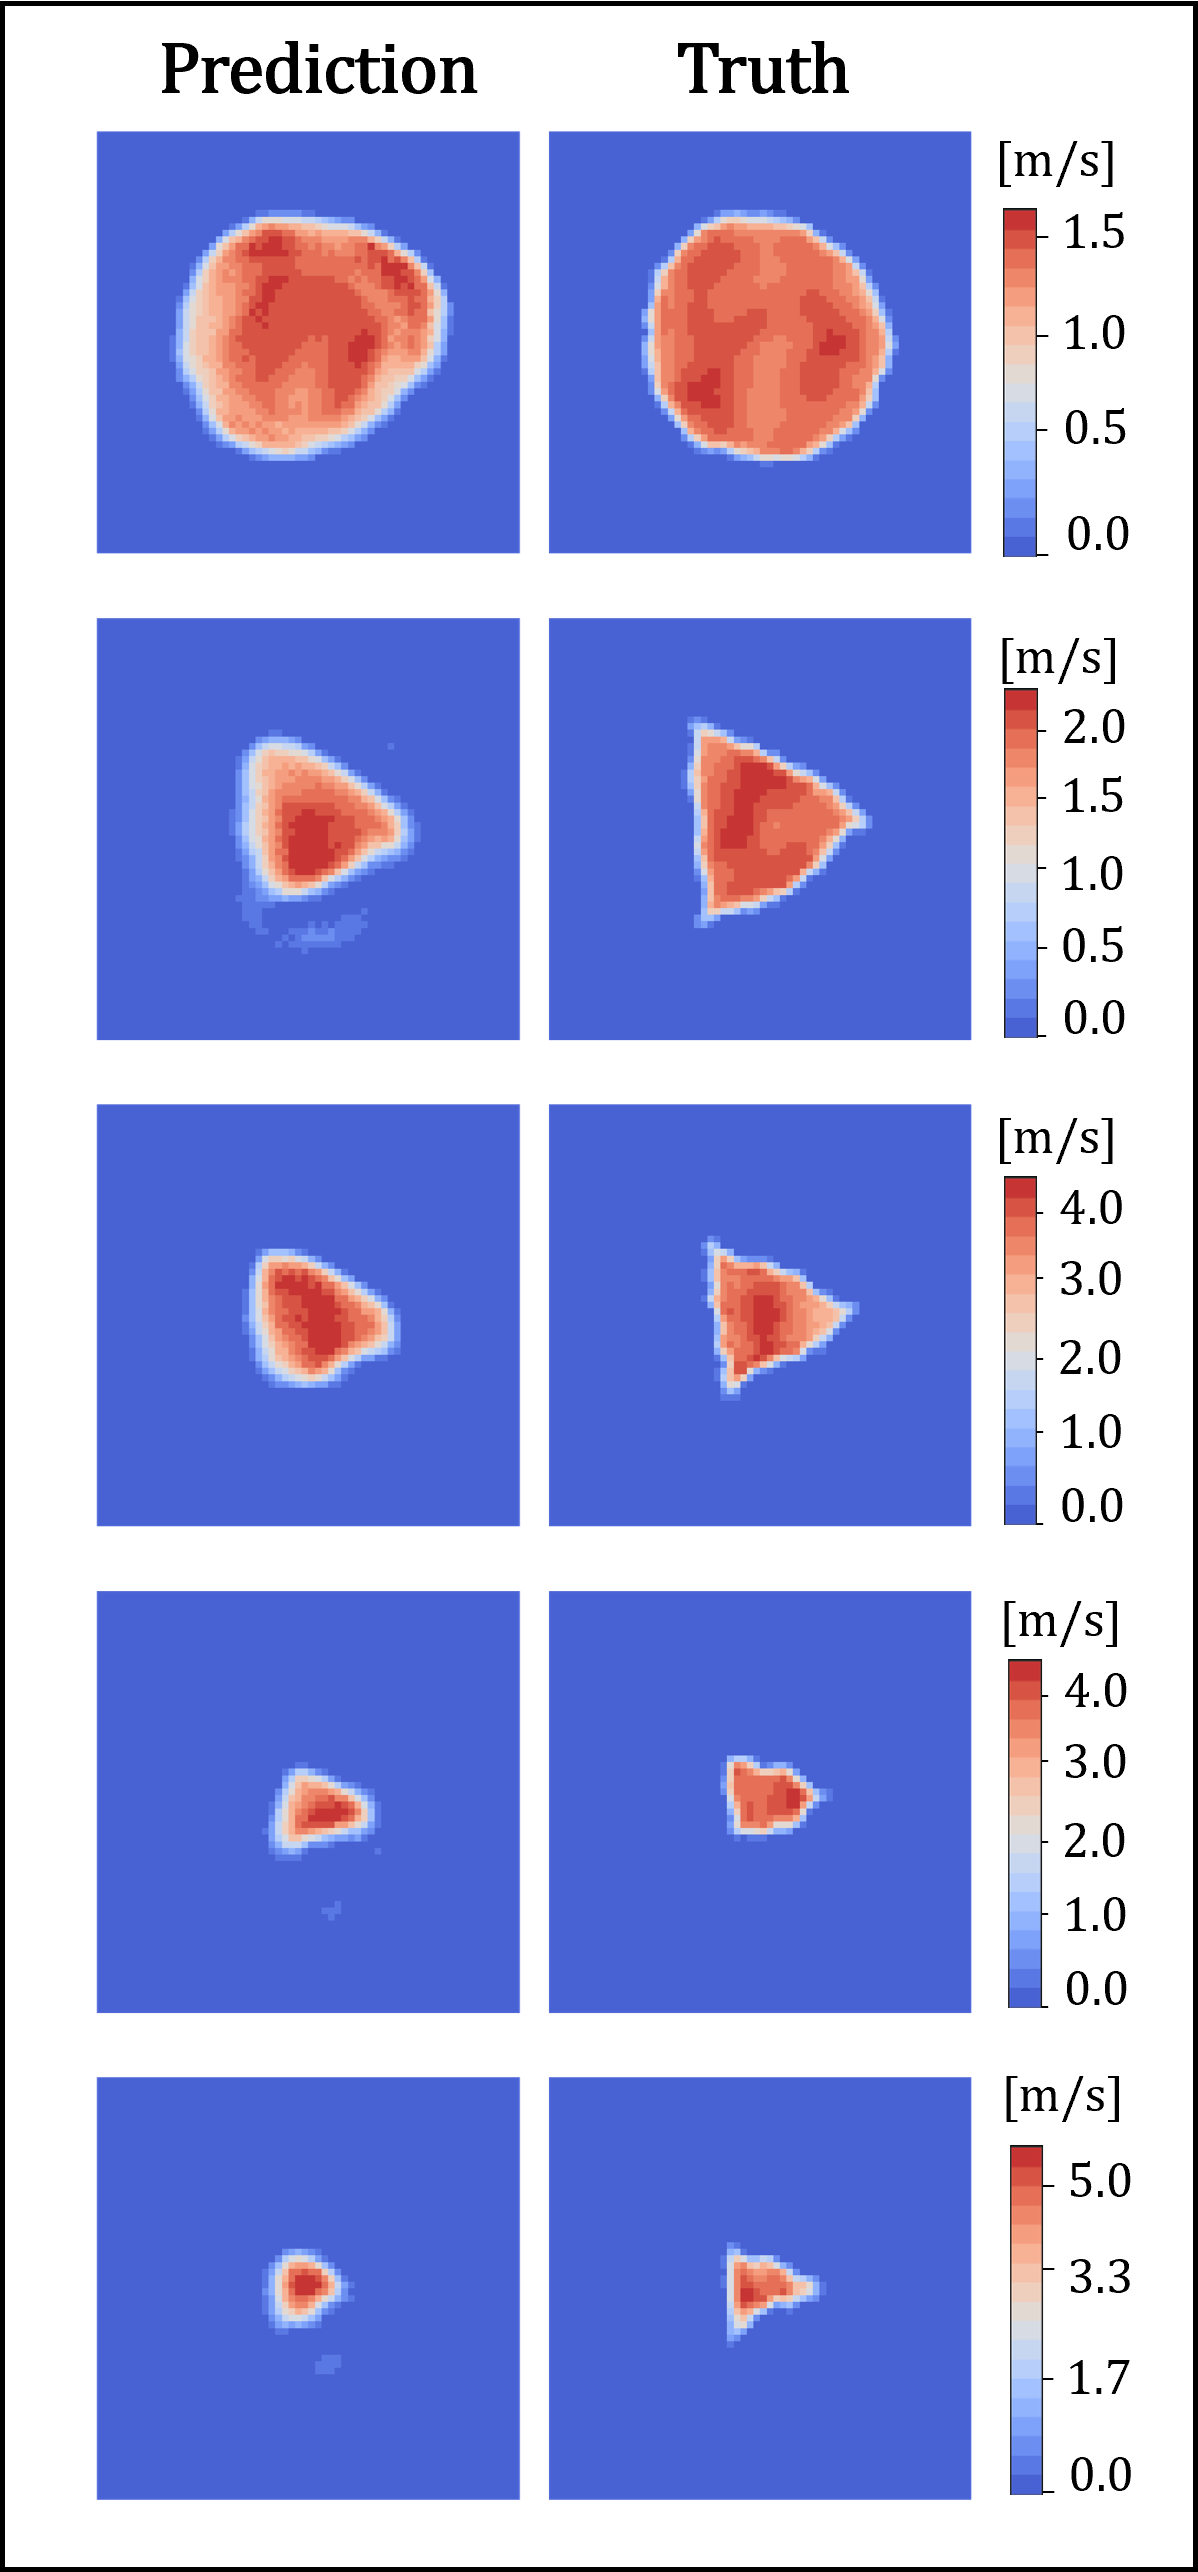
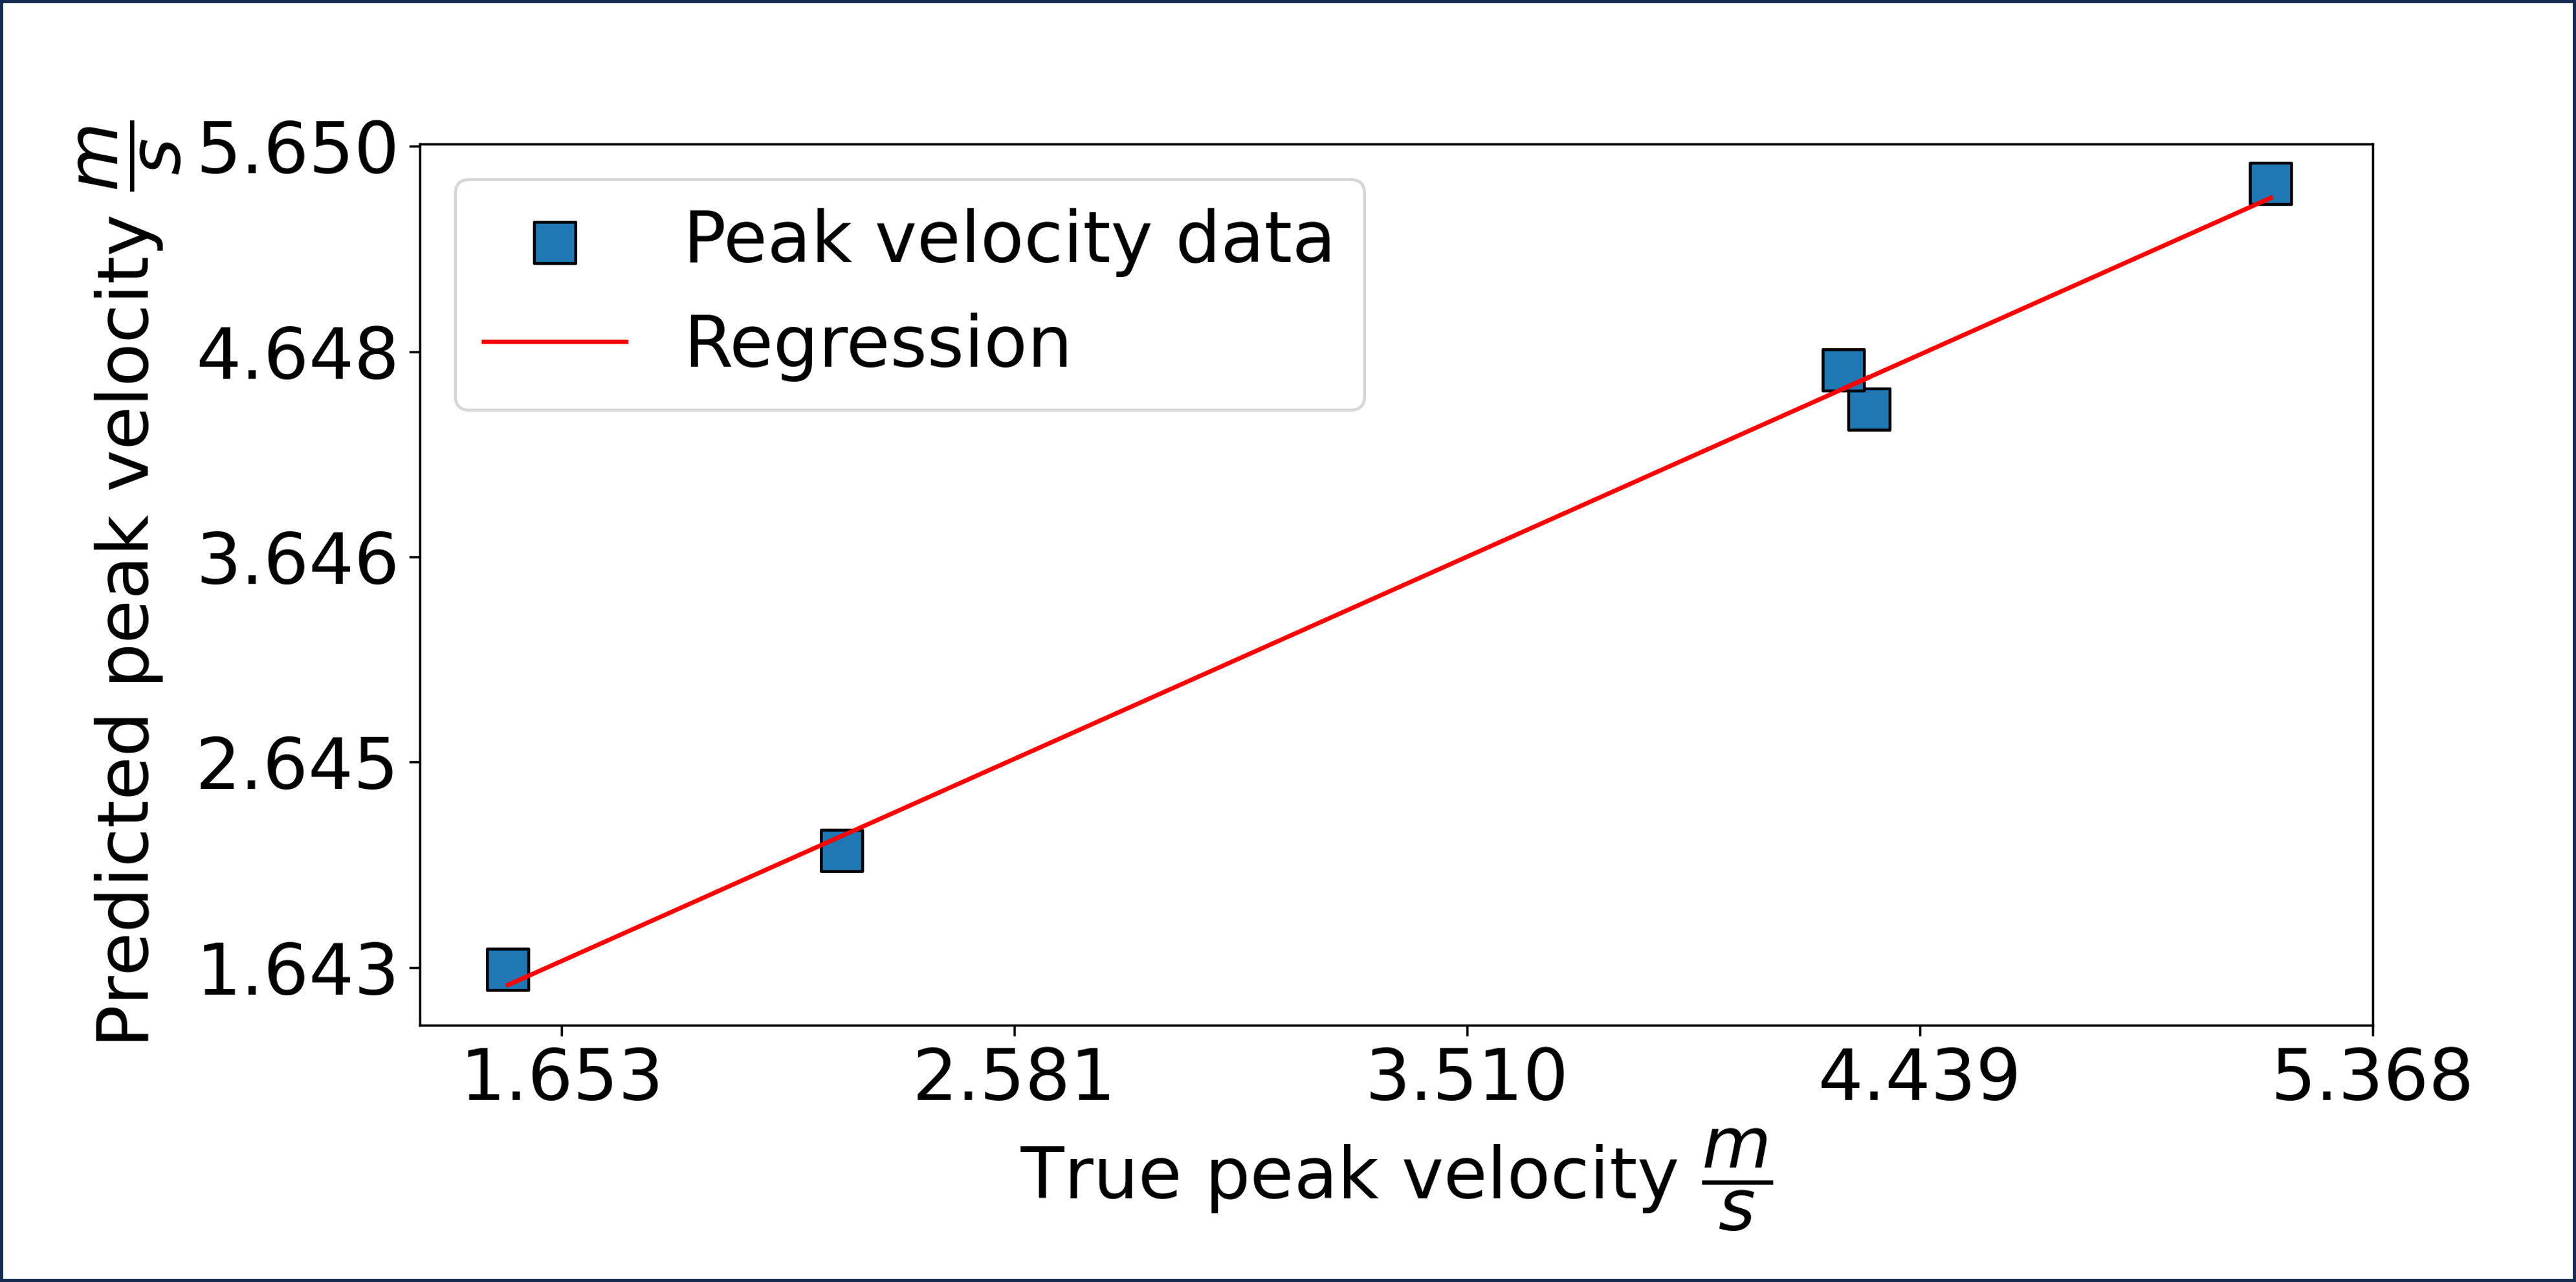
Figure 2 shows an example of the mean inlet mask prediction (left) with the true mask (second from left), the absolute error (second from right) and standard deviation (right) for each stenosis degree. Based on the aortic and orifice mask areas, the area ratio $$$\Omega = \frac{Area_{stenosis}}{Area_{inlet}}$$$ was computed and normalised between [0,1] to calculate the area reduction as $$$1 - \Omega_{norm}$$$. The boxplots in Figure 3 illustrate clustered case predictions for area reduction, with the individual predictions $$$\Omega_{pred}$$$ in blue and the true values $$$\Omega_{true}$$$ as red triangles.The predicted and renormalised inlet velocity fields across different stenosis severities are outlined in Figure 4 and compared against the true images. Finally, the correlation of peak systolic velocity values are plotted in Figure 5.
Discussion and Conclusion
We have presented a deep-learning approach for estimating inlet velocity masks, velocity fields and peak velocity values from standard cine 2D PC-MRI acquired along the aortic centreline. The method allowed to correctly classify aortic stenotic severity in the test dataset and to estimate the shape of the orifice. Additionally, we have demonstrated that prediction of peak velocity values is possible with an overall error below 6.7%.In future work, these predictions could be coupled with information of a statistical shape model to enhance robustness and performance, gaining additional insights to better understand formation and progression of aortic stenosis.
Acknowledgements
No acknowledgement found.References
1. Lester S, McElhinney D, Miller J, et al. Rate of Change in Aortic Valve Area During a Cardiac Cycle Can Predict the Rate of Hemodynamic Progression of Aortic Stenosis. Circulation.2000; 10.1161/01.CIR.101.16.1947.
2. Kwon JM, Lee SY, Jeon KH, et al. Deep Learning-Based Algorithm for Detecting Aortic Stenosis Using Electrocardiography. J Am Heart Assoc. 2020;10.1161/JAHA.119.014717.
3. Holste G, Oikonomou EK, Mortazavi BJ, et al. Severe aortic stenosis detection by deep learning applied to echocardiography. Eur Heart J. 2023;10.1093/eurheartj/ehad456.
4. Dirix P, Buoso S, Peper ES, Kozerke S. Synthesis of patient-specific multipoint 4D flow MRI data of turbulent aortic flow downstream of stenotic valves. Sci Rep. 2022;12(1):16004.
5. Ferdian E, Dubowitz D, Mauger C, et al. WSSNet: Aortic Wall Shear Stress Estimation Using Deep Learning on 4D Flow MRI. Front Cardiovasc. Med. 2022;10.3389/fcvm.2021.769927.
6. Romero P, Lozano M, Martínez-Gil F, et al. Clinically-Driven Virtual Patient Cohorts Generation: An Application to Aorta. Front Physiol. 2021;10.3389/fphys.2021.713118.
7. Yevtushenko P, Goubergrits L, Franke B, et al. Modelling blood flow in patients with heart valve disease using deep learning: A computationally efficient method to expand diagnostic capabilities in clinical routine. Front. Cardiovasc. Med. 2023;10.3389/fcvm.2023.1136935.
8. Huber P. Robust Estimation of a Location Parameter. Annals of Mathematical Statistics, 1964; 10.1214/AOMS/1177703732.
9. Oktay O, Schlemper J, Folgoc L , et al. Attention u-net: Learning where to look for the pancreas. arXiv preprint. 2018; arXiv:1804.03999.
Figures