4775
Removing Background Velocity Errors in PC-MRI with Optimized Spoiler Gradient Waveforms1Department of Radiology, Stanford University, Stanford, CA, United States, 2Division of Radiology, Veterans Administration Health Care System, Palo Alto, CA, United States, 3Cardiovascular Institute, Stanford University, Stanford, CA, United States
Synopsis
Keywords: Flow, Cardiovascular
Motivation: Background velocity errors caused by eddy currents and mechanical oscillations in PC-MRI are a significant source of measurement error for which prospective corrections remain unavailable.
Goal(s): To prospectively design spoiler gradient waveforms that reduce background velocity errors to levels generally considered irrelevant.
Approach: A gradient optimization toolbox (GrOpt) was used in conjunction with a gradient impulse response to design error-minimizing waveforms. They were tested in a phantom and in 10 volunteers.
Results: Background velocity errors were reduced by 84±10.4% with the gradient spoiler optimization and to levels below a clinically relevant threshold (0.4% Venc) in 96% of subjects.
Impact: We used a gradient optimization (GrOpt) toolbox and the gradient impulse response function to prospectively design spoiler gradient waveforms that reduce background velocity errors in PC-MRI to levels below a clinically relevant threshold in 96% of subjects.
Introduction
Phase contrast MRI (PC-MRI) is used clinically to measure blood flow with the use of bipolar gradients. It is a powerful quantitative technique for diagnosing cardiovascular disease, but persistent measurement errors limit reliability. In particular, the velocity-encoding bipolar gradient waveforms create eddy currents and oscillating fields (related to acoustic vibrations) that give rise to background velocity (phase) errors that have proven difficult to eliminate prospectively. This erroneous phase sums with the velocity phase and causes significant flow measurement errors1.Previous work2 showed that a gradient impulse response function (GIRF) can be used to model this error. This model was then used with gradient waveform optimization methods to create acquisitions with prospectively minimized background phase, thereby removing the measurement error.
In this work, we expand on these previous implementations by designing a gradient waveform optimization strategy where minimization of the background phase error is performed by modifying only the spoiler gradients. Modifying only the spoilers avoids any change to the imaging TE and velocity encoding timings. The method is implemented and tested in a phantom and ten volunteers.
Methods
A GIRF measurement was performed using a field camera3 (Skope MRT) to obtain a 0th spatial-order GIRF. The GIRF was used to predict the background velocity, BGv0(t), following a previously described method2.PC-MRI waveforms were designed to minimize BGv0(t) in a narrow window (100µs) around the TE using a gradient optimization toolbox (GrOpt)4. This study created gradient waveforms that minimized BGv0 using only the spoiler gradients (“BGv0 optimized spoilers”), whereas a previous implementation optimized the bipolar gradients ("BGv0 optimized bipolars”). Sequences were implemented in Pulseq5.
Phantoms – The method was tested in a static phantom where a sliding TE acquisition was used to acquire 40 images at different TEs (40µs spacing). Six different protocols were designed: three axial with different minimization window positions and three with coronal, sagittal, and oblique orientations. The BGv0 of each TE image was measured and compared to the GIRF prediction with Bland-Altman comparisons.
Volunteers – Healthy volunteers (N=10) were scanned (IRB approved with consent) using the protocols in Figure 2B-D. Axial slices were acquired in the chest superior to the heart, through the liver, and through the neck. ROIs were drawn in major vessels in all images and flow rates compared using non-parametric (Passing–Bablok) regression. BGv0 was measured with polynomial fitting and compared between methods.
Results
Figure 2A shows the timing increments required to add the BGv0 minimization to an acquisition. An extra 0.19±0.08ms was needed for optimization of the bipolars, compared to an additional 0.22±0.24ms for the spoilers. Figures 2B-D show the in vivo protocol parameters, where similar increases in TE and TR can be seen, leading to 0.0-4.0% increases in scan time.Figures 3D-F show Bland-Altman plots comparing the measured and predicted BGv0. Bias and [95% LOA] were 0.08[-0.42,0.57]cm/s for the conventional waveforms, 0.06[-0.30,0.41]cm/s for the BGv0 optimized bipolar method, and 0.02[-0.48,0.52]cm/s for the BGv0 optimized spoiler method.
Figure 4B-C shows linear regressions of measured flowrates across all ROIs and timeframes. Slopes for the BGv0 optimized bipolar method were [0.92,0.95,1.01], and [0.97, 0.97, 1.01] for the BGv0 optimized spoiler method. Non-zero intersects were seen for both methods, which corresponded to the measured BGv0 differences seen in Figure 5B.
Figure 5A shows examples of the imaged background phase, where both optimization methods show qualitatively less BGv0 than a conventional acquisition. Figure 5B plots the measured |BGv0|, which was reduced 83.3±13.1% for the BGv0 optimized bipolars, and 84.4±10.4% for the BGv0 optimized spoilers.
Discussion
In this work we showed that gradient waveforms can be prospectively designed to significantly reduce the measured background velocity in a PC-MRI acquisitions. We showed this could be achieved using only the spoiler gradients, which has the benefit of not increasing TE, and not changing the velocity encoding gradient shapes from the conventional bipolar shape.Measured BGv0 matched well to the GIRF prediction for all methods, though slightly better with bipolar optimization. When tested in vivo, excellent agreement of flow values was seen between all metrics, with the spoiler optimization performing slightly better. Both optimization methods reduced BGv0 in vivo to acceptable levels, below a clinically relevant threshold of 0.4% Venc6 in 95% of cases and BGv0 was reduced in all cases.
From the results, it appears the remaining BGv0 error can mostly be attributed to GIRF performance. Further work will aim to improve the predictive model using new proposed improvements to the GIRF7-8. Additionally, this work only focused on 0th order field terms as a proof-of-concept, future work is currently looking at higher order terms.
Acknowledgements
NSF/NIH 2205103 to DBE.References
1. A. Chernobelsky, O. Shubayev, C. R. Comeau, and S. D. Wolff, “Baseline correction of phase contrast images improves quantification of blood flow in the great vessels,” Journal of Cardiovascular Magnetic Resonance, vol. 9, no. 4, pp. 681–685, 2007
2. M. Loecher and D. B. Ennis, “Minimizing Background Phase in PC-MRI with the Gradient Impulse Response Function (GIRF) and Gradient Optimized (GrOpt) Velocity Encoding,” presented at the ISMRM Annual Meeting, Toronto, Canada, 2023.
3. S. J. Vannesjo et al., “Gradient system characterization by impulse response measurements with a dynamic field camera,” Magnetic Resonance in Medicine, vol. 69, no. 2, pp. 583–593, 2013
4. M. Loecher, M. J. Middione, and D. B. Ennis, “A gradient optimization toolbox for general purpose time-optimal MRI gradient waveform design,” Magn Reson Med, vol. 84, no. 6, pp. 3234–3245, Dec. 2020
5. K. J. Layton et al., “Pulseq: a rapid and hardware-independent pulse sequence prototyping framework,” Magnetic resonance in medicine, vol. 77, no. 4, pp. 1544–1552, 2017
6. P. D. Gatehouse et al., “Flow measurement by cardiovascular magnetic resonance: a multi-centre multi-vendor study of background phase offset errors that can compromise the accuracy of derived regurgitant or shunt flow measurements,” Journal of Cardiovascular Magnetic Resonance, vol. 12, no. 1, p. 5, Jan. 2010
7. J. Nussbaum, B. E. Dietrich, B. J. Wilm, and K. P. Pruessmann, “Thermal variation in gradient response: measurement and modeling,” Magnetic Resonance in Medicine, vol. 87, no. 5, pp. 2224–2238, 2022,
8. K. N. Magdoom, M. Sarntinoranont, and T. H. Mareci, “An MRI-Based Switched Gradient Impulse Response Characterization Method with Uniform Eigenmode Excitation,” J Magn Reson, vol. 313, p. 106720, Apr. 2020
Figures
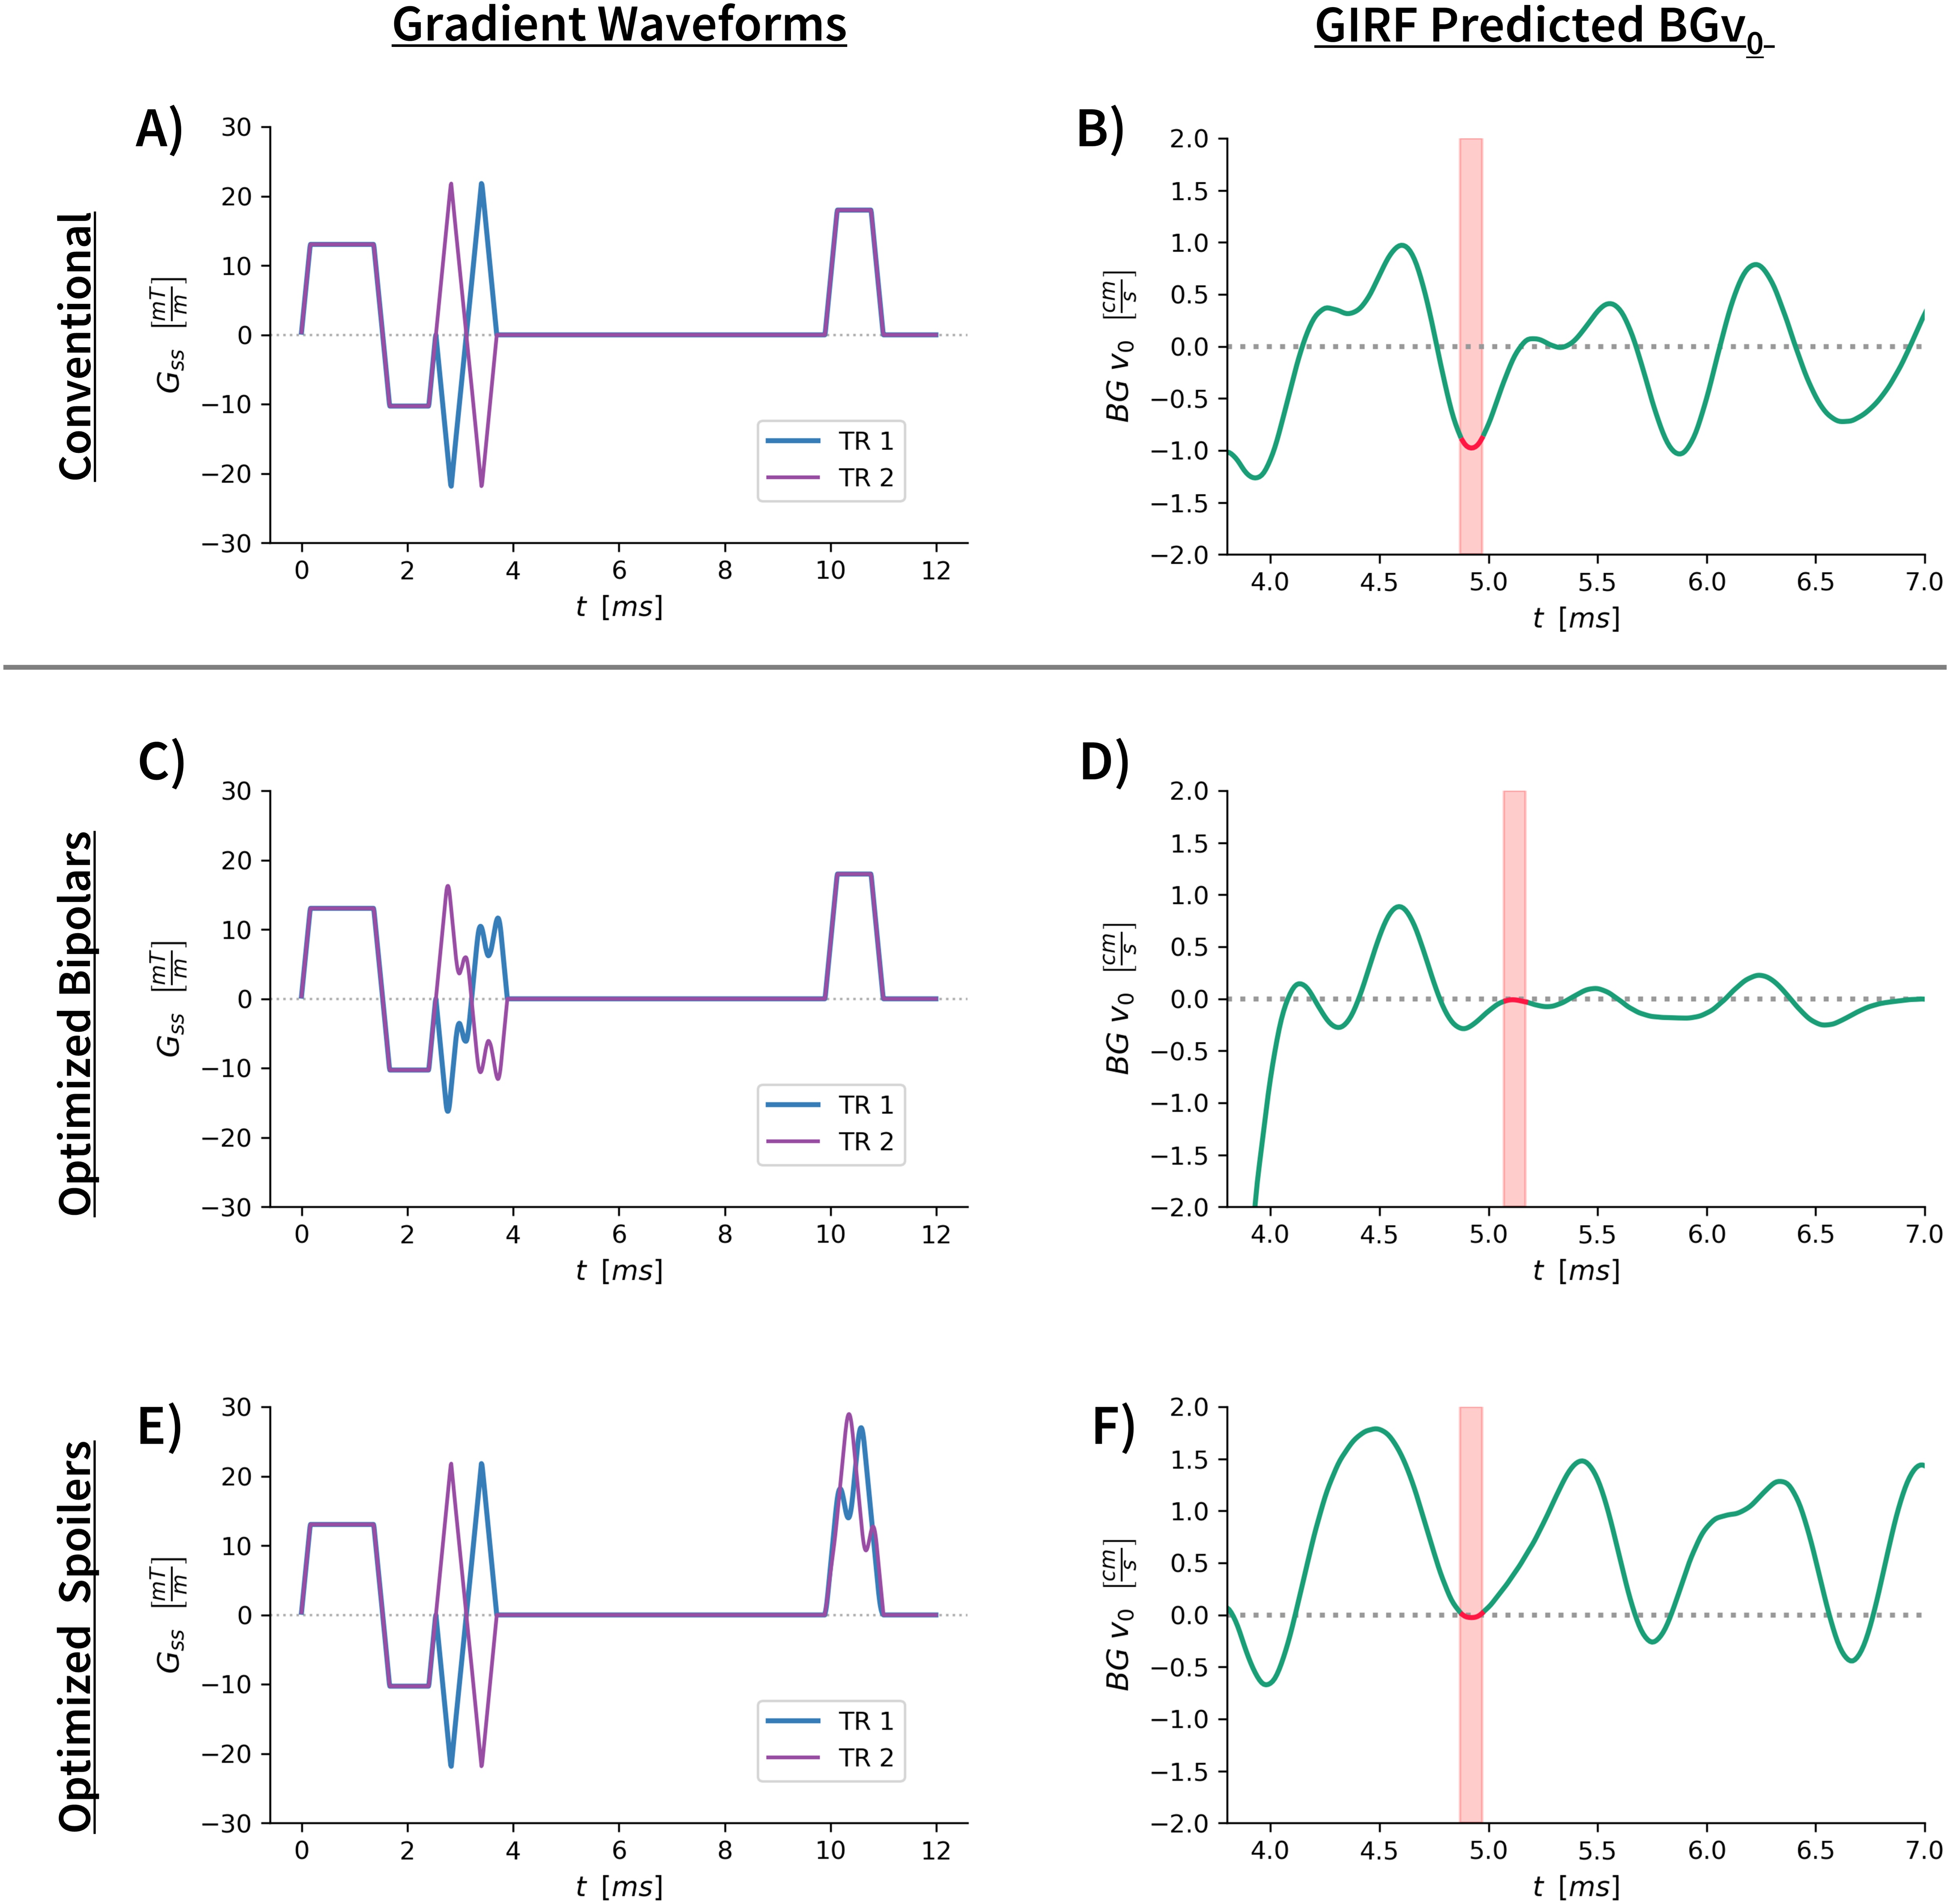
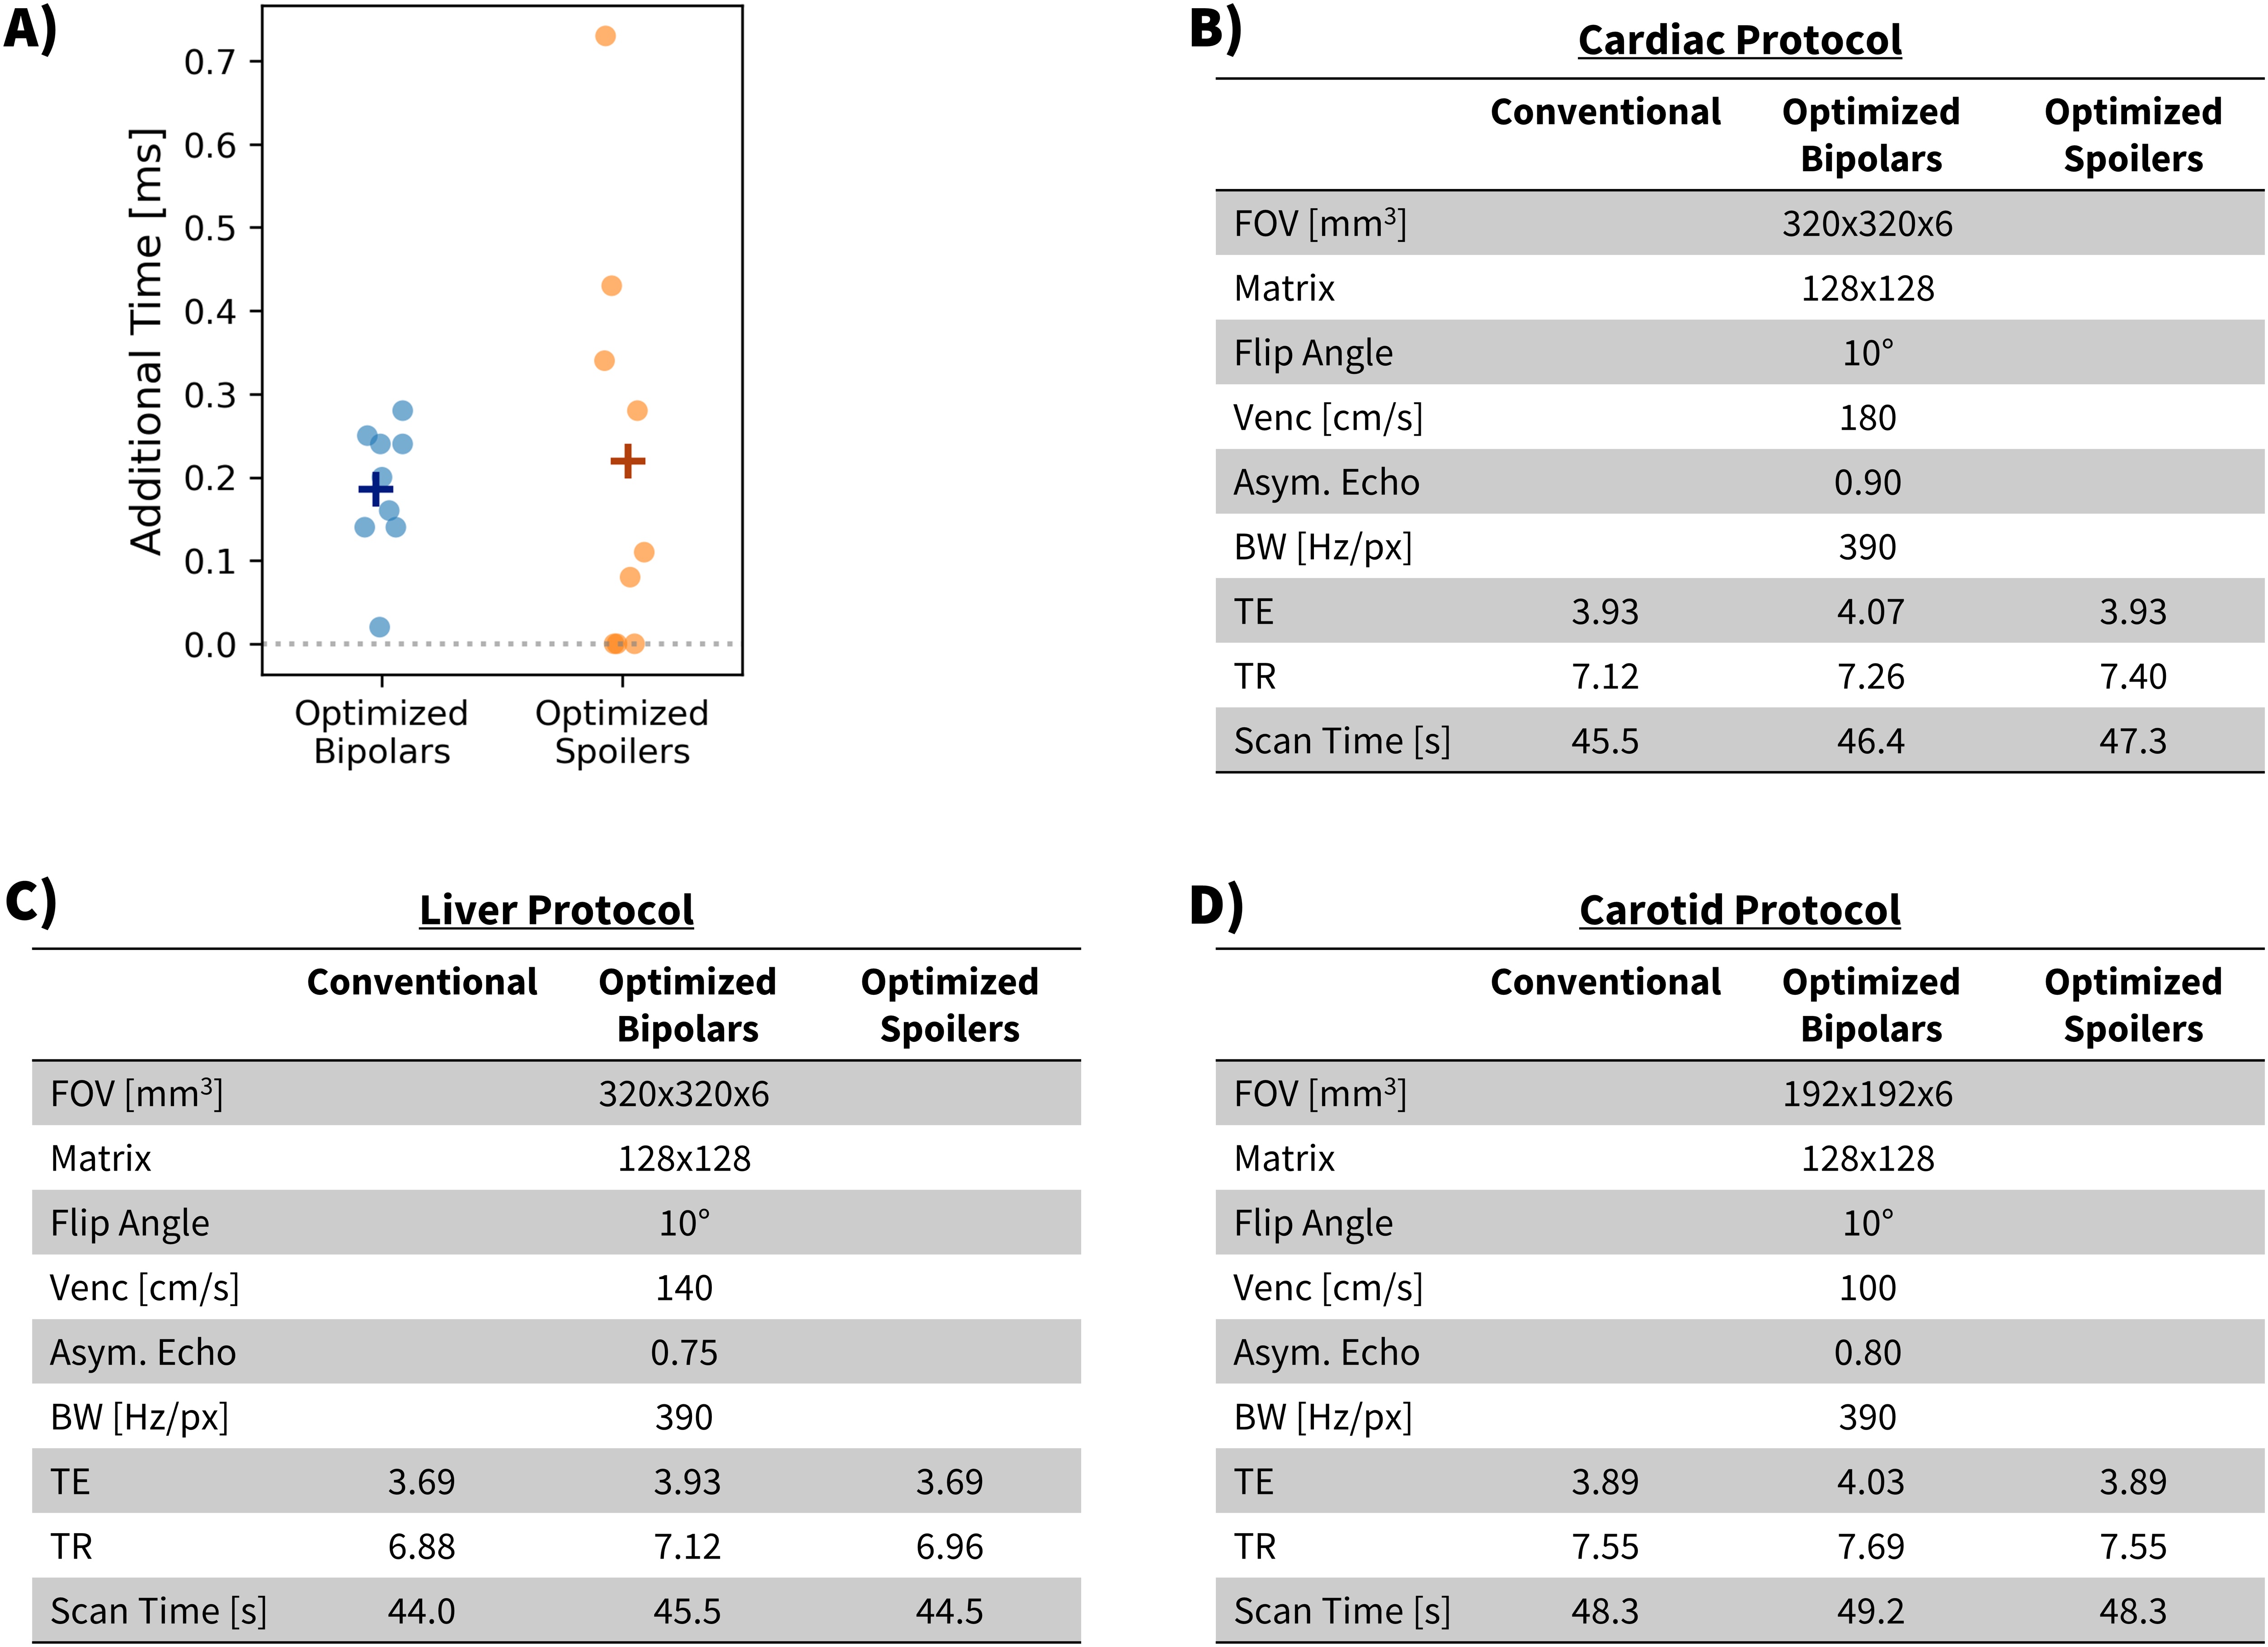
Figure 2: A) Shows the additional sequence time required for adding BGv0 minimization for both the bipolar-only or spoiler-only optimizations. These timings are taken from all 9 protocols in this study (6 sliding TE, 3 in vivo). B,C,D give the relevant scan parameters for the three in vivo slices. Each slice was acquired with conventional, bipolar optimized, and spoiler optimized waveforms. Scan times are for a retrospectively binned free-breathing PC-MRI exam.
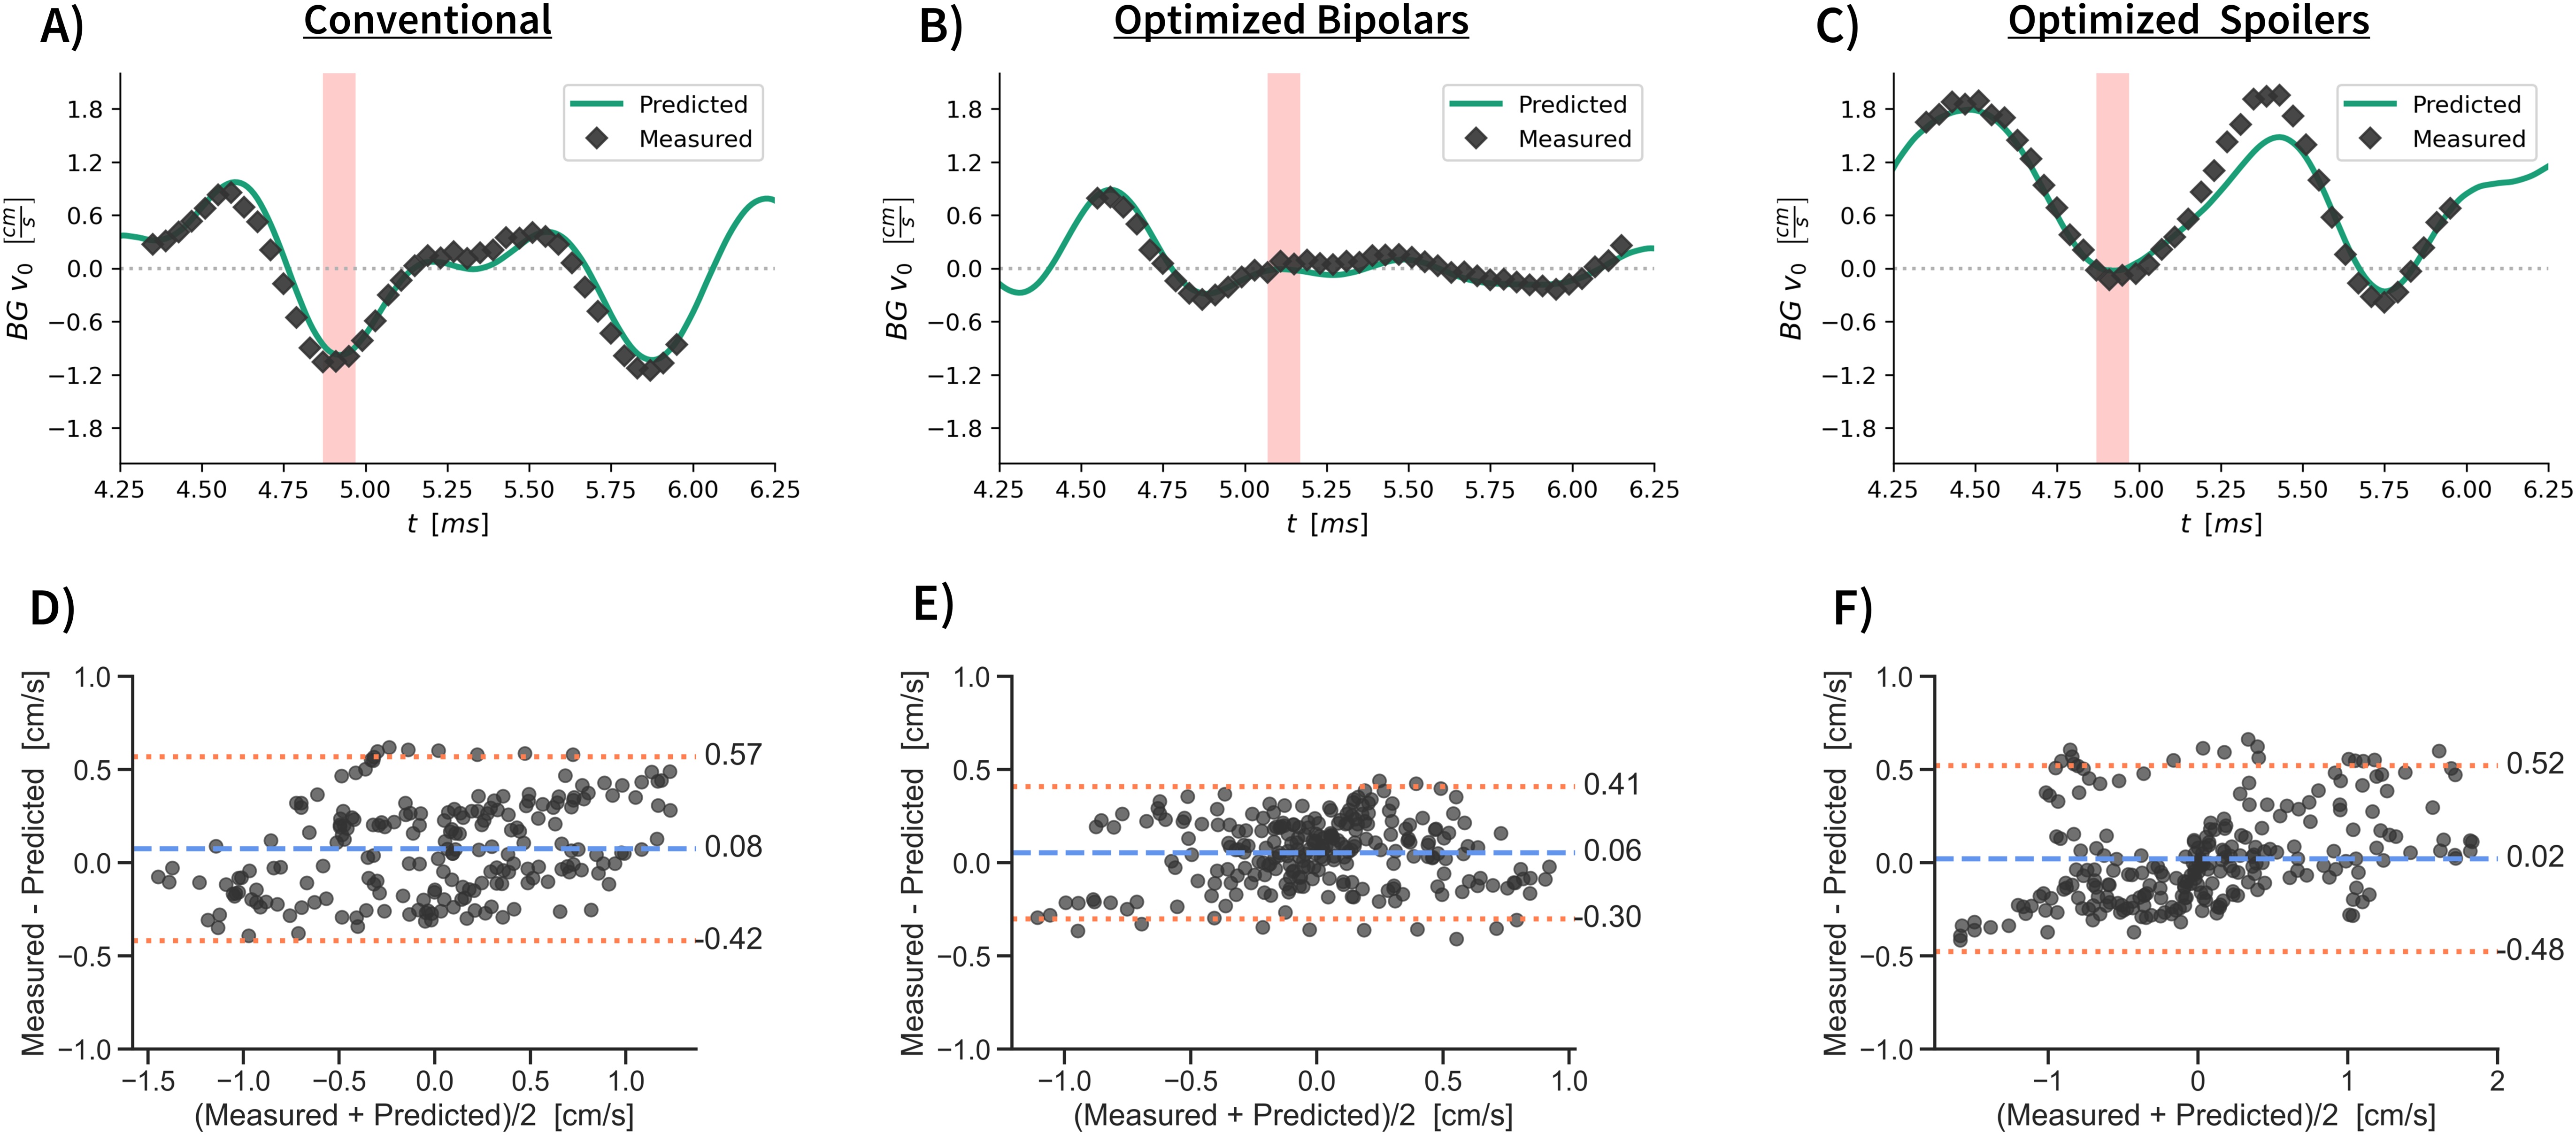
Figure 3: A,B,C show an example case of the predicted response (blue line) and the measured BGv0 (black diamond) for the different waveform design methods. The red band shows the minimization window used for this protocol. D,E,F show a Bland-Altman comparison of measured and predicted BGv0 for all images in all six protocols of the sliding TE experiment.
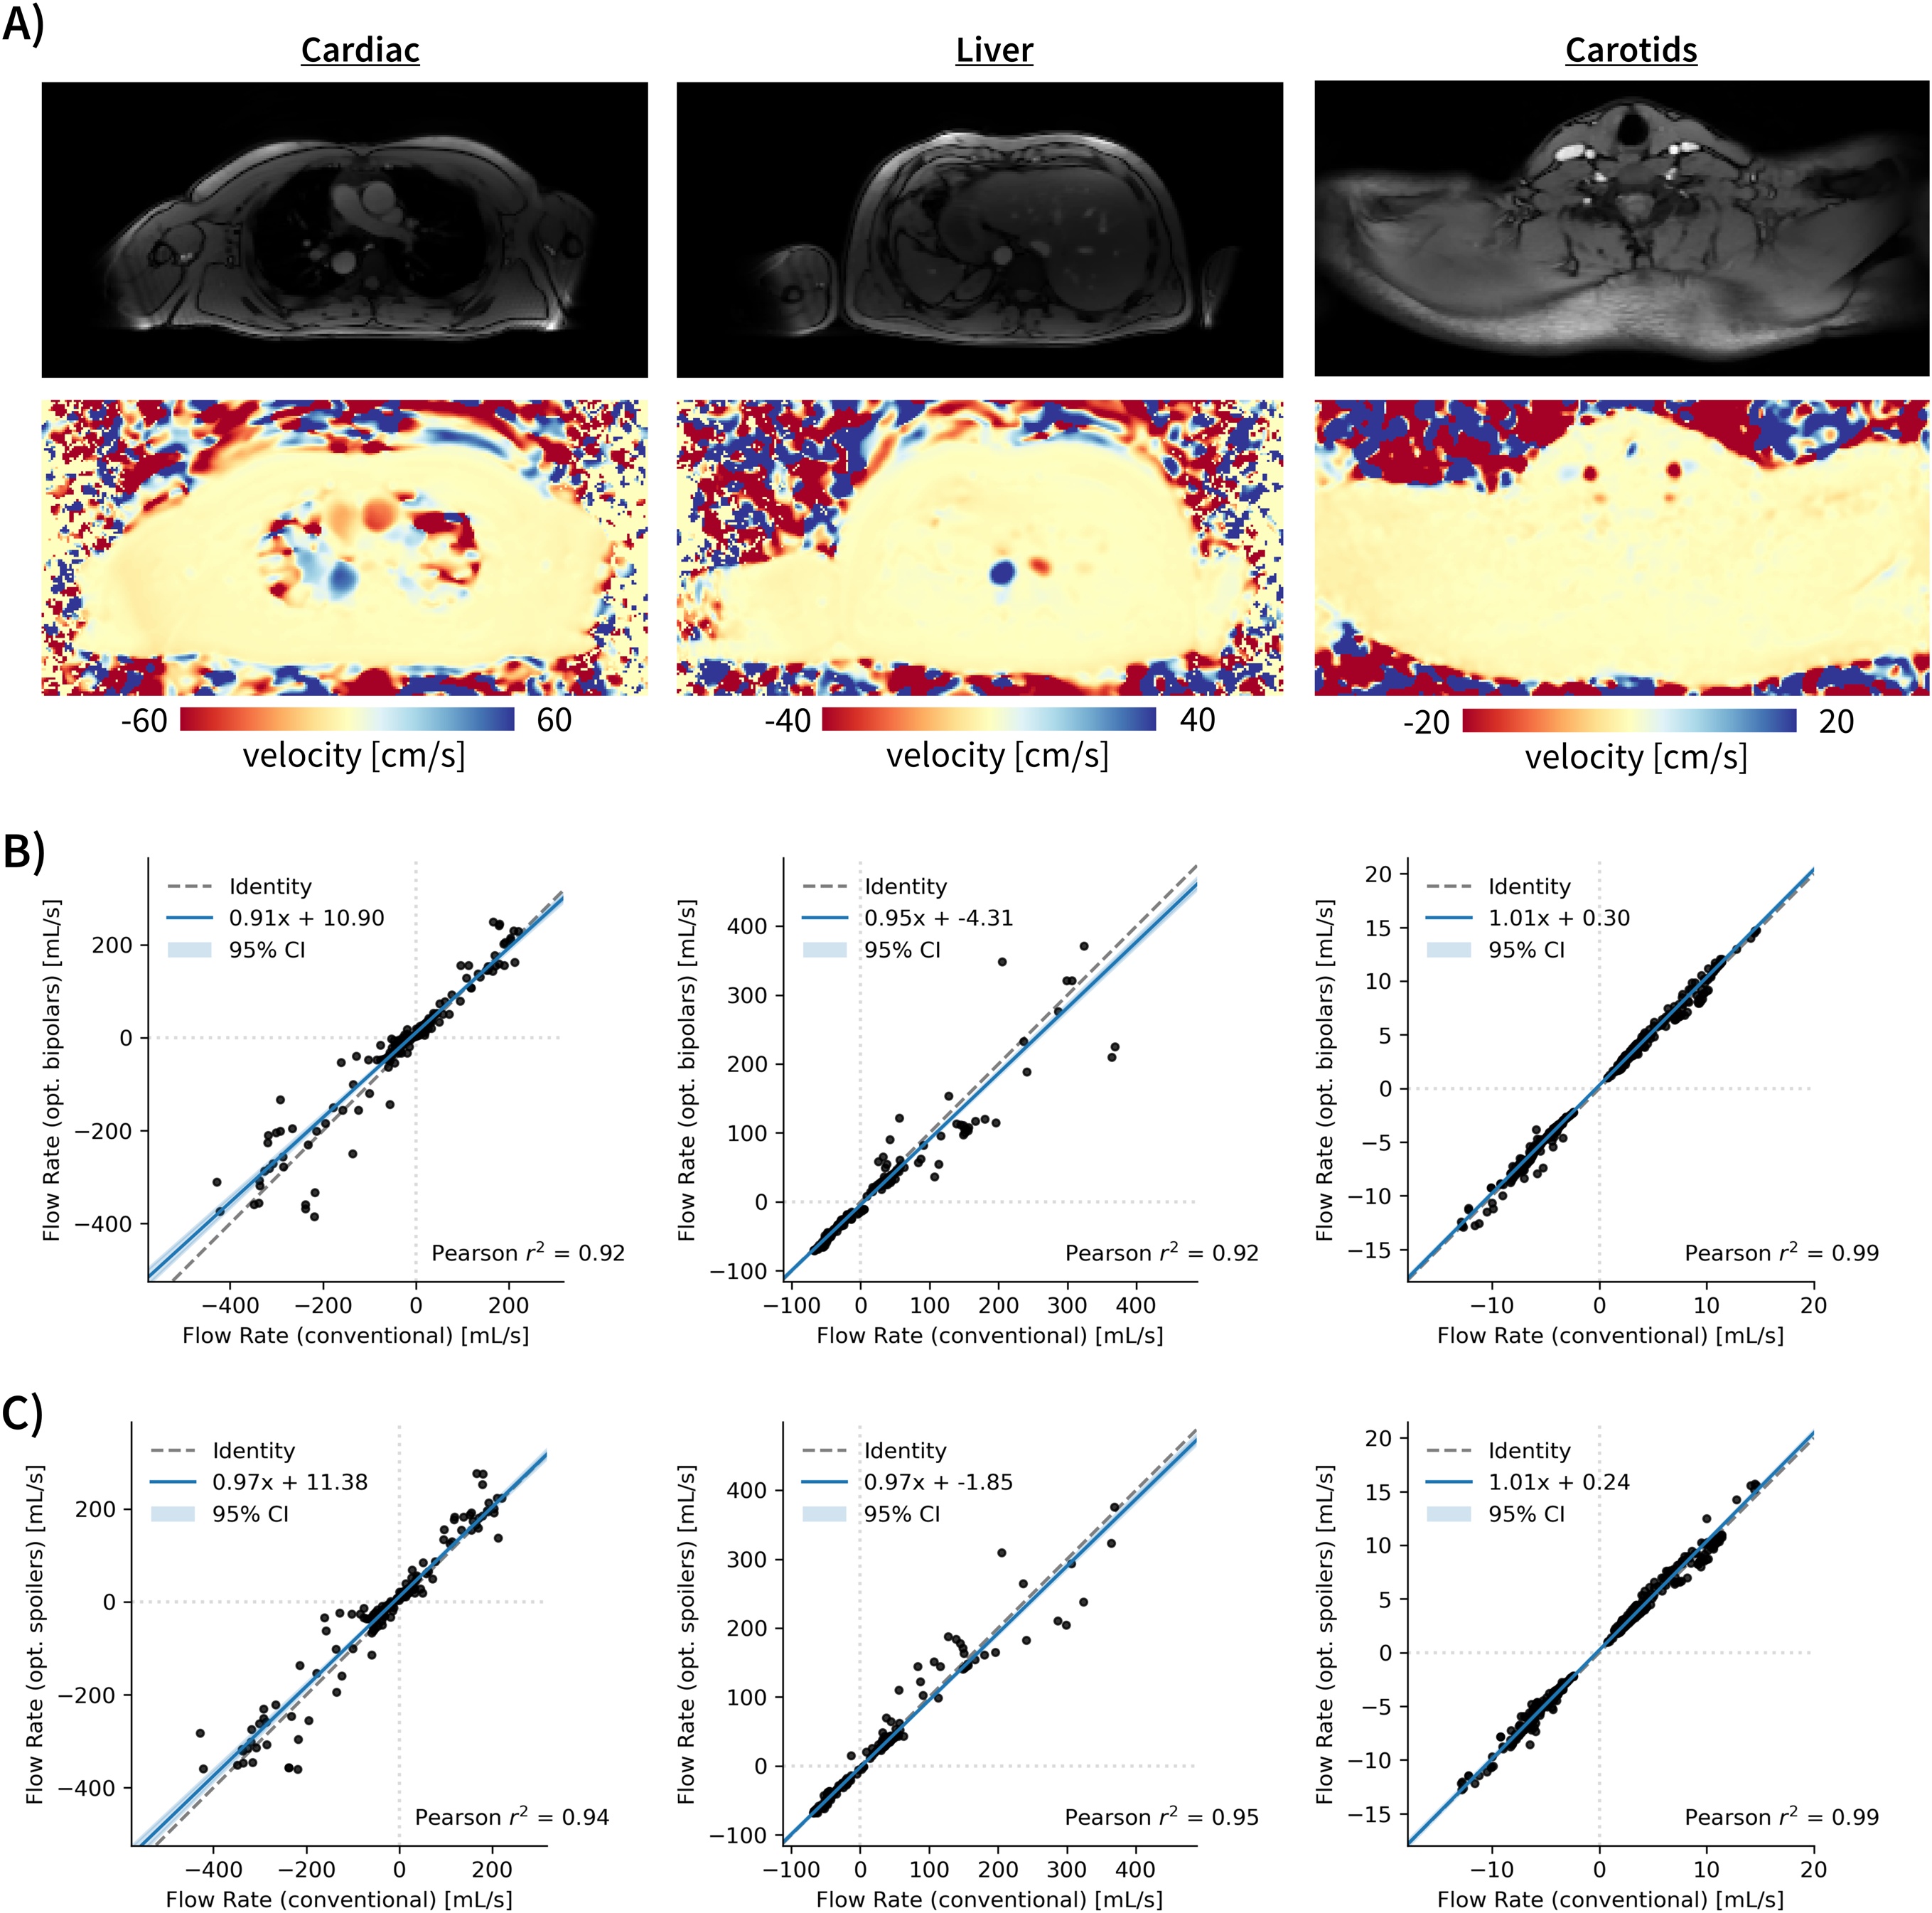
Figure 4: (A) Demonstration of the magnitude and velocity images from the BGv0 optimized spoiler acquisitions for the three anatomical locations. (B) and (C) show the respective flow rate comparisons between a conventional acquisition and (B) the BGv0 optimized bipolars and (C) BGv0 optimized spoilers acquisitions. Trend lines are shown in blue, and a light blue band shows the 95% confidence interval of the regression with Passing-Bablok analysis. Good agreement is seen for all methods.
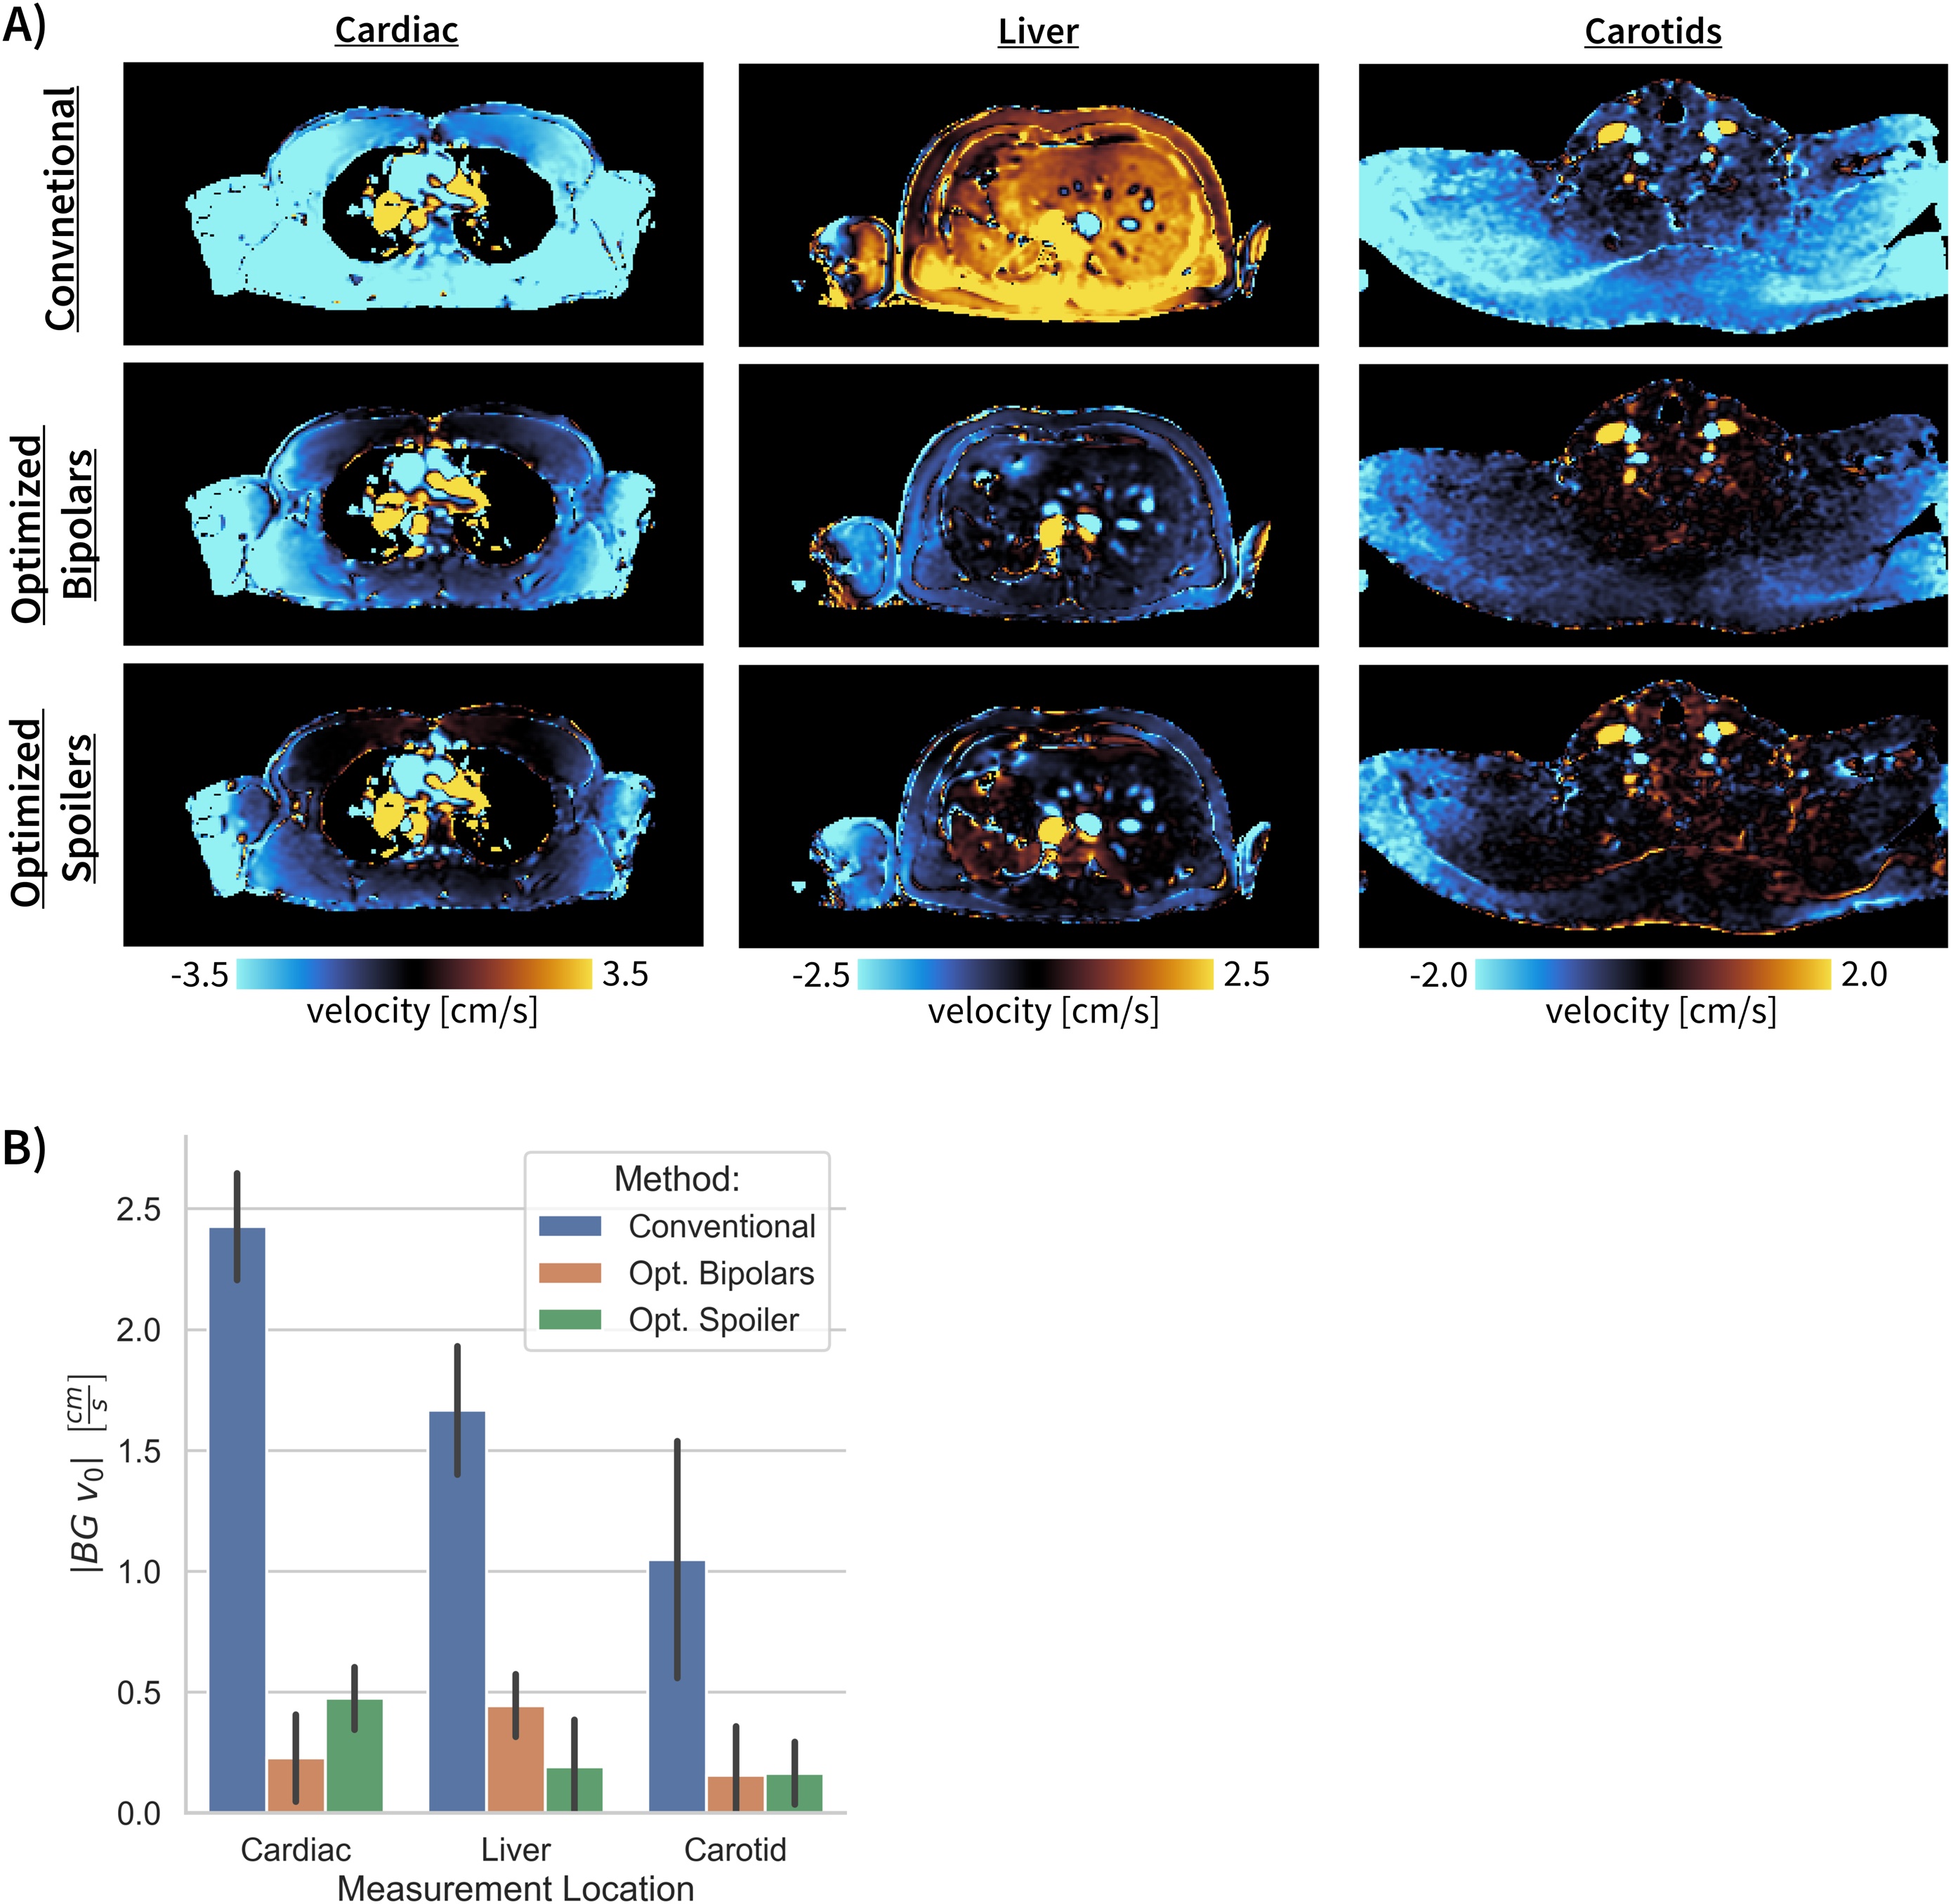
Figure 5: (A) Velocity images for each anatomical region and each waveform design method. The images have been windowed and leveled to a small range around zero velocity to better show the errors. Less background velocity (closer to black) is seen with the two optimized methods. (B) Summary of measured |BGv0| for all images and all volunteers.