4774
Evaluation of blood flow energy loss before and after endovascular aneurysm repair using 4D Flow MRI1Department of Radiology, Nippon Medical School Chiba Hokusoh Hospital, Chiba, Japan, 2Department of Cardiovascular Surgery, Nippon Medical School Chiba Hokusoh Hospital, Chiba, Japan, 3Department of Radiology, Nippon Medical School Hospital, Tokyo, Japan
Synopsis
Keywords: Flow, Cardiovascular
Motivation: To survey blood flow alteration after EVAR using 4D Flow MRI.
Goal(s): To reveal how the degree of energy loss occur, and how interact with other parameters.
Approach: Velocity, volume, reflux ratio, and degree of energy loss at proximal and within the treatment segment were analyzed. Each value gained pre and post EVAR were statistically compared, and the relation between energy loss and pulse wave velocity were evaluated.
Results: After EVAR, the antegrade velocity and the volume increased at the aneurysmal orifice level, and the degree of energy loss through the treatment segment increased.
Impact: EVAR facilitates aortic stiffness and increases the antegrade velocity and volume at treatment area. These alterations were considered as the main factors promoting further energy loss, which may concern with cardiac afterload.
INTRODUCTION
Acceleration of aortic stiffness after endovascular aneurysm repair (EVAR) for abdominal aortic aneurysm (AAA) has recently been known to increase cardiac afterload1,2), however, evaluation method of this phenomenon has not been established. This study aimed to survey hemodynamic alteration associated with the aortic stiffness after EVAR using 4D Flow MRI, especially regarding the change of blood flow energy loss (EL)3).METHODS
PatientsPatients underwent EVAR between April 2019 and September 2023 were enrolled in this study; Among those, thirty patients (25 males and 9 females, 61–91 years old) underwent 4D Flow MRI before and approximately six months after EVAR were analyzed.
MR Imaging
Techniques In addition to the clinical cardiac MRI sequences, gadolinium-enhanced 4D Flow MRI was performed using a 3-T MRI scanner (Discovery MR750; GE) with following parameters: TR/TE, 4.372/2 ms; flip angle, 8°; FOV, 320 × 320 mm2; image matrix, 180 × 180; resulting pixel size, 1.8 × 1.8 mm; and slice thickness, 2.4 mm; multi-velocity encoding (VENC) acquisition, 60–120 cm/s; temporal resolution, 40 ms; heart phase, 15–21 depending on heart rate; prospective triggering; k-t principal component analysis acceleration factor, 5–7; free breath acquisition with an abdominal belt for restricting motion; and acquisition time, 10–15 min.
Blood Flow Parameters
Blood flow velocity, volume, and reflux ratio at the level of the juxta renal aorta, the orifice of AAA, and the distal end of the stent-graft landing were measured (Figure 1). Then, at the distal end of the stent-graft landing, the average value of bilateral common or external iliac arteries was used for the velocity and reflux ratio, and the summed value was used for the volume.
Energy Loss
EL measurements were performed on a cardiac phase-resolved basis as well as the integrated basis over the cardiac cycle. Aorta was divided into 2 segments (Figure 1): the neck segment (from the supra-celiac to the infra-renal aorta) and the treatment segment (from the proximal to the distal end of stent-graft landing) based on the previously reported segmentation4). The degrees of EL during passing through the neck segment, the treatment segment, and the total segment from supra-celiac part to the distal end of stent-graft landing were measured (Figure 2).
Pulse Wave Velocity
Brachial ankle pulse wave velocity (PWV) was measured before and approximately one week after EVAR.
Analysis
Each value gained pre and post EVAR were statistically compared. First, blood flow velocity, volume, and reflux ratio at each segment were analyzed. Second, EL at the neck segment and the treatment segment were analyzed. Further, the relation between degree of the change in EL and PWV were evaluated.
RESULTS
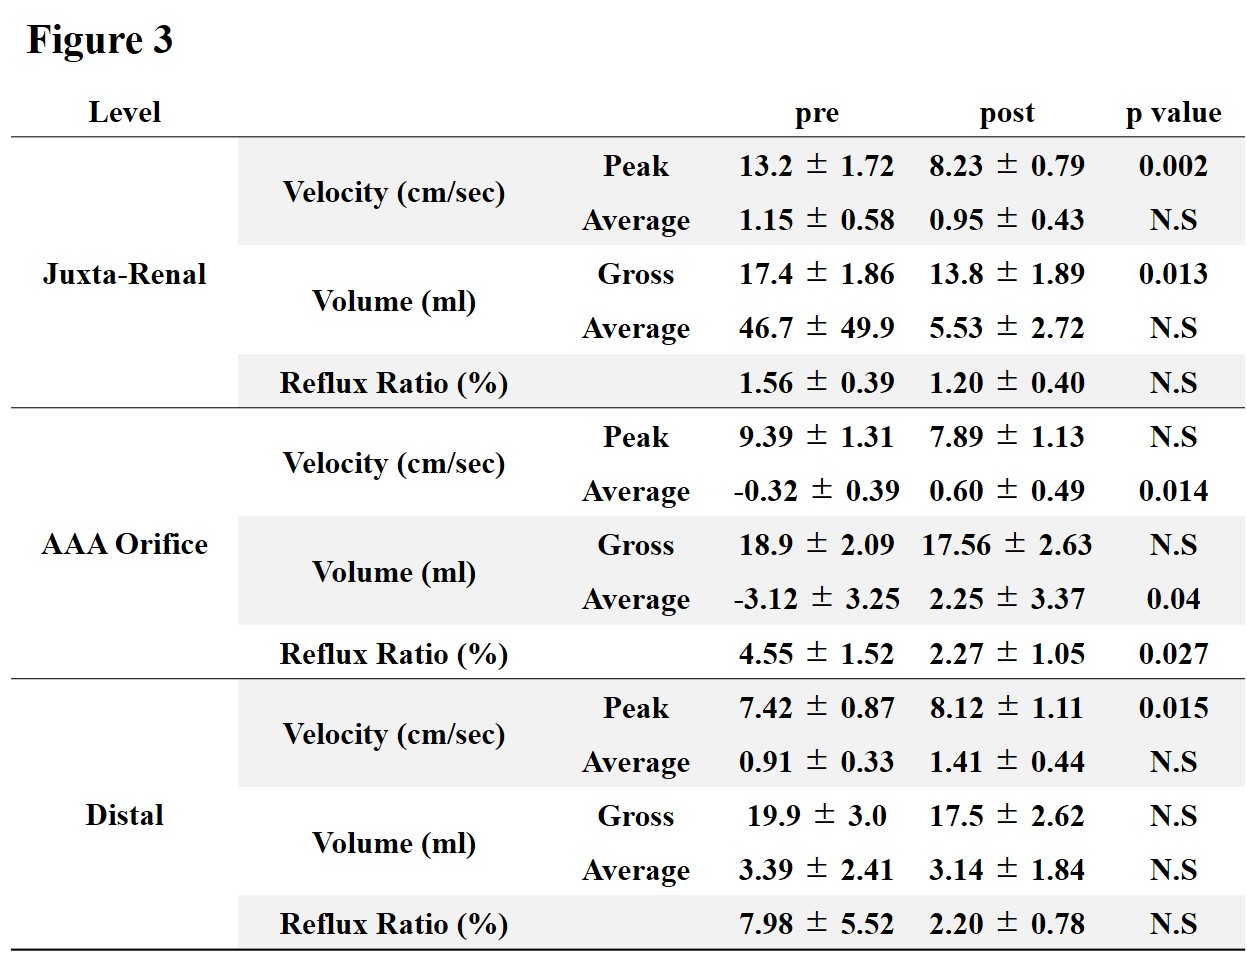
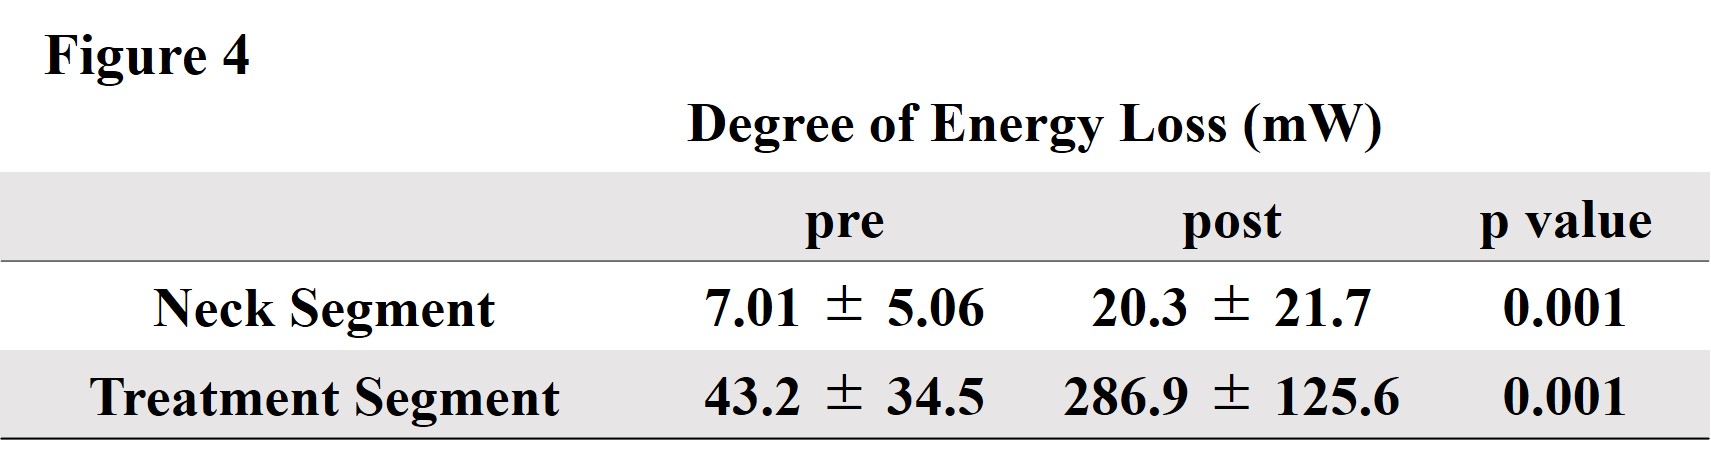
After EVAR (Figure 3), at the level of the juxta renal aorta, the peak velocity (pre vs. post; 13.2 ± 1.72 vs. 8.23 ± 0.79 cm/sec, p=0.002) and the gross volume decreased (17.4 ± 1.86 vs. 13.8 ± 1.89 ml, p=0.013). Meanwhile, at the orifice level of AAA, the average velocity (-0.32 ± 0.39 vs. 0.60 ± 0.49 cm/sec, p=0.014) and the average volume (-3.12 ± 3.25 vs. 2.25 ± 3.37 ml, p=0.04) increased, moreover, the retrograde volume (10.5 ± 1.89 vs. 7.45 ± 1.55 ml, p=0.031) and the reflux ratio (4.55 ± 1.52 vs. 2.27 ± 1.05 %, p=0.027) decreased. At the distal end of the stent-graft landing, the peak velocity (7.42 ± 0.87 vs. 8.12 ± 1.11 cm/sec, p=0.015) increased. The degree of EL increased at the neck segment (7.01 ± 5.06 vs. 20.3 ± 21.7 mW, p<0.001) and at the treatment segment (pre vs. post; 43.2 ± 34.5 vs. 286.9 ± 125.6 mW, p<0.001) (Figure 4). In the sub-group analysis regarding PWV, the degree of EL at the neck segment significantly increased with the patients whose PWV increased (9.16 ± 6.05 vs. 24.14 ± 23.4 mW, p=0.002).DISCUSSION
Deference in inner diameters between neck and aneurysmal part generally decreases after EVAR, hence at the orifice level of AAA, reflux is reduced and the antegrade velocity and volume are thought to be increased4,5). The velocity is also known to affect the blood flow energy in proportion to its square number; The degree of energy loss increases in the stream where its velocity increases. Furthermore, stent-graft derives mechanical aortic stiffness at the treatment area; The relationship between PWV, the parameter of aortic stiffness6–8), and EL could partially be clarified in this study.CONCLUSION
The specific hemodynamic alterations after EVAR were demonstrated; various changes in flow dynamics and the aortic stiffness interact with each other and both may facilitate cardiac afterload.Acknowledgements
No acknowledgement found.References
1. Takeda Y, Sakata Y, Ohtani T, et al. Endovascular aortic repair increases vascular stiffness and alters cardiac structure and function. Circ J. 2014;78(2):322-328.
2. van Bakel TMJ, Arthurs CJ, Nauta FJH, et al. Cardiac remodelling following thoracic endovascular aortic repair for descending aortic aneurysms. Eur J Cardiothorac Surg. 2019;55(6):1061-1070.
3. Itatani K, Miyazaki S, Furusawa T, et al. New imaging tools in cardiovascular medicine: computational fluid dynamics and 4D flow MRI. Gen Thorac Cardiovasc Surg. 2017;65(11):611-621.
4. Horiguchi R, Takehara Y, Sugiyama M, et al. Postendovascular aneurysmal repair increase in local energy loss for fusiform abdominal aortic aneurysm: Assessments with 4D flow MRI. J Magn Reson Imaging. Published online July 21, 2022. doi:10.1002/jmri.28359
5. Sughimoto K, Takahara Y, Mogi K, et al. Blood flow dynamic improvement with aneurysm repair detected by a patient-specific model of multiple aortic aneurysms. Heart Vessels. 2014;29(3):404-412. 6. Lantelme P, Dzudie A, Milon H, et al. Effect of abdominal aortic grafts on aortic stiffness and central hemodynamics. J Hypertens. 2009;27(6):1268-1276.
7. de Beaufort HWL, Conti M, Kamman AV, et al. Stent-Graft Deployment Increases Aortic Stiffness in an Ex Vivo Porcine Model. Ann Vasc Surg. 2017;43:302-308.
8. Bissacco D, Conti M, Domanin M, et al. Modifications in aortic stiffness after endovascular or open aortic repair: A systematic review and meta-analysis. Eur J Vasc Endovasc Surg. 2022;63(4):567-577.
Figures
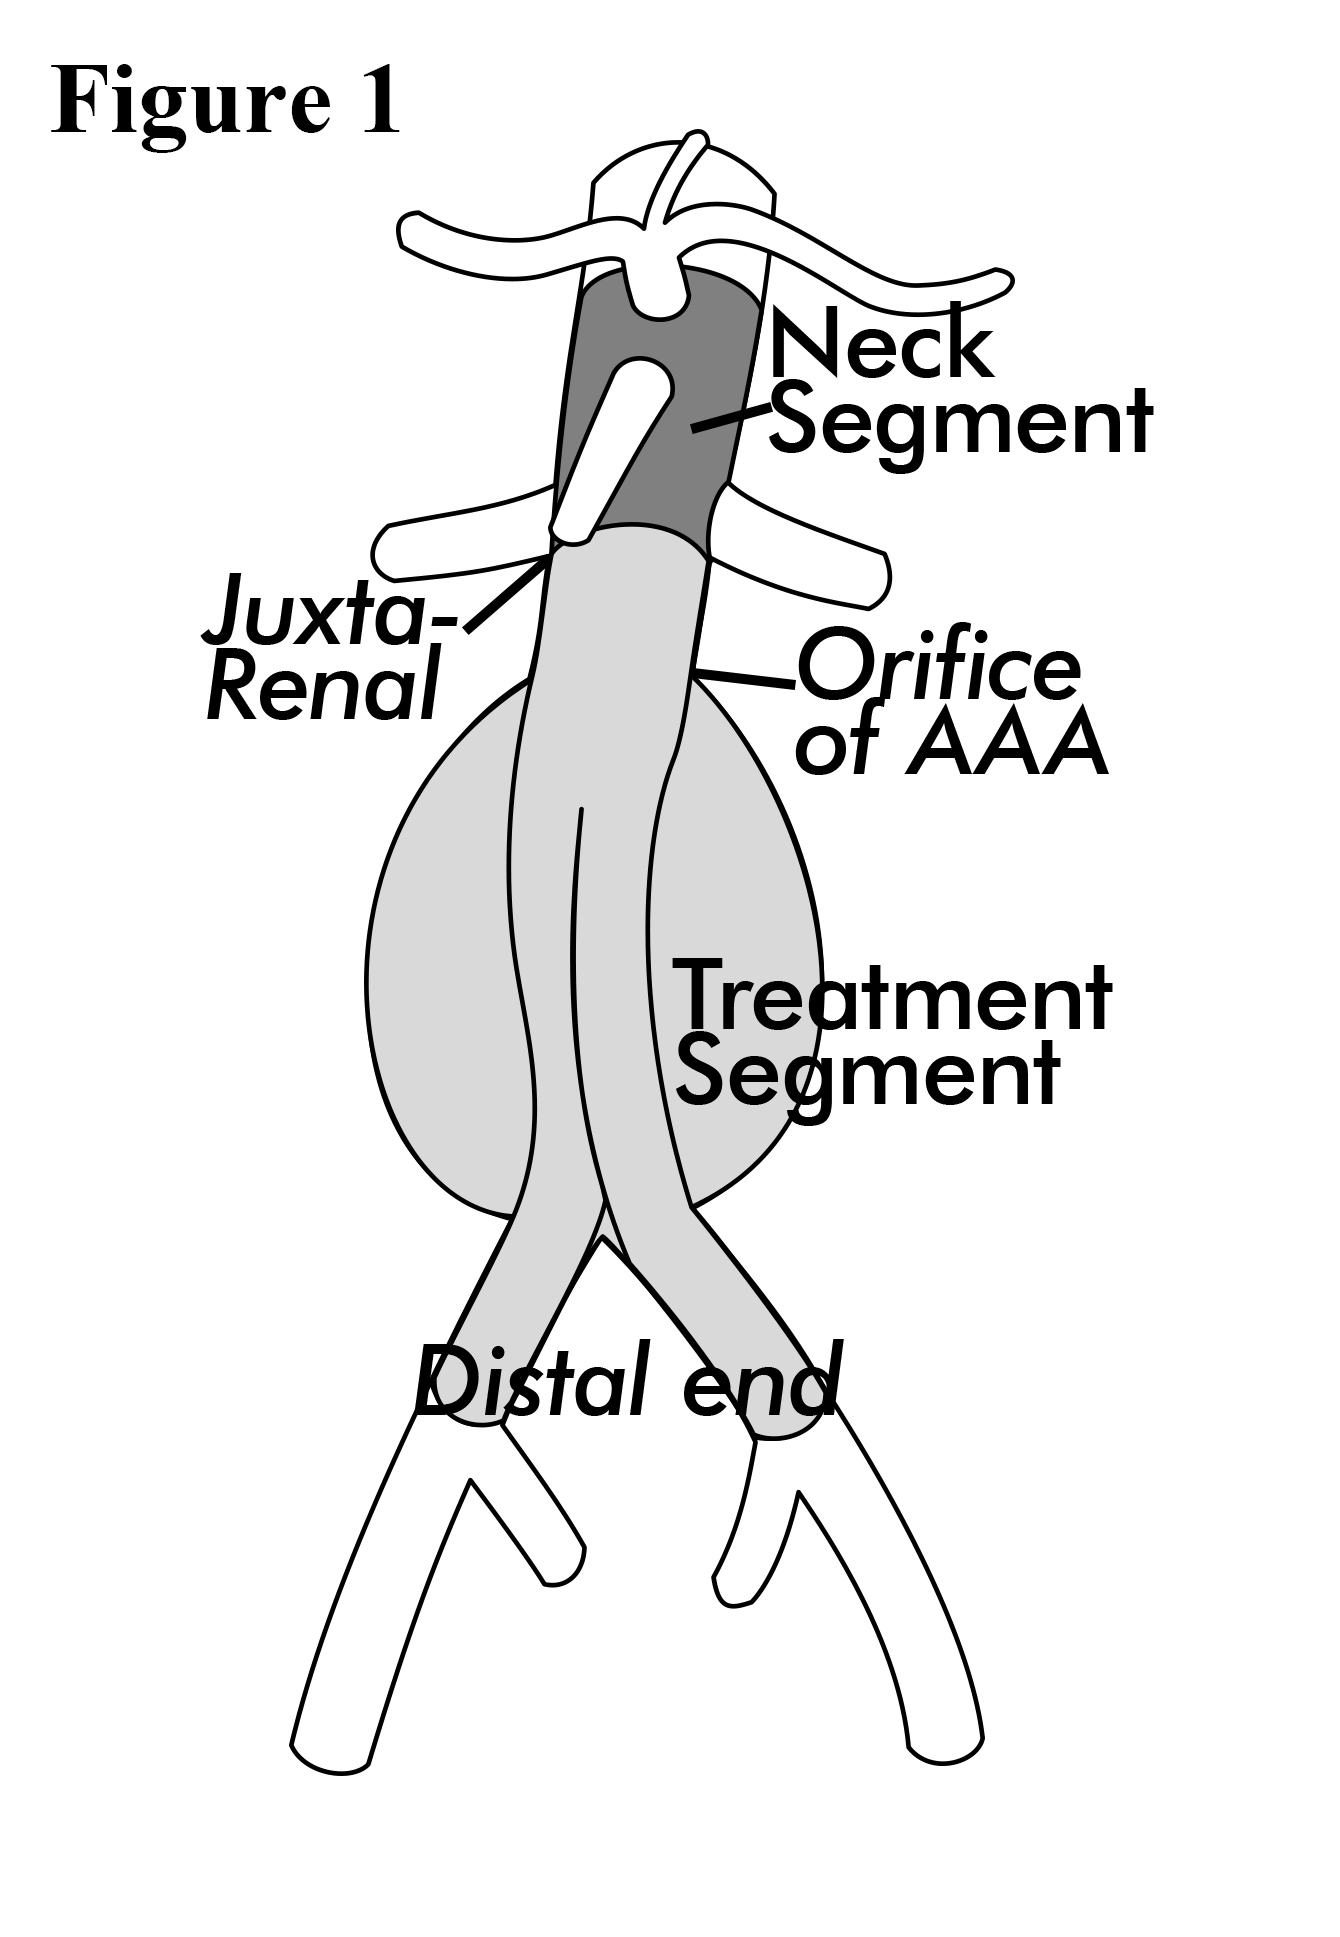
Figure 1. Scheme of Aortic Segmentation.
Velocity, volume, and reflux ratio are measured at the level of the juxta renal aorta, the orifice of AAA, and the distal end of the stent-graft landing. During measurement of energy loss, Aorta was divided into 2 segments: the neck segment (from the supra-celiac to the infra-renal aorta) and the treatment segment (from the proximal to the distal end of stent-graft landing).
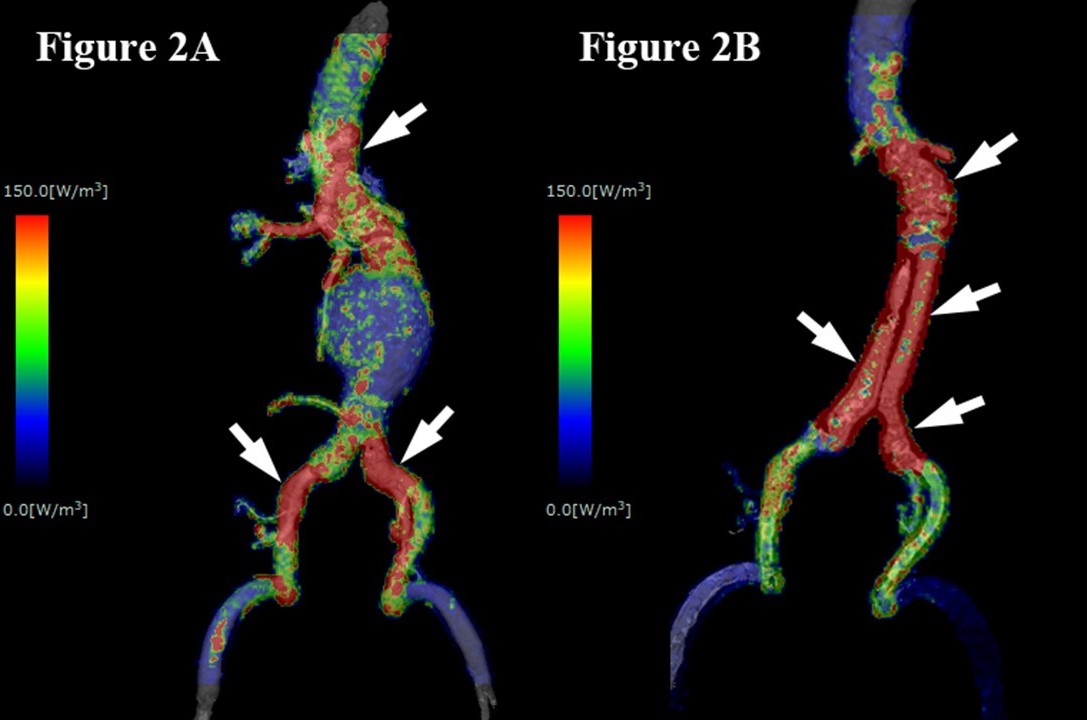
Figure 2. Mapping Images of Energy Loss (Color Range; 0-150mW).
While pre-EVAR image (A) shows intermittent high value of energy loss (red spots; arrows), post-EVAR image (B) shows almost continuous high value of energy loss throughout treatment area (arrows).