4770
4D Flow MRI-Derived Hemodynamic Parameters Related to Growth in Acute Type B Aortic Dissections1Radiology & Imaging Sciences, Emory University, Atlanta, GA, United States, 2The George W. Woodruff School of Mechanical Engineering, Georgia Institute of Technology, Atlanta, GA, United States, 3Yale University School of Medicine, Aortic Institute at Yale-New Haven Hospital, New Haven, CT, United States, 4The Wallace H. Coulter Department of Biomedical Engineering, Georgia Institute of Technology, Atlanta, GA, United States, 5Department of Surgery, Emory University, Atlanta, GA, United States
Synopsis
Keywords: Flow, Velocity & Flow, aorta, aortic dissection, 4D flow MRI
Motivation: In type B aortic dissections (TBAD), surgical outcomes often worsen as the flap stiffens. Earlier intervention (i.e., acute phase) would require prediction of aortic growth to identify high-risk patients, which has not yet been investigated in acute TBADs.
Goal(s): We aimed to identify possible hemodynamic markers of aortic growth from 4D flow MRI data in acute TBAD subjects.
Approach: From the 4D flow data we estimated various hemodynamic metrics.
Results: Peak entry tear velocity, false lumen retrograde flow pre-entry tear, and forward flow post-entry tear were higher in growth cases. We also demonstrate the feasibility of collecting 4D flow MRI from acute patients.
Impact: As the first study focused on in vivo hemodynamics of acute type B aortic dissections (TBAD), we aimed to identify possible metrics for predicting aortic growth. Ultimately, stratifying risk in acute TBAD patients would enable preemptive treatment and improve outcomes.
Introduction:
Type B aortic dissections (TBAD) develop from a tear in the intimal layer of the aorta, distal to the left subclavian artery. This tear separates the aorta into true (TL) and false lumens (FL), increasing the risk of dilation and rupture. TBADs, estimated in 0.5–6.3 per 100,000 person-years, are treated through medical management, open surgical repair, or endovascular repair based on diameter and growth rates.1 Evidence suggests that surgical outcomes worsen as the dissection flap stiffens in chronic TBADs (> 30 days). 2,3 Therefore, predicting aortic growth during the acute phase would enable preemptive treatment and improve surgical outcomes.Herein, we used 4D flow MRI to investigate hemodynamic parameters in uncomplicated acute TBADs. Based on previous chronic TBAD studies, several parameters have been associated with adverse outcomes including entry tear flow characteristics, FL peak velocity, and forward flow.4-6 We also identified vorticity and wall shear stress (WSS) as markers of interest from evidence suggesting that changes in these metrics are related to disease progression.7,8 While chronic TBAD studies have aided understanding of this complex disease, it is important to characterize hemodynamic behavior in the acute phase so that early risk stratification and intervention can improve.
Methods:
We enrolled acute TBAD subjects (n = 11; 3 female) who were inpatients at Emory University Hospital. We acquired 4D flow MRI of the thoracic aorta using a 3T Magnetom Prisma Fit scanner (Siemens Healthcare, Erlangen) with a prototype sequence during free-breathing and respiratory navigator gating. We administered contrast (Dotarem 10 mmol / kg 20mL; Guerbet) and used the following imaging parameters: VENC = 150 cm/s, TE = 2.39 ms, flip angle = 7°, and 25 time frames. Post-processing included eddy current and anti-alias correction and noise masking using previously developed methods (Mathworks, Natick, MA).9,10After segmenting the TL and FL (Materialise Mimics, Belgium), the following metrics were extracted: entry tear peak velocity, FL forward and retrograde flow, vorticity, and WSS. To estimate velocities and flow, we placed 2D planes at the entry tear and spaced 2 cm apart through the FL (Ansys EnSight, PA, USA). We estimated vorticity (Mathworks, Natick, MA) and WSS (van Ooji, P., GitHub Repository, 2017), dividing the FL volume data into proximal, middle, and distal regions. Vorticity was calculated by taking the cross product of the velocity vector, u, and the gradient, ▽, as shown in Equation 1.
$$ω(r,t)= ∇ × u(r,t)$$
WSS vectors were calculated using Equation 2,
$$WSS = μεn $$
where μ is the blood viscosity (3.2 · 10-3 Pa·s) and ε and n are the rate of deformation tensor and normal vector, respectively. Aortic growth rates were measured by the physician from computed tomography angiography scans at follow-up visits.
Results:
Five patients were excluded due to severe motion artifacts in MRI data or because they could not complete the exam due to disease severity. Three subjects (P1-3) did not experience growth, while three (P4-6) grew 1.2, 4.7, and 2 mm/month, respectively. Due to rapid growth, P5 was treated with endovascular repair. Figure 1 shows velocity streamlines of each case at peak systole.Entry Tear Characterization. Peak velocities through the entry tear were higher in growth cases (143 ± 50 cm/s) than non-growth (93 ± 44 cm/s), with P5 having the highest (180 cm/s). Figure 2 shows differences in entry tear characteristics between a growth and non-growth case.
FL flow analysis. The plane analysis in the FL revealed that, on average, forward flow was greatest in the distal end near visceral branches (growth = 17.1 ± 13.3, non-growth = 11.0 ± 6.6 ml/cycle), as shown in Figure 3. An increase in FL reverse flow could be identified in growth cases particularly in the pre-tear region (-31.9 ± 34.1 ml/cycle), where FL growth is most often observed (Figure 3).11
Vorticity and Wall Shear Stress. No trends between growth and non-growth cases were found in proximal, middle, and distal FL regions, but local regions of high vorticity and WSS were observed in both TL and FL near entry and exit tears (Figures 4,5). While a statistical analysis was not possible due to limited sample size, anticipated trends in the hemodynamic parameters were identified.
Conclusions:
This preliminary investigation demonstrates the feasibility of collecting in vivo flow from acute TBAD patients. We found that peak entry tear velocities, FL retrograde flow pre-entry tear, and FL forward flow post-entry tear were all higher in growth cases. This is the first study to investigate flow in acute TBAD subjects using 4D flow MRI and as we continue enrollment, we anticipate stronger trends to emerge.Acknowledgements
We would like to acknowledge the effort of the healthcare team that acquired the images and performed the procedures and the patients willing to participate in this study. We would also like to acknowledge Dr. Michael Markl and his team for sharing their 4D flow post-processing procedure. This study is supported by NIH R01HL155537 and the National Center for Advancing Translational Sciences under Award Numbers UL1TR002378 and TL1R002382.References
1. Brooks M. Review of Studies Reporting the Incidence of Acute Type B Aortic Dissection. Hearts. 2020; 1(3):152-165.
2. Afifi RO, et al. Outcomes of Patients With Acute Type B (DeBakey III) Aortic Dissection. Circulation. 2015; 132:748-754
3. Zha B, et al. Surgical Outcomes And Postoperative Descending Aorta Morphologic Remodeling After Thoracic Endovascular Aortic Repair For Acute And Chronic Type B Aortic Dissection. Clinical Interventions in Aging. 2019; 4:1925-1935
4. Chu S, et al. Baseline 4D Flow-Derived in vivo Hemodynamic Parameters Stratify Descending Aortic Dissection Patients With Enlarging Aortas. Frontiers in Cardiovascular Medicine. 2022; 9
5. Song JM, et al. Long-Term Predictors of Descending Aorta Aneurysmal Change in Patients With Aortic Dissection. Journal of the American College of Cardiology. 2007; 50; 8:799-804
6. Spinelli D, et al. Current evidence in predictors of aortic growth and events in acute type B aortic dissection. Journal of Vascular Surgery. 2018; 68; 6:1925-1935
7. Kiema M, et al. Wall Shear Stress Predicts Media Degeneration and Biomechanical Changes in Thoracic Aorta. Frontiers in Physiology. 2022; 13
8. Chen D, et al. A patient-specific study of type-B aortic dissection: evaluation of true-false lumen blood exchange. BioMed Eng OnLine. 2013; 12:65
9. Bernstein MA, et al. Concomitant gradient terms in phase contrast MR: analysis and correction. Magn Reson Med. 1998; 39(2):300-8
10. Walker PG, et al. Semiautomated method for noise reduction and background phase error correction in MR phase velocity data. 1993; 3; 3:521-530
11. Marlevi D, et al. alse lumen pressure estimation in type B aortic dissection using 4D flow cardiovascular magnetic resonance: comparisons with aortic growth. Journal of Cardiovascular Magnetic Resonance. 2021; 23:51
Figures
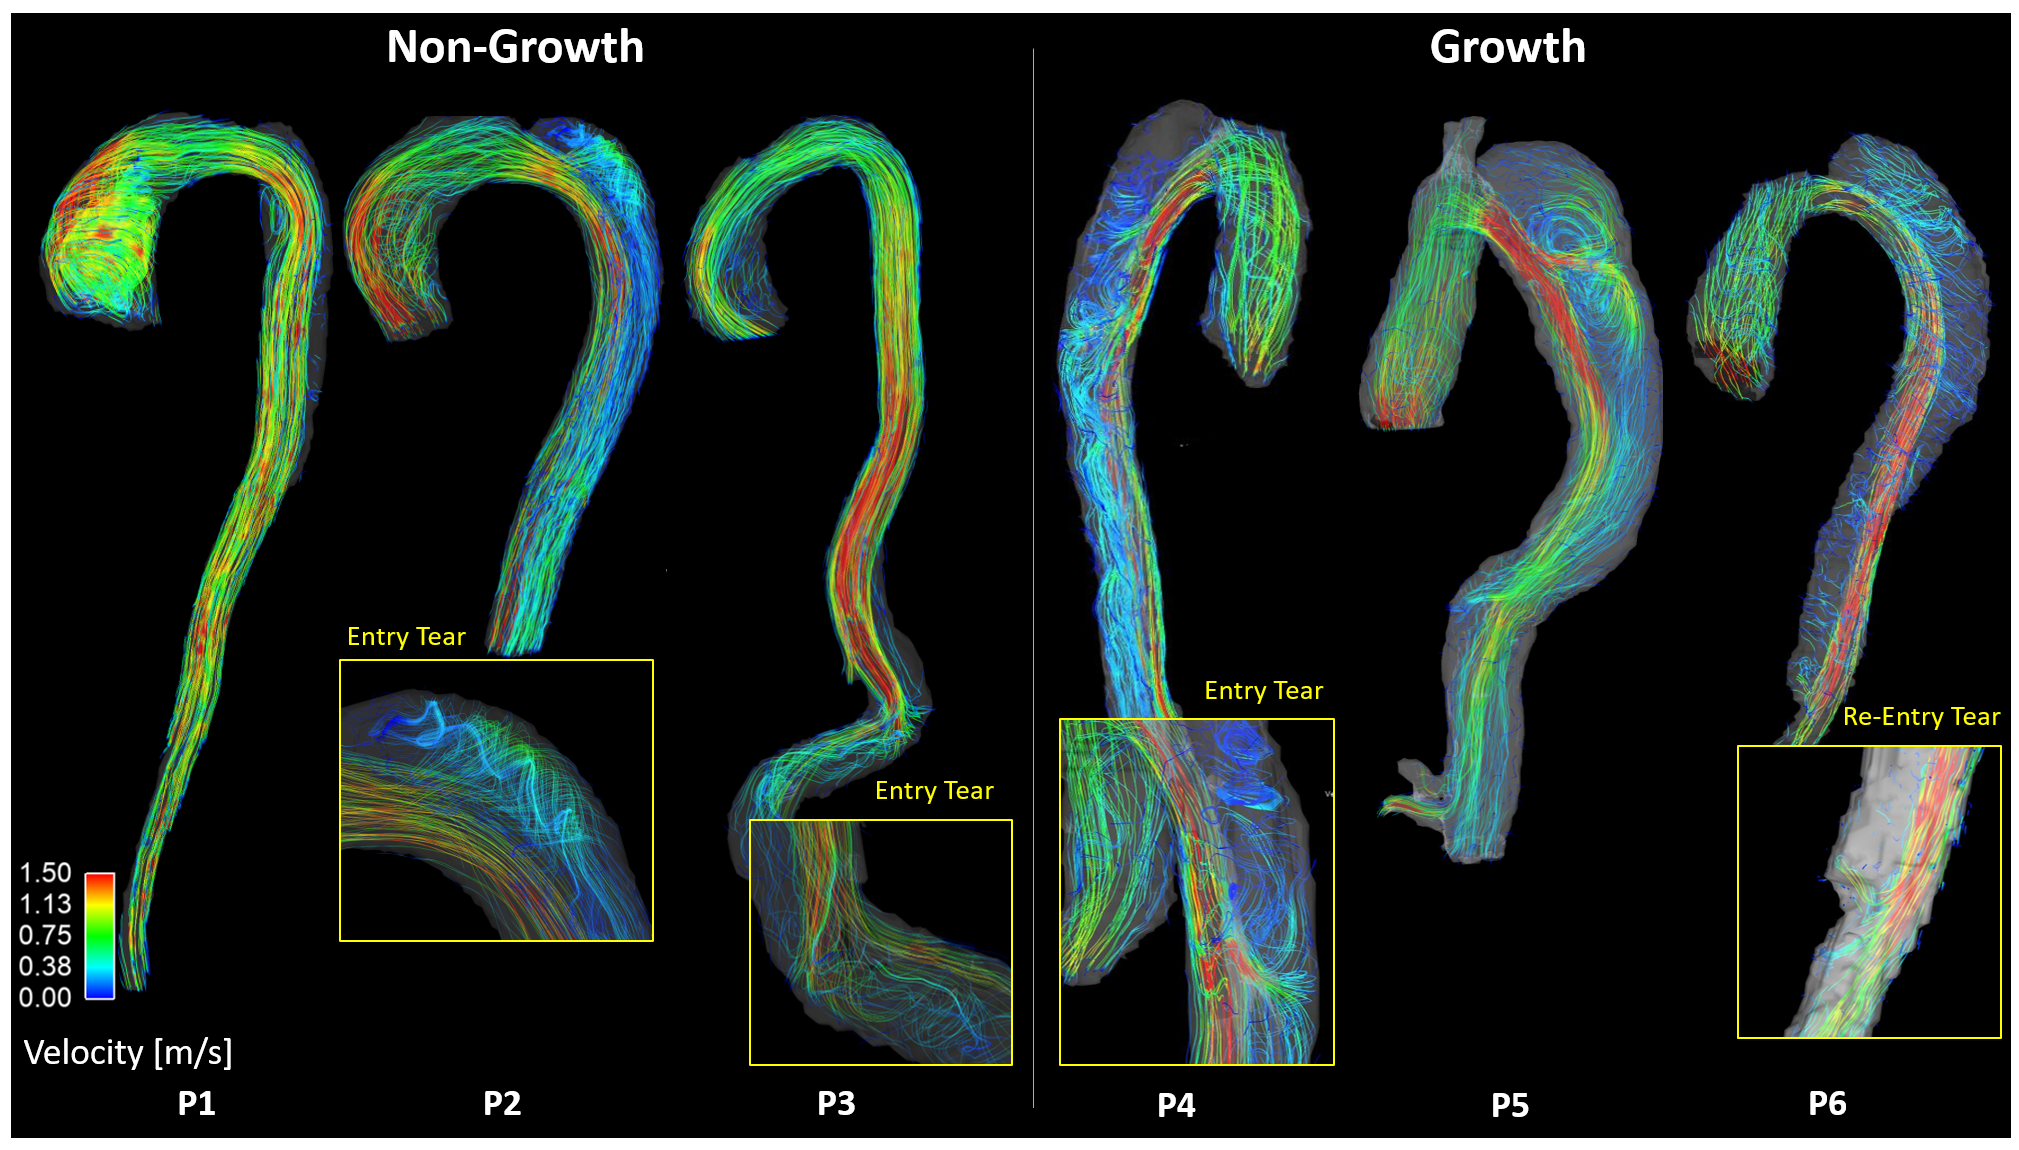
Figure 1. Velocity streamlines of non-growth (P1-P3) and growth (P4-P6) cases.
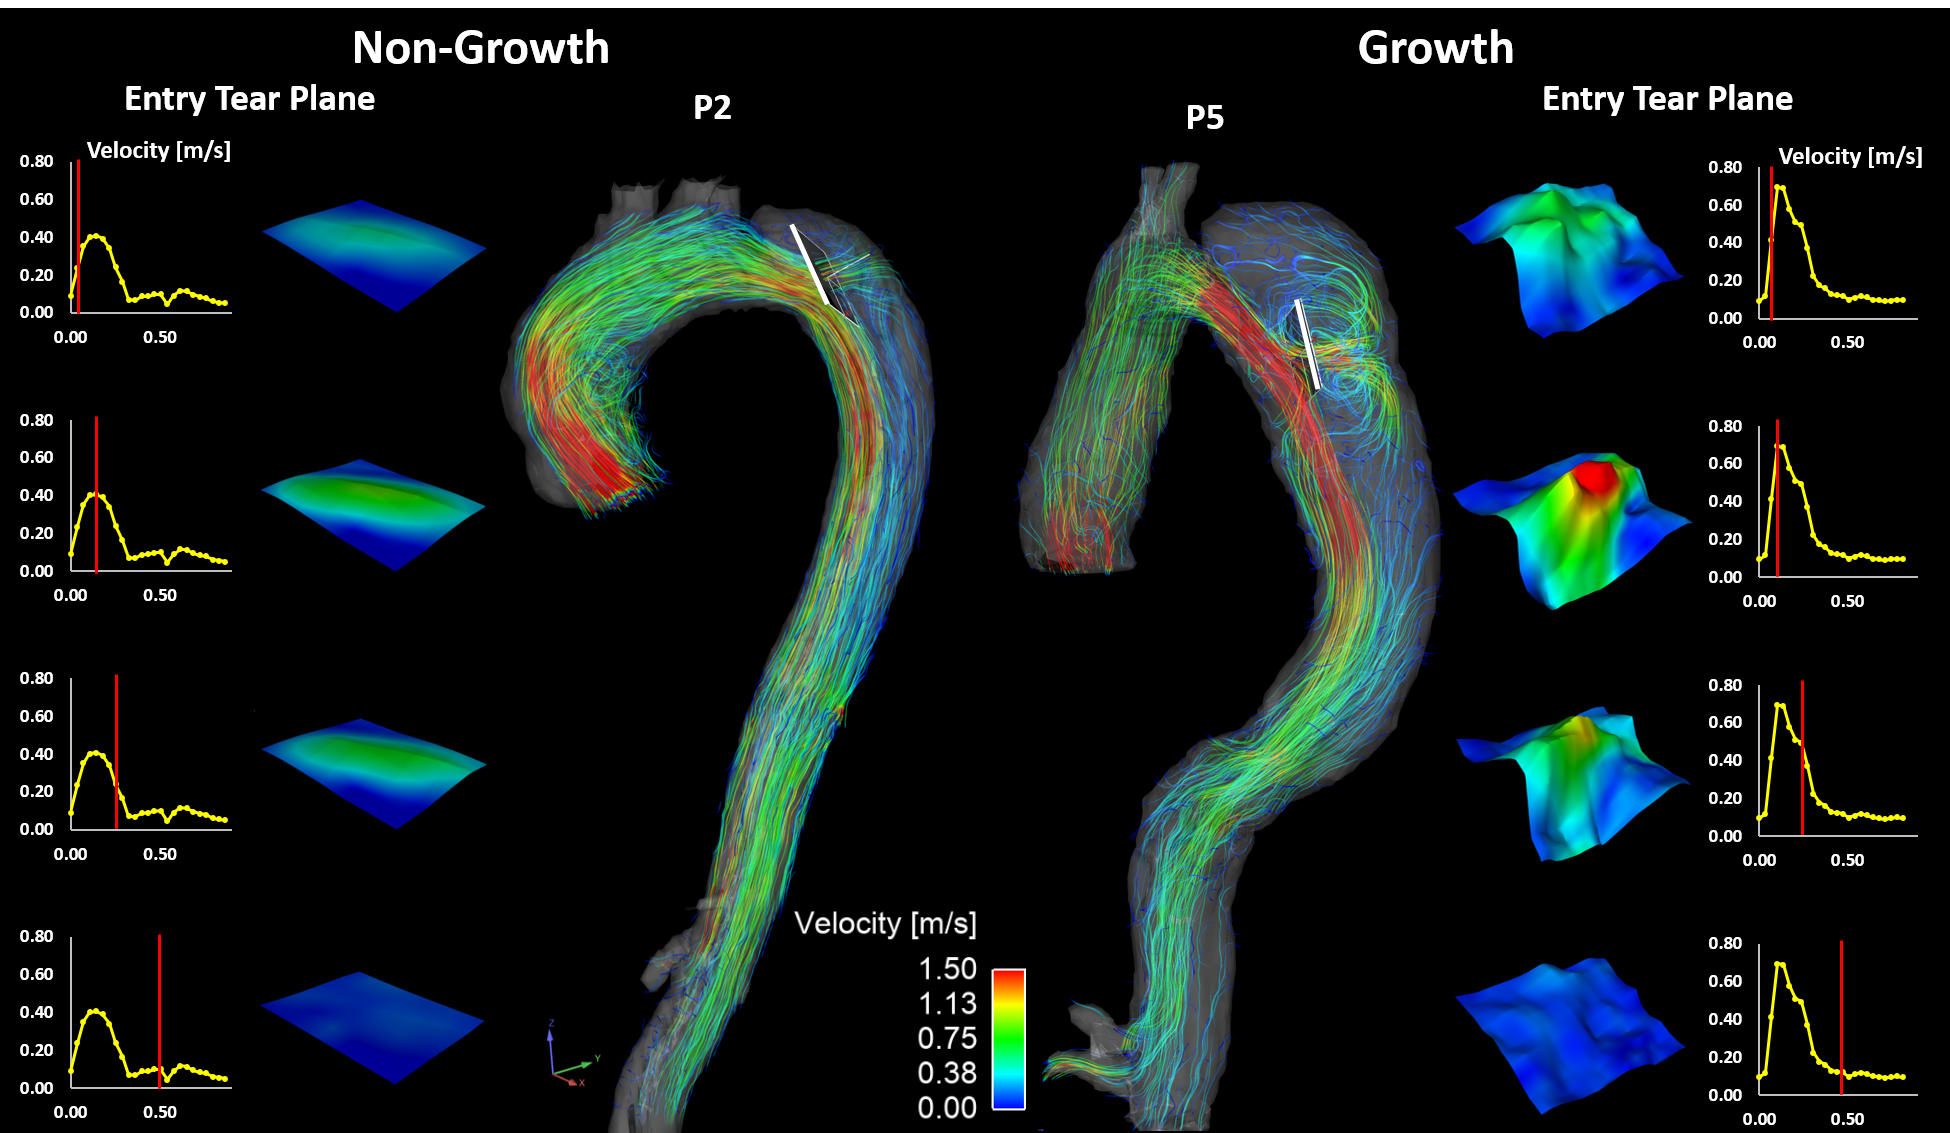
Figure 2. Representative non-growth (P2) and growth (P5) cases of the entry tear flow analysis over the cardiac cycle.
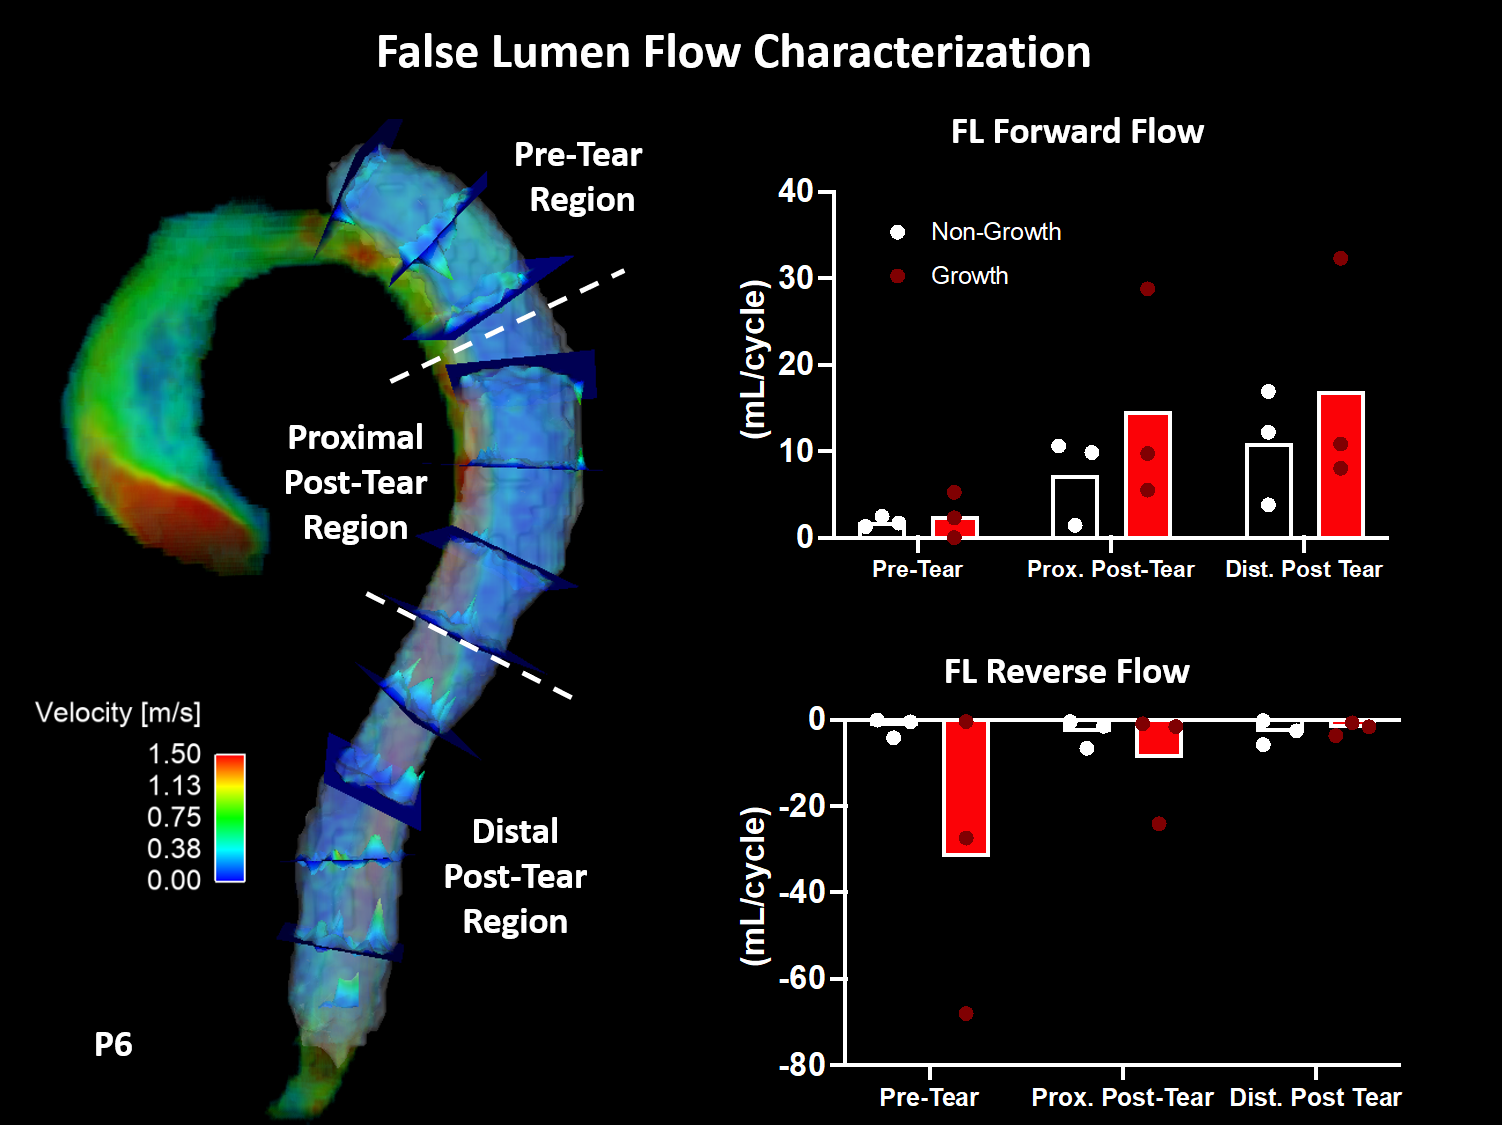
Figure 3. False lumen plane analysis. Places placed every 2 cm throughout the false lumen (shown in P6) with forward and reverse flow averaged for non-growth and growth cases in three regions (pre-tear, proximal post-tear, and distal post-tear; FL = false lumen).
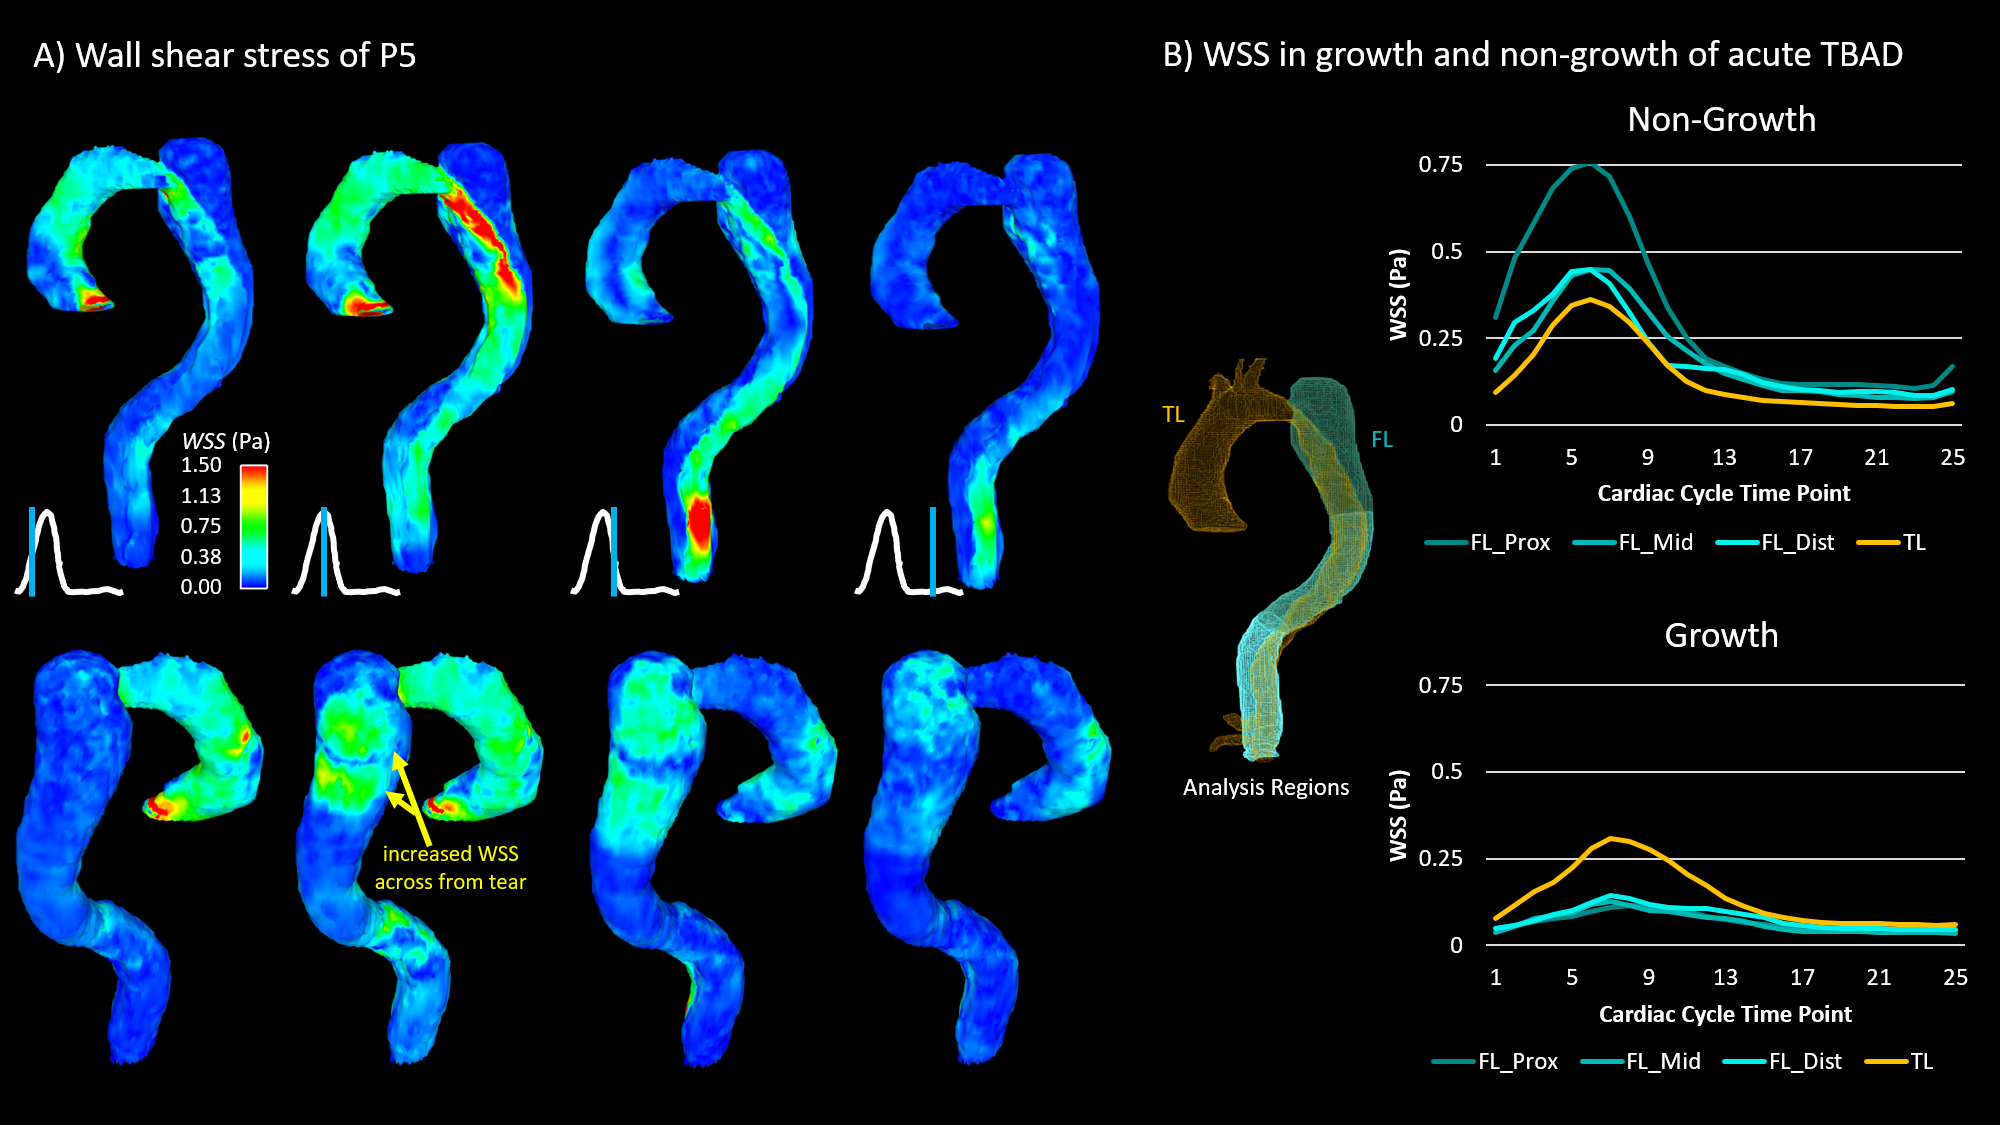
Figure 4. Wall shear stress analysis of non-growth and growth cases. P5 is shown to highlight the increased wall shear stress in the false lumen across from the entry tear. (TL = true lumen; FL = false lumen).
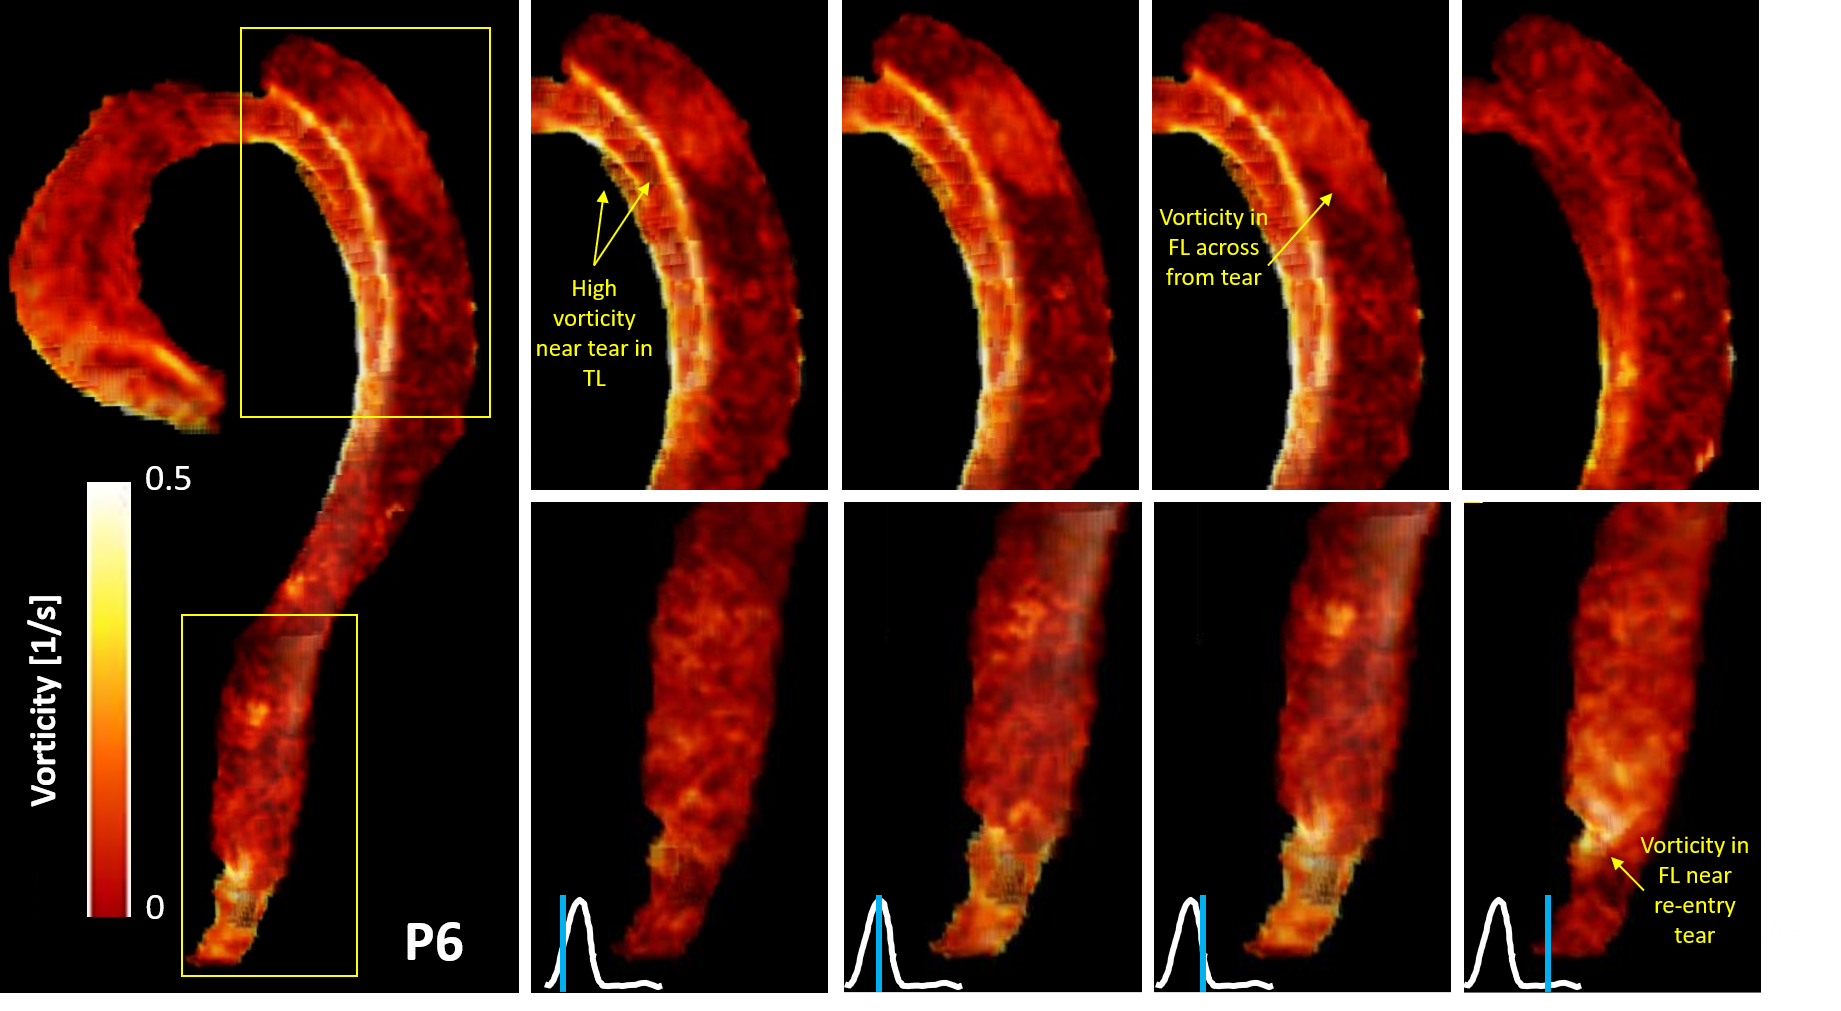
Figure 5. Vorticity analysis in the true and false lumen over the cardiac cycle with representative case, P6, shown. Areas of high vorticity are visible at the entry and exit tears. (TL = true lumen; FL = false lumen).