4763
Retrospective Multisite Multisoftware Analysis of Intravoxel Incoherent Motion (IVIM) Breast MRI1Center for Advanced Imaging Innovation and Research (CAI2R), Department of Radiology, New York University Grossman School of Medicine, New York, NY, United States, 2Department of Radiology, Memorial Sloan Kettering Cancer Center, New York, NY, United States, 3Department of Radiology, University of Washington, Seattle, WA, United States, 4Department of Diagnostic Imaging and Nuclear Medicine, Kyoto University, Kyoto, Japan, 5Department of Circulation and Medical Imaging, Norwegian University of Science and Technology, Trondheim, Norway
Synopsis
Keywords: Breast, Data Analysis, Breast Tumor
Motivation: Intravoxel incoherent motion (IVIM) MRI is helpful in breast tumor characterization, but variable performance exists in the literature.
Goal(s): Translational assessment of multisite breast lesion data based on the 1st order radiomics features from each IVIM parameters perfusion fraction (fp), pseudodiffusivity (Dp) and tissue diffusivity (Dt) derived from multiple software platforms.
Approach: This work used retrospective anonymized breast MRI data from three sites employing three different software to estimate the 1st order radiomics of fp, Dp and Dt, their software robustness, and diagnostic utility.
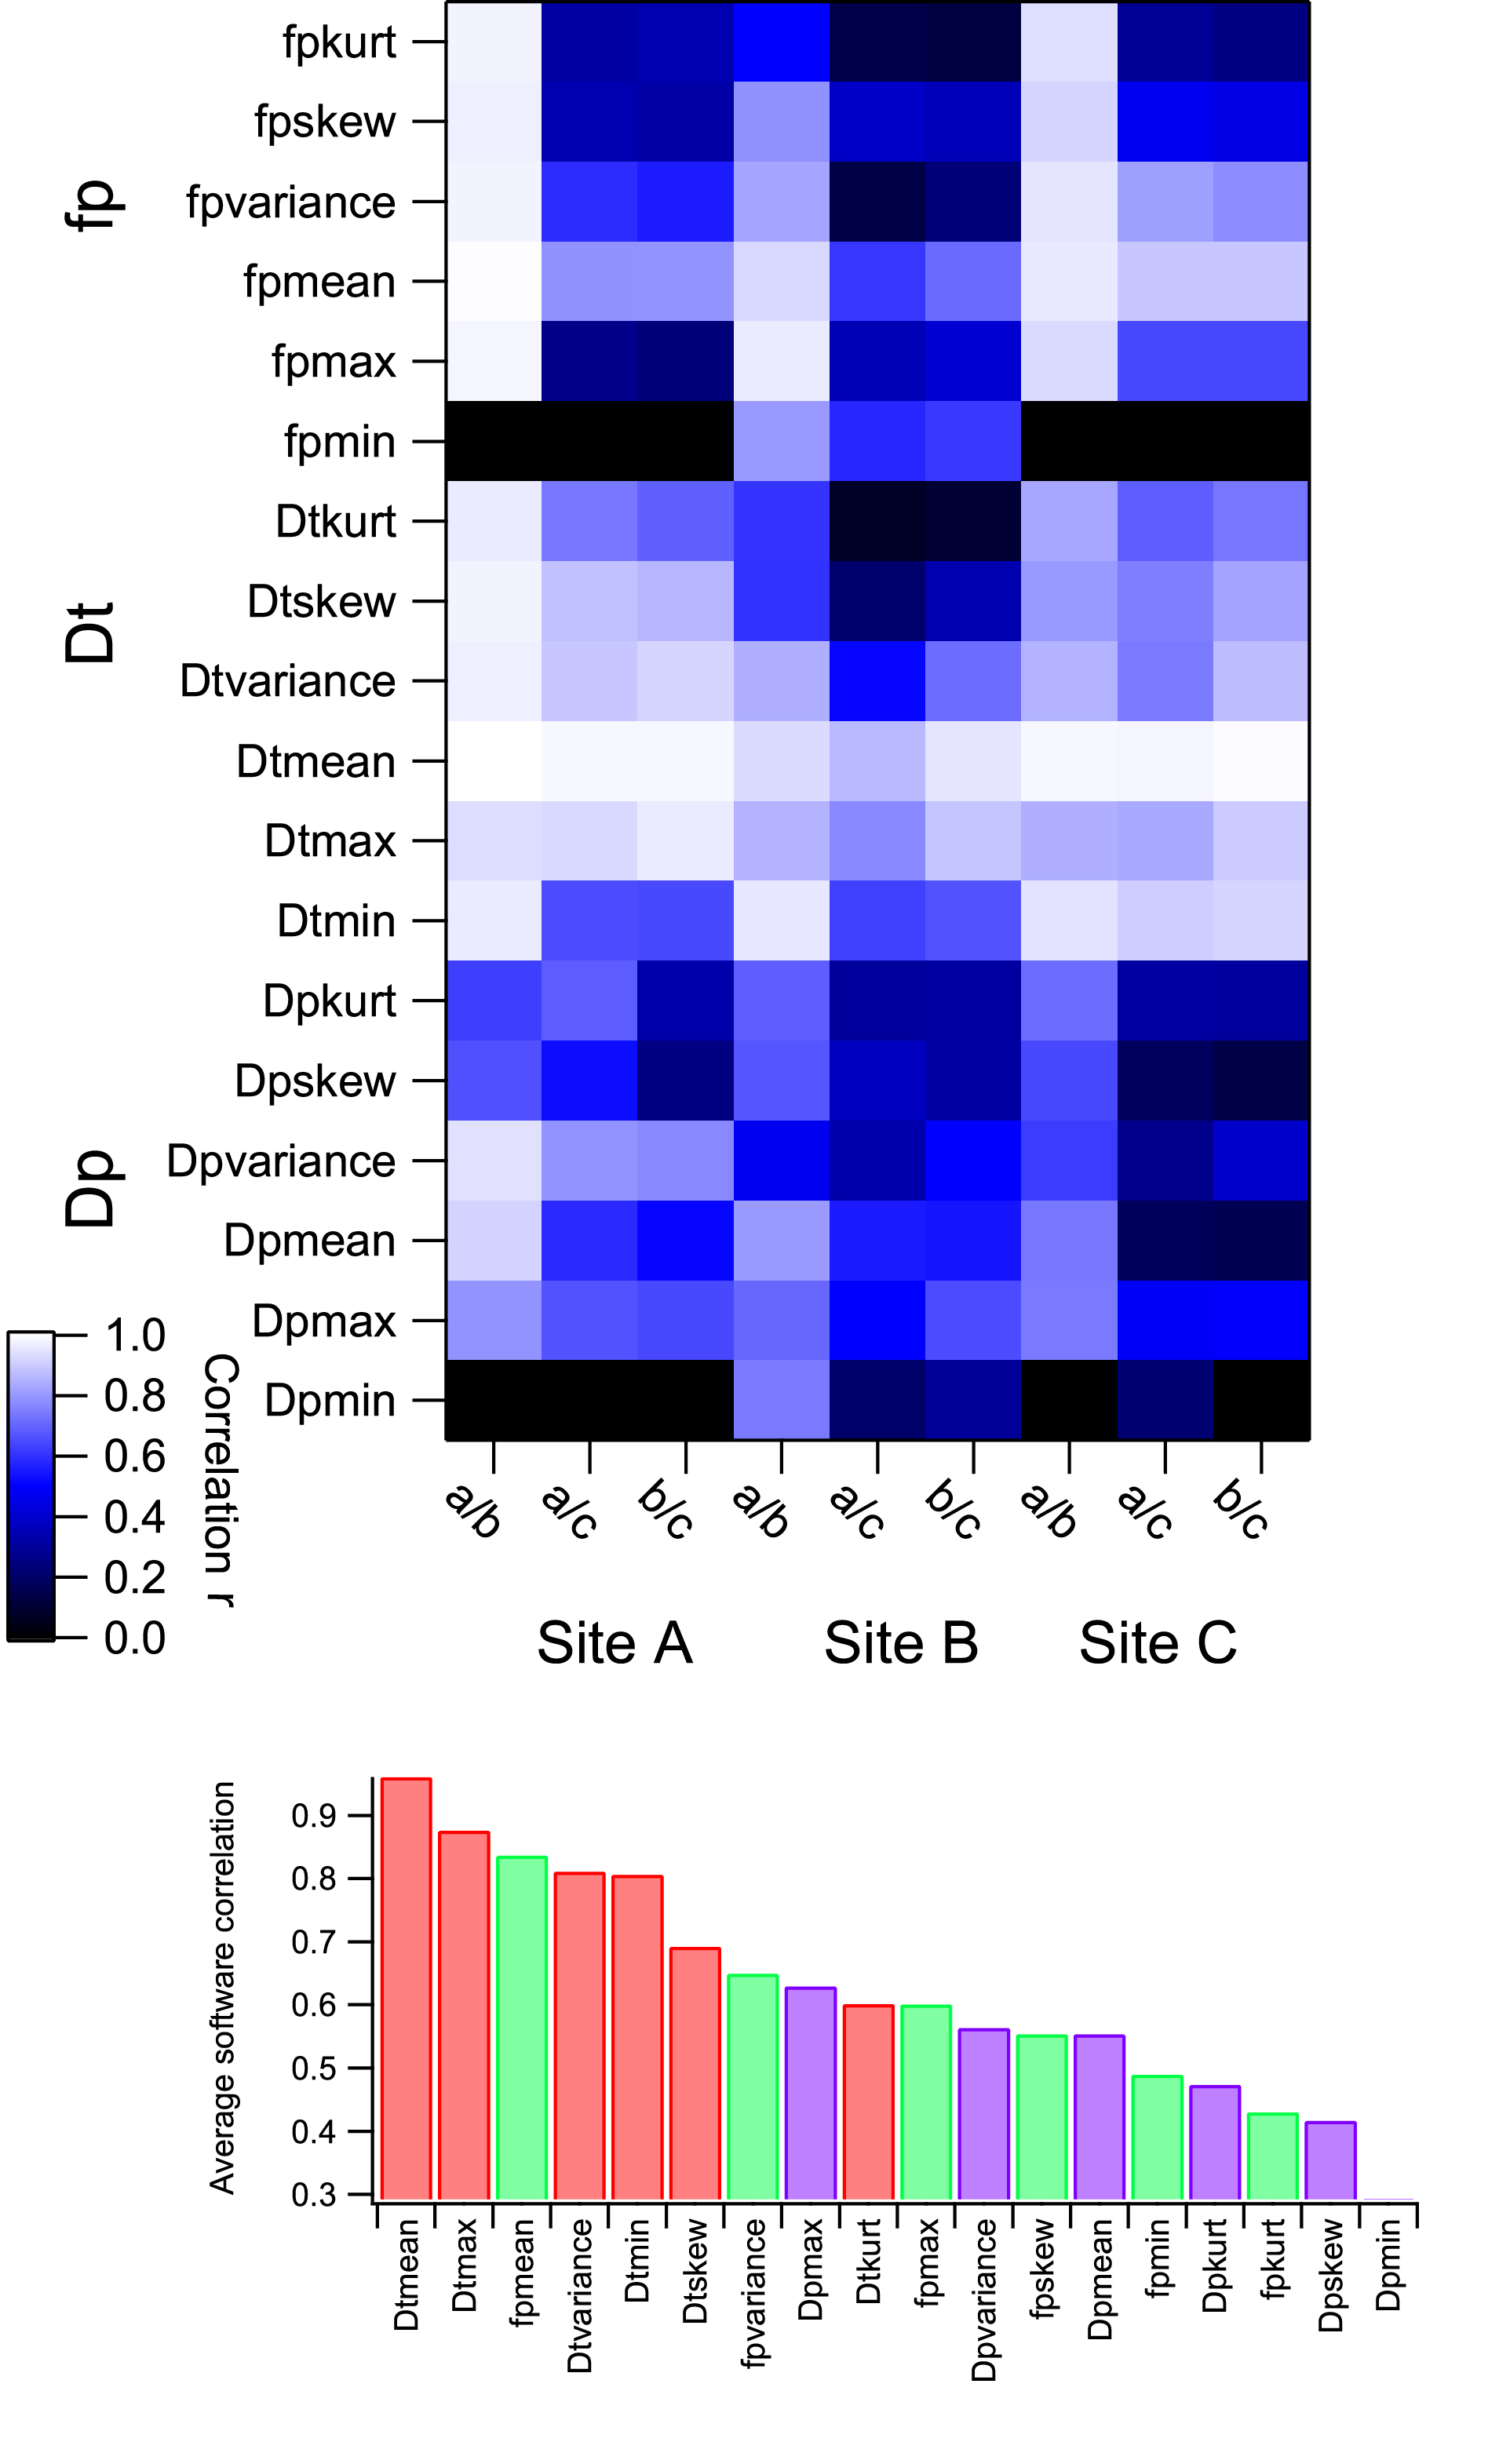
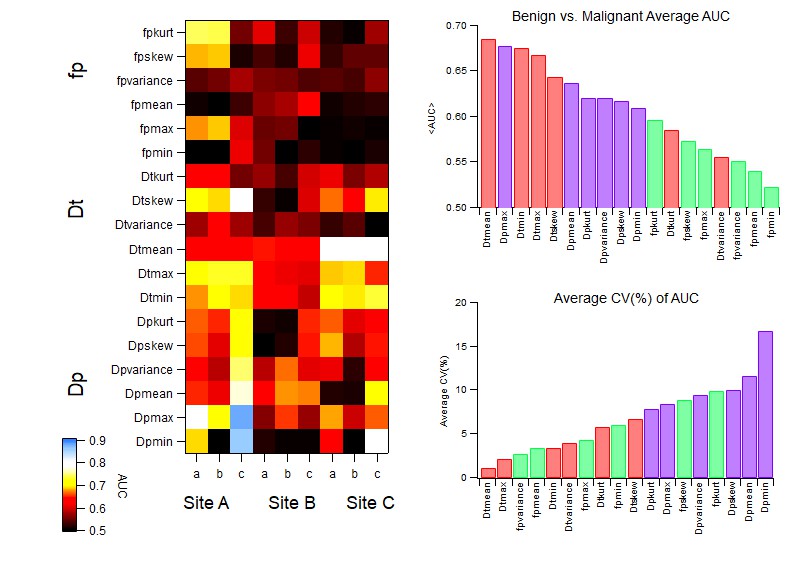
Results: Dtmean, Dtminimum, and fpmean showed robustness across site/software; and Dtmean, Dtminimum showed highest and most consistent diagnostic utility.
Impact: Multiple 1st order radiomics features of tissue diffusivity (Dt) or perfusion fraction (fp) obtained from a heterogeneous multi-site dataset showed software robustness and/or diagnostic utility, supporting their potential consideration in controlled prospective trials.
Introduction
Breast cancer remains a leading cause of cancer-related deaths in women in the U.S. 1. Diffusion weighted imaging (DWI) provides imaging biomarkers for cancer characterization 2-5. Intravoxel incoherent motion (IVIM) 6-8, an advanced DWI representation sensitive to cellularity and microvascular flow has been applied extensively to both diagnostic and prognostic goals in the setting of breast cancer 9,10, constituting a growing evidence base of its clinical utility 11-13. However, heterogeneity in patient cohorts, acquisition protocols, and analysis algorithms 14-17 contribute to variable diagnostic performance between studies and can dilute the potential of the IVIM biomarkers for more widespread adoption in clinical trials or daily practice 18,19. A cross-sectional view of a large subset of available clinical data, analyzed with widely used software platforms, may be illuminating both to highlight the most robust features in the IVIM dataset and guide future harmonization efforts in multi-center trials.Methods
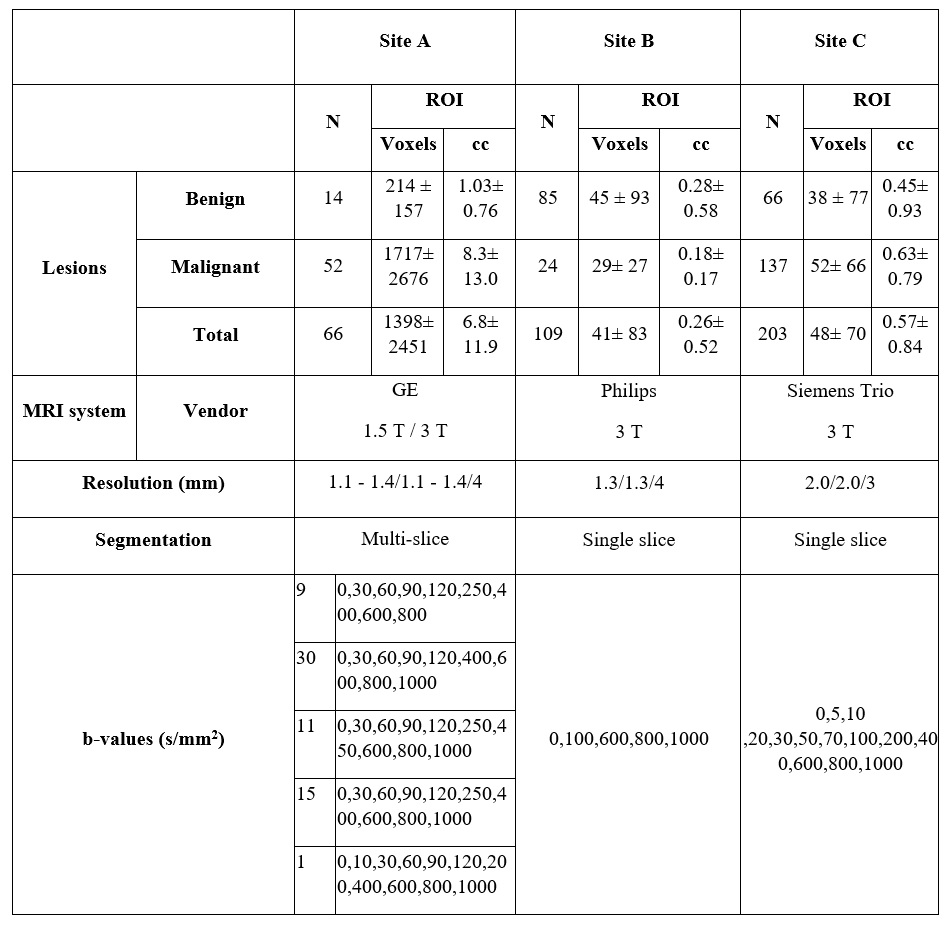
This study evaluated retrospective anonymized breast MR imaging data from three sites: Site A/Site B/Site C: 66/109/187 patients. Details of each cohort and their acquisition are listed in Table 1, including the number of biopsy-confirmed benign/malignant lesions. IVIM data from Site A/Site B/Site C were independently analyzed using three software packages: a shareware tool with least-squares segmented fitting (Firevoxel, https://firevoxel.org/ (Software a)), an MR vendor commercial package with least squares segmented fitting (Siemens MR Body Diffusion Toolbox from Siemens (Software b)) and a commercial software package with Bayesian fit algorithm Olea Sphere (Software c).IVIM parameters perfusion fraction (fp), pseudodiffusivity (Dp) and tissue diffusivity (Dt) were extracted from the region of interest (ROI) outlining the lesion. Histogram analysis was performed within Firevoxel (100 bins, fp: 0 – 1, Dp: 0 – 0.1 mm2/s and Dt: 0 – 0.003 mm2/s) to estimate 1st order radiomics features from each parameter: mean/minimum/maximum/variance/skewness/kurtosis. The Pearson correlation coefficient of IVIM parameters for the aforementioned radiomics features was computed between each pair of software at each site separately. Average correlation coefficient over all software pairs and sites was computed for each metric and ranked in numerical order for assessment of consistency of performance of a clinical task. Analysis was performed in MATLAB.
Within each context of site/software, each IVIM metric was tested for benign/malignant differentiation via nonparametric Mann-Whitney test. Area under ROC curve (AUC) was quantified for each context separately. Average AUC for all contexts was calculated. Within software coefficient of variation (CV) for each site were determined and averaged over sites. These average metrics were than ranked in numerical order for assessment of consistency of performance of a clinical task. Analysis was performed in IBM SPSS v. 28.0.1.1.
Results
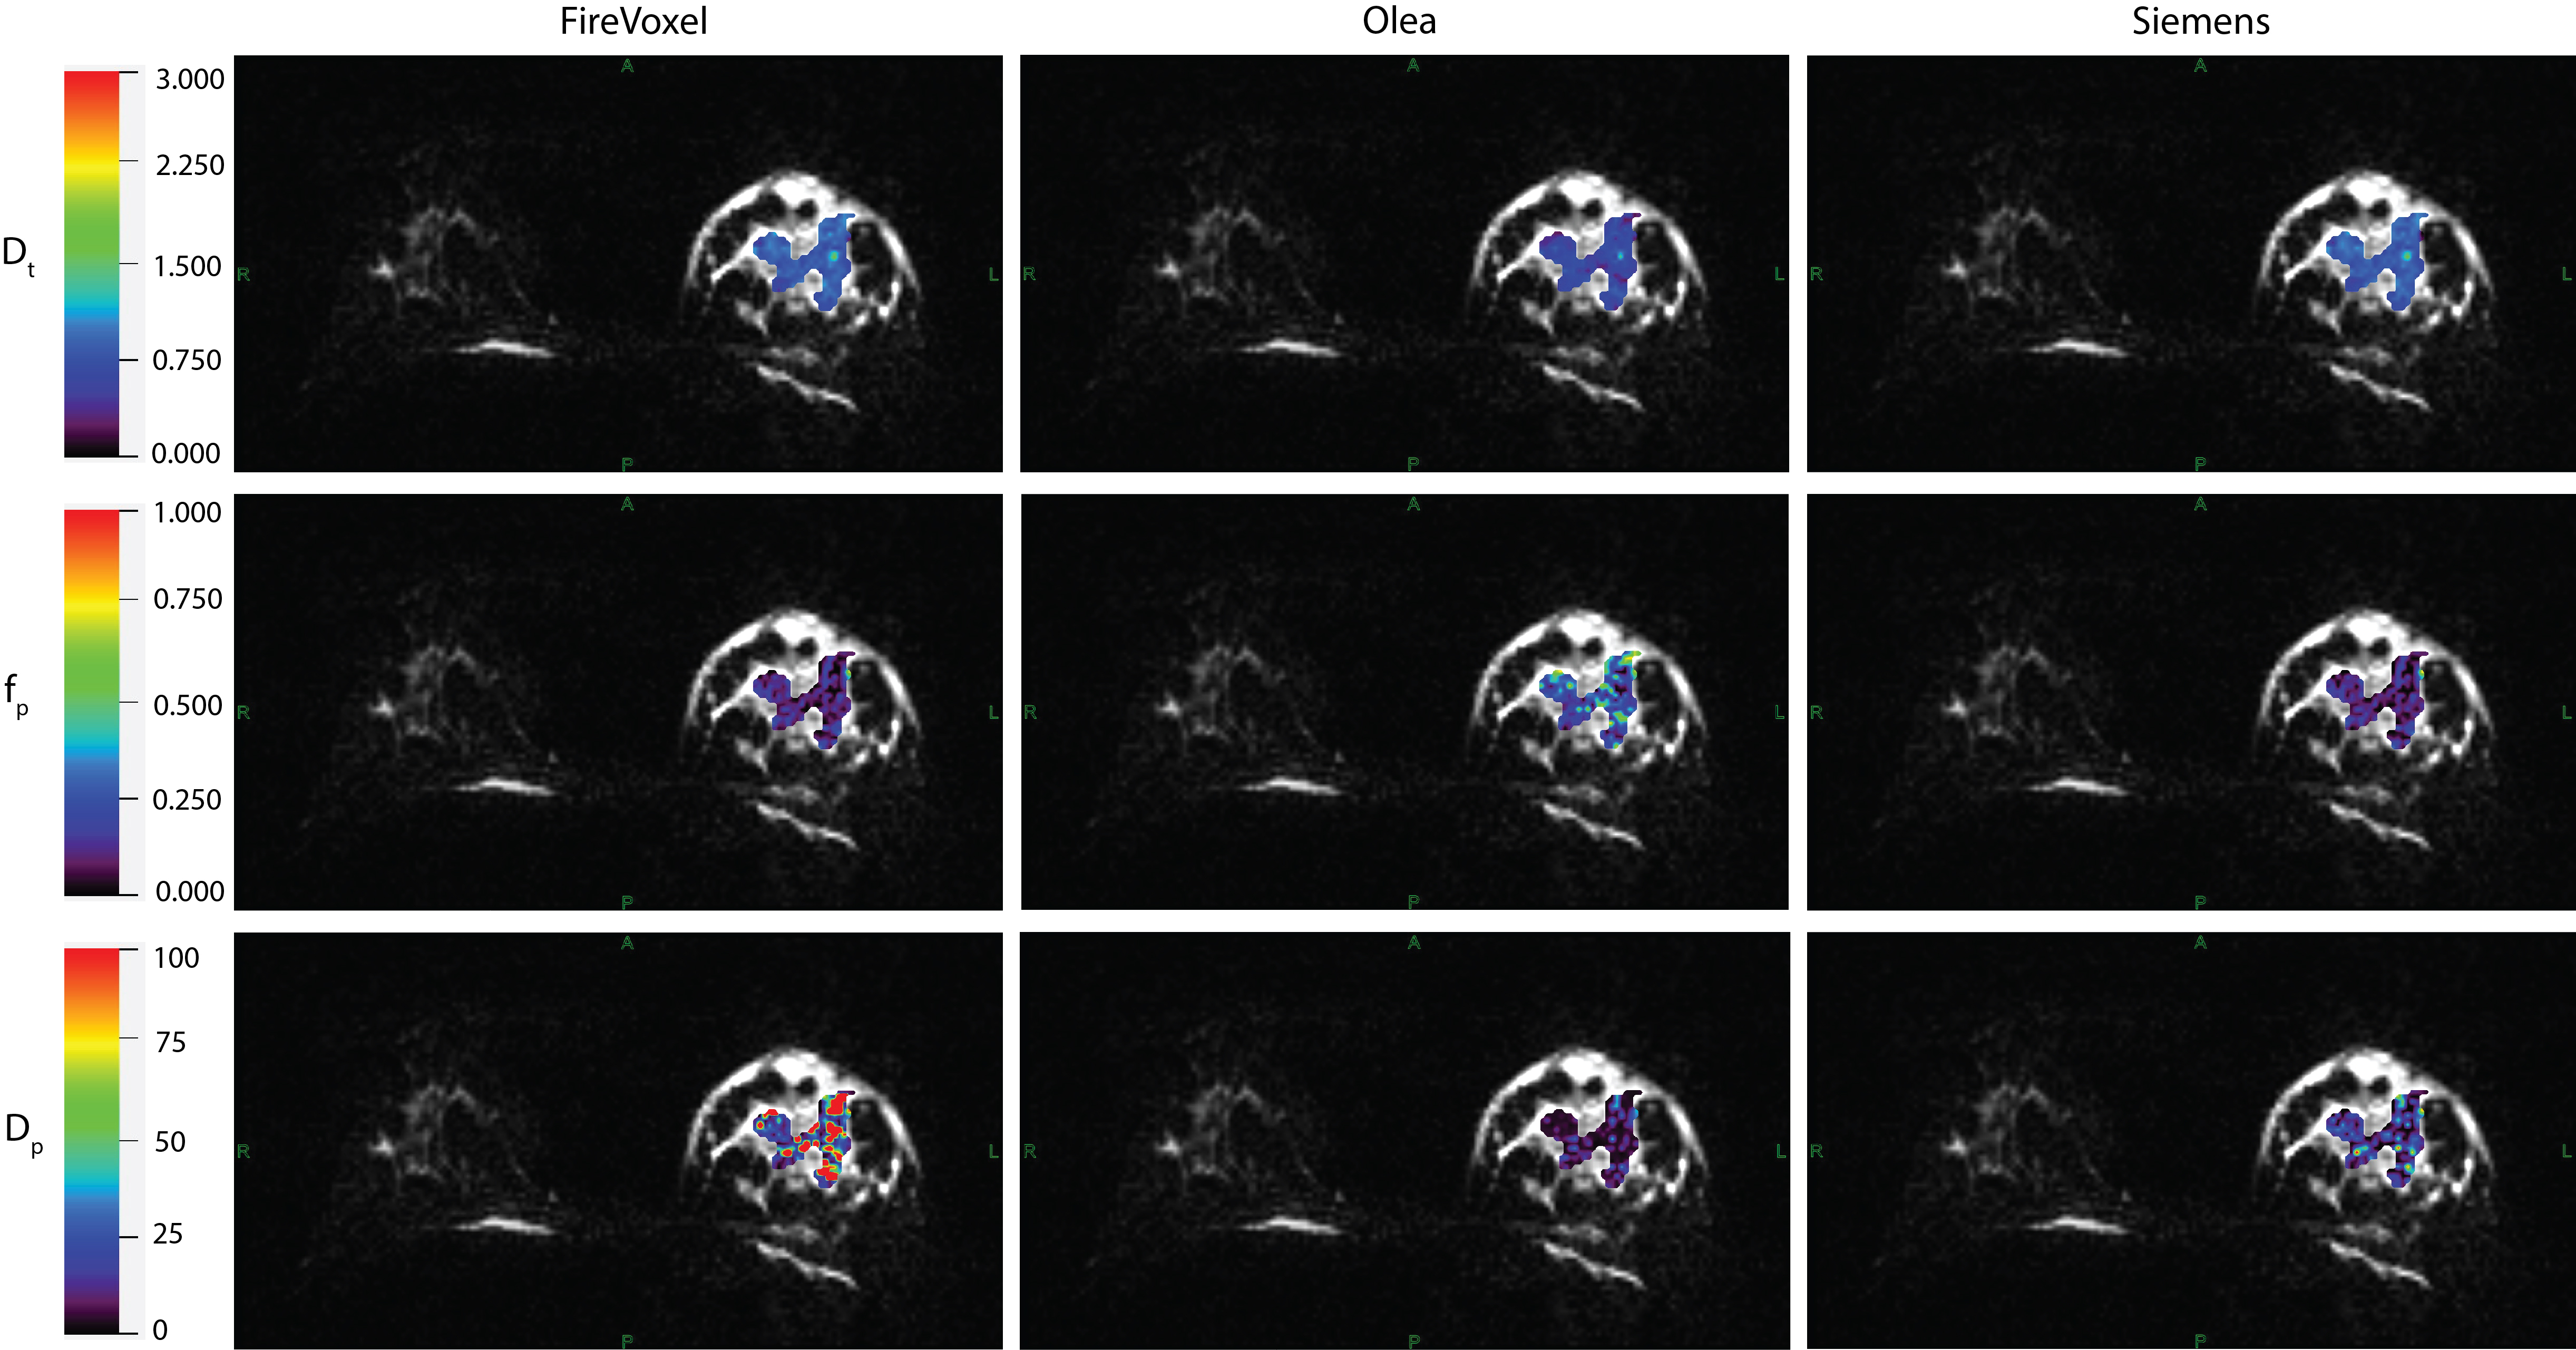
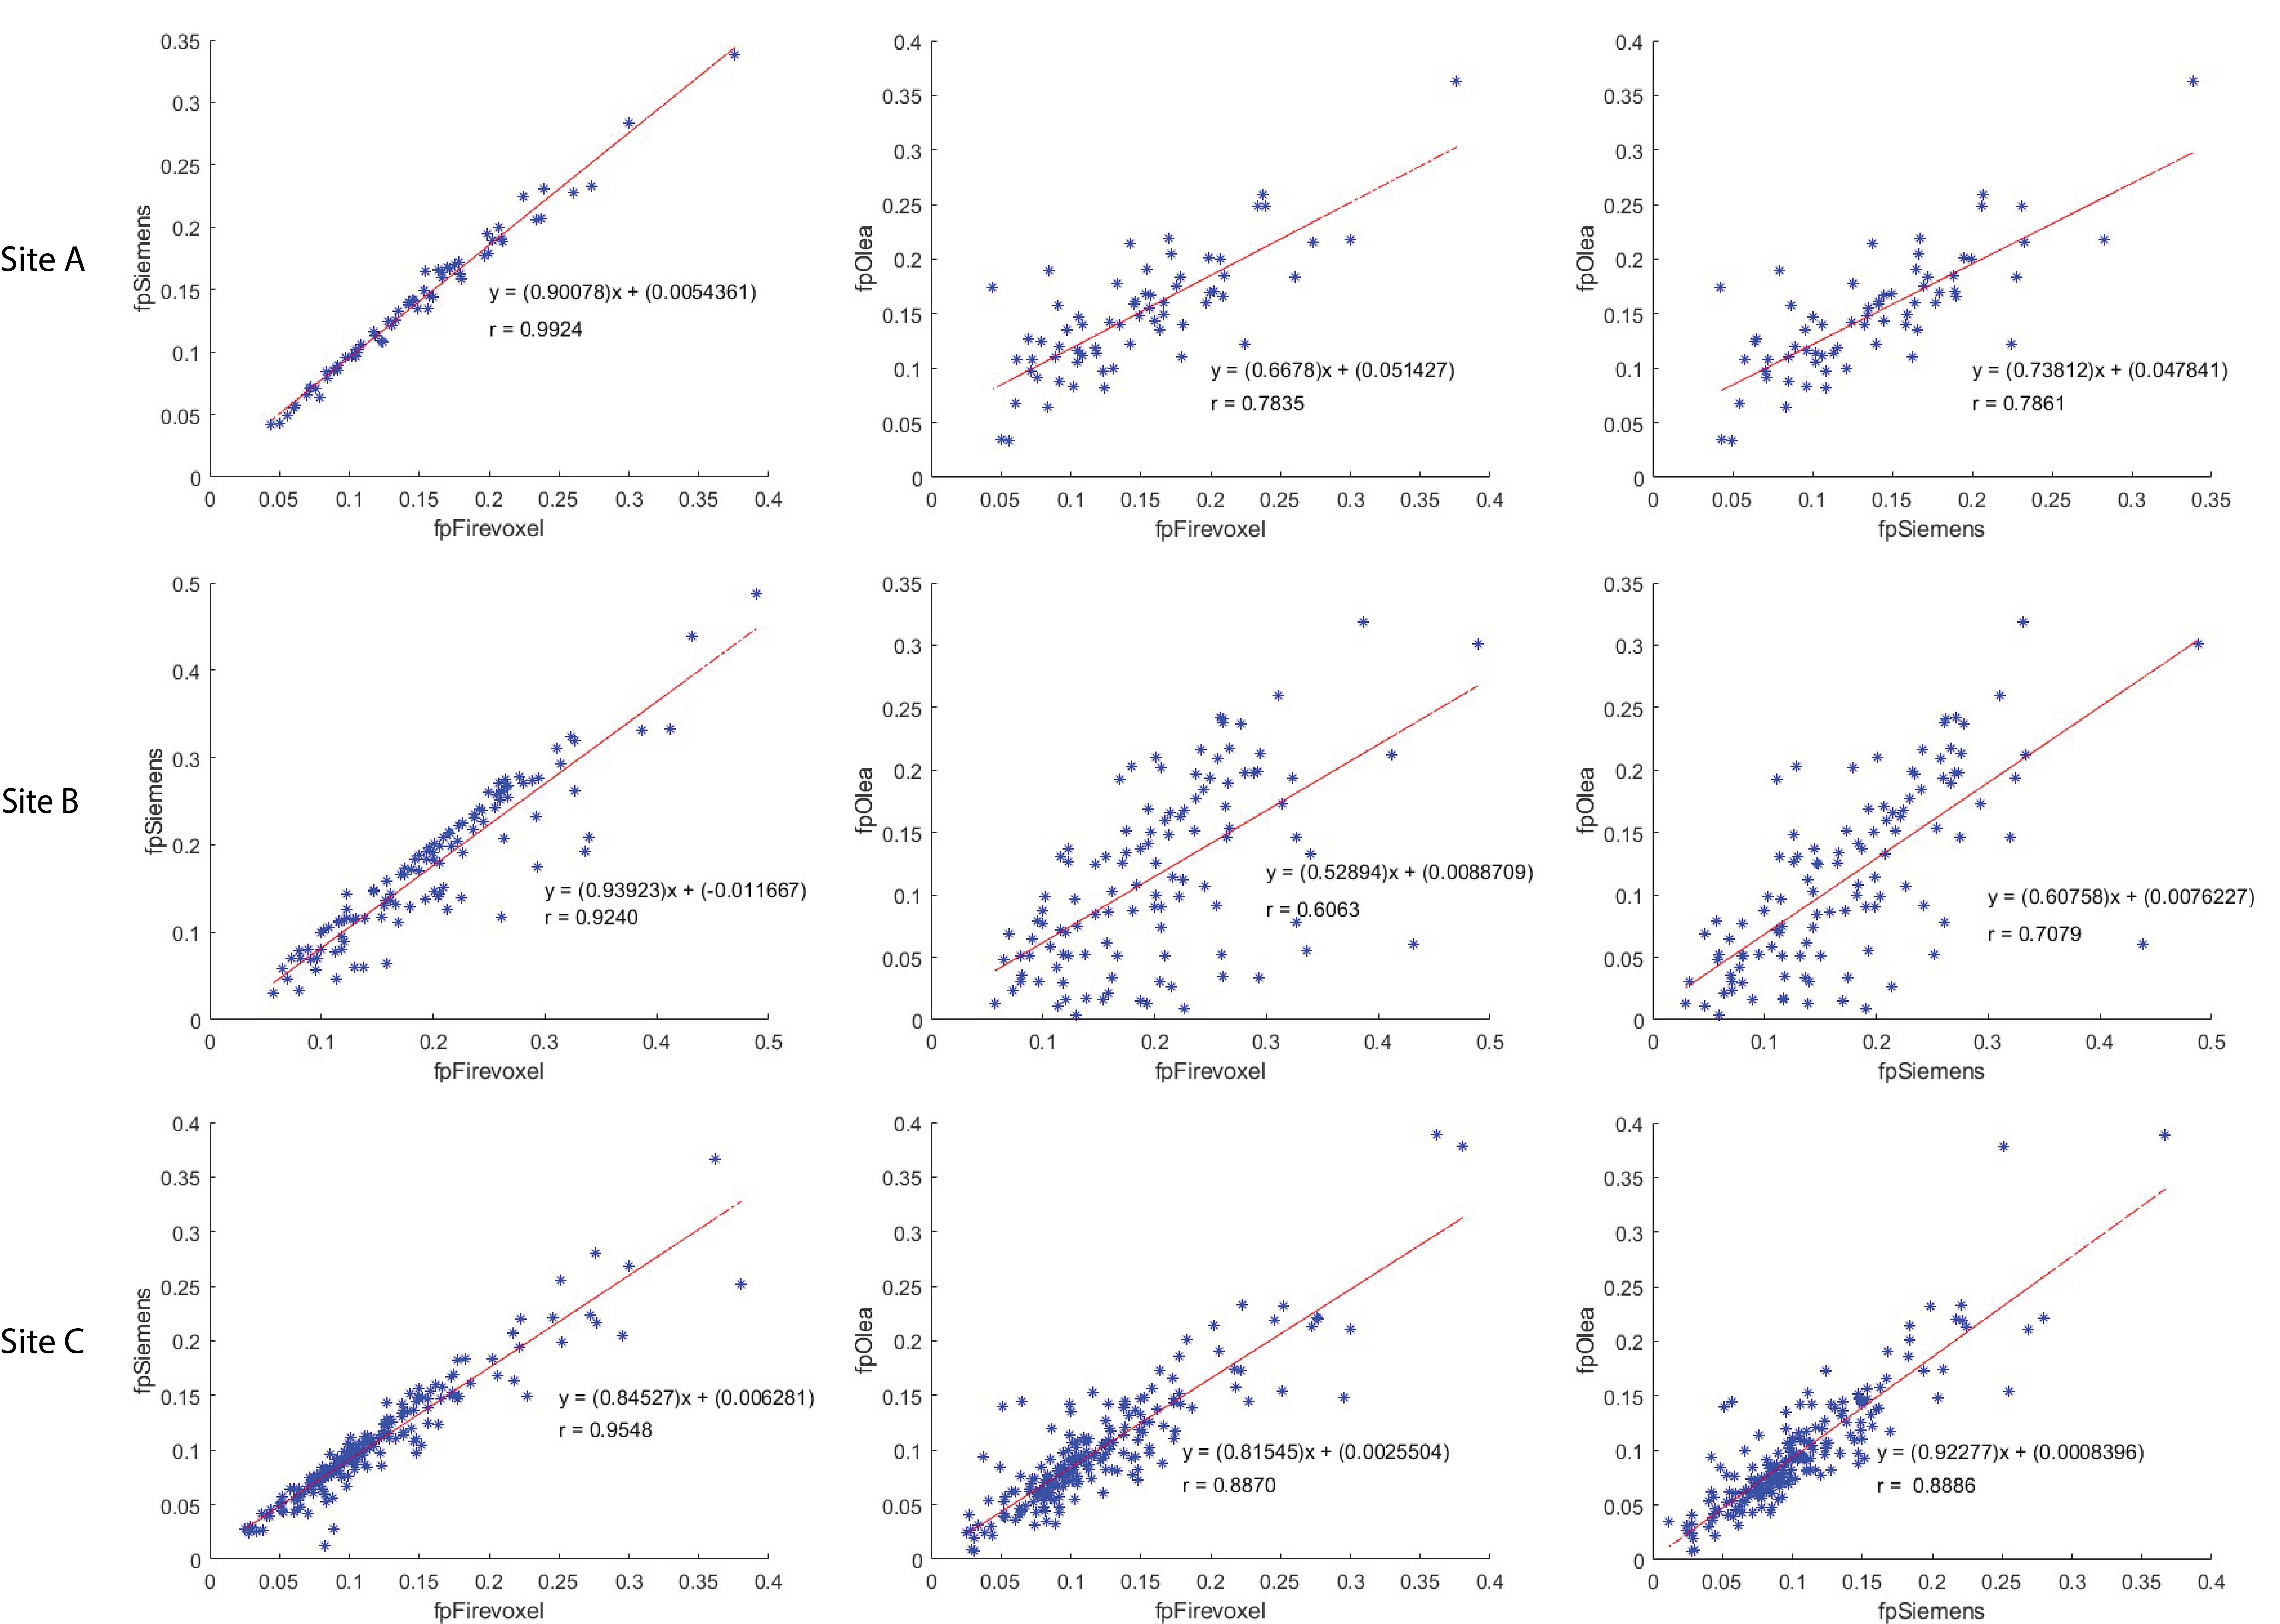
IVIM parameter maps obtained from each software in a benign breast lesion for Site C are shown in Fig. 1. The correlations between the three software for mean fp at each site are shown in Fig. 2. Fig. 3 shows the correlation coefficients for all metrics in all site/software contexts as well as their ranked average. The average AUC for benign and malignant differentiation as well as average CV (%) of AUC is shown in Fig. 4. Among the 18 metrics and 9 contexts, a total of 62 metrics showed significant (p<0.05) benign/malignant differentiation in a given context (28 Dp, 27 Dt and 7 fp metrics). Software a/Software b/Software c produced 20/18/24 cases. The metric with the most frequent differentiation (8/9) was minimum Dt, while several metrics (Dt variance, fp minimum, and fp variance) showed no differentiation in any context.Discussion
Results of this study indicate some variability in software robustness and benign/malignant differentiation among multi-site data. Some site variability (lesion size, b-value distribution, cohort size, selection criteria) limits consistency and prevent some metrics (such as mean fp in Site B or fp skewness/kurtosis in Site A) with clinical utility in individual site/software context from behaving universally. Conversely, several Dt metrics show both software robustness and consistently high diagnostic performance across contexts. Heterogeneity metrics (skewness, kurtosis, variance) are often diagnostic in individual contexts while mean values are more likely to show more consistent software robustness and diagnostic performance. Software correlations are highest between the least squares segmented algorithms (a/b) and mean values are the most consistent across contexts.Conclusion
Even in a heterogeneous multisite cohort with varying acquisition and analysis settings, certain 1st order IVIM radiomics features (specifically mean and minimum Dt) show potential for robustness and diagnostic applicability. Pseudodiffusion features (fp and Dp) are more sensitive to fit algorithms and clinical cohorts, but the mean fp still demonstrates potential for consistent behavior among site/software contexts that controlled prospective studies might leverage.Acknowledgements
We acknowledge support from the National Institutes of Health (NIH). We also thank Mahesh Keerthivasan and Robert Grimm at Siemens and Astrid Saulnier at Olea for all the useful discussions and help extended. We would also like to express our sincere gratitude to Masako Kataoka from Kyoto University, Kyoto, Japan.References
1. DeSantis, C.E., et al., Breast cancer statistics, 2019. Ca-a Cancer Journal for Clinicians, 2019. 69(6): p. 438-451.
2. Padhani, A.R., et al., Diffusion-weighted magnetic resonance imaging as a cancer biomarker: consensus and recommendations. Neoplasia, 2009. 11(2): p. 102-25.
3. Gullo, R.L., et al., Update on DWI for Breast Cancer Diagnosis and Treatment Monitoring. AJR Am J Roentgenol, 2023.
4. Iima, M., et al., Diffusion MRI of the breast: Current status and future directions. Journal of Magnetic Resonance Imaging, 2020. 52(1): p. 70-90.
5. Partridge, S.C., et al., Diffusion-weighted breast MRI: Clinical applications and emerging techniques. J Magn Reson Imaging, 2017. 45(2): p. 337-355.
6. Le Bihan, D., What can we see with IVIM MRI? NeuroImage, 2019. 187: p. 56-67.
7. Lebihan, D., et al., Mr Imaging of Intravoxel Incoherent Motions - Application to Diffusion and Perfusion in Neurologic Disorders. Radiology, 1986. 161(2): p. 401-407.
8. Iima, M., et al., Quantitative non-Gaussian diffusion and intravoxel incoherent motion magnetic resonance imaging: differentiation of malignant and benign breast lesions. Investigative radiology, 2015. 50(4): p. 205-11.
9. Bokacheva, L., et al., Intravoxel Incoherent Motion Diffusion-Weighted MRI at 3.0 T Differentiates Malignant Breast Lesions From Benign Lesions and Breast Parenchyma. Journal of Magnetic Resonance Imaging, 2014. 40(4): p. 813-823.
10. Sigmund, E.E., et al., Intravoxel Incoherent Motion Imaging of Tumor Microenvironment in Locally Advanced Breast Cancer. Magnetic Resonance in Medicine, 2011. 65(5): p. 1437-1447.
11. Yao, F.-F. and Y. Zhang, A review of quantitative diffusion-weighted MR imaging for breast cancer: Towards noninvasive biomarker. Clinical Imaging, 2023. 98: p. 36-58.
12. Liang, J., et al., Intravoxel Incoherent Motion Diffusion-Weighted Imaging for Quantitative Differentiation of Breast Tumors: A Meta-Analysis. Frontiers in Oncology, 2020. 10.
13. Ma, W., et al., Distinguishing between benign and malignant breast lesions using diffusion weighted imaging and intravoxel incoherent motion: A systematic review and meta-analysis. European Journal of Radiology, 2021. 141: p. 109809.
14. Vidić, I., et al., Accuracy of breast cancer lesion classification using intravoxel incoherent motion diffusion-weighted imaging is improved by the inclusion of global or local prior knowledge with bayesian methods. Journal of Magnetic Resonance Imaging, 2019. 50: p. 1478-1488.
15. Gurney-Champion, O.J., et al., Comparison of six fit algorithms for the intravoxel incoherent motion model of diffusionweighted magnetic resonance imaging data of pancreatic cancer patients. PLoS ONE, 2018. 13(4): p. 1-18.
16. Taimouri, V., et al., Spatially constrained incoherent motion method improves diffusion-weighted MRI signal decay analysis in the liver and spleen. Med Phys, 2015. 42(4): p. 1895-903.
17. Barbieri, S., et al., Impact of the calculation algorithm on biexponential fitting of diffusion-weighted MRI in upper abdominal organs. Magnetic Resonance in Medicine, 2016. 75(5): p. 2175-2184.
18. Lo Gullo, R., et al., A survey by the European Society of Breast Imaging on the implementation of breast diffusion-weighted imaging in clinical practice. Eur Radiol, 2022. 32(10): p. 6588-6597.
19. Baltzer, P., et al., Diffusion-weighted imaging of the breast-a consensus and mission statement from the EUSOBI International Breast Diffusion-Weighted Imaging working group. Eur Radiol, 2020. 30(3): p. 1436-1450.
Figures