4762
Validation of mDixonQuant and IntelliSpace Portal for Liver Iron Estimation1Radiology, Children's Hospital of Los Angeles-USC KSOM, Los Angeles, CA, United States, 2Philips Medical Systems, Best, Netherlands, 3Pediatrics and Radiology, Children's Hospital of Los Angeles-USC KSOM, Los Angeles, CA, United States
Synopsis
Keywords: Liver, Relaxometry, Iron Overload, Dixon
Motivation: Simultaneous estimation of fat, water, and iron concentrations by MRI are now available on all three major MRI vendors, but the predicted liver iron concentration (LIC) values are sparsely validated.
Goal(s): To cross validate LIC estimates generated by Philips mDixonQuant and IntelliSpace Portal (ISP) against LIC values measured by biopsy-validated, reference R2* and R2 methods
Approach: 51 subjects underwent MRI for clinical purposes, with collection of mDixonQuant, standard multiple-echo gradient echo, and Ferriscan R2 images.
Results: R2* values generated by the default mDixonQuant and ISP packages yielded accurate LIC estimates using the Garbowski calibration for LIC < 25 mg/g.
Impact: This work allows mDixonQuant and ISP to be used with confidence in the clinical setting to quantify liver siderosis in most subjects referred for iron quantification.
Introduction
Measurement of hepatic iron overload is an important clinical problem in patients with hemosiderosis from chronic transfusions, iron hyperabsorption syndromes, and liver disease. R2* or R2 relaxation values are typically calculated from gradient echo or spin-echo sequences, but both can be confounded by hepatic steatosis. Gradient echo fat-water separation techniques are becoming increasingly popular for quantitation of hepatic steatosis, however their ability to accurately quantitate hepatic iron concentration remains unclear. In this paper, we performed a cross-validation of a vendor-specific acquisition (mDixon Quant, Philips Medical Systems) and post-processing software (ISP) against two biopsy-validated acquisition and analysis methods1,2.Methods
51 subjects provided informed consent under an IRB-approved protocol(CCI14-00034). All studies were performed using a seven element torso PA coil on a 1.5T Philips Achieva. The 3D axial mDixonQuant acquisition used 67 6mm slices, inplane resolution of 3 x 3 mm, SENSE 1.8, flip angle 5 degrees, TR 6.6 ms, and 6 echoes spaced from 1.17 to 5.17 ms, collected in a 12 second breath-hold. The mDixonQuant R2* maps were processed in ISP two different ways. Firstly, three regions of interest approximately 4 cm2, spaced 4-5 cm apart, were traced in the distal liver parenchyma just below the capsule, avoiding vascular and biliary structures; the median of these three values was converted to LIC using the Garbowski calibration3. Secondly, semiautomatic liver segmentation was performed using 3D editing tools, yielding a volumetric representation and pixel histograms of liver R2* and fat fraction. Mean R2* was calculated by ISP, while the mode was visually estimated by the reader (JW) from the pixel histogram. Reference gradient echo images were collected using a standard multiecho, gradient echo sequence as previously described4. Images were postprocessed with custom Matlab scripts, using a pseudo-pixelwise fit to an exponential plus constant model4 and converted to LIC using a biopsy-validated calibration equation1. Reference spin-echo imaging was performed using the Ferriscan paradigm and proprietary post processing pipeline2. Ferriscan R2 values were converted to LIC values using the standard calibration2 as well as a modification of the FDA-approved calibration that yields more accurate results for high liver iron concentration5.Results
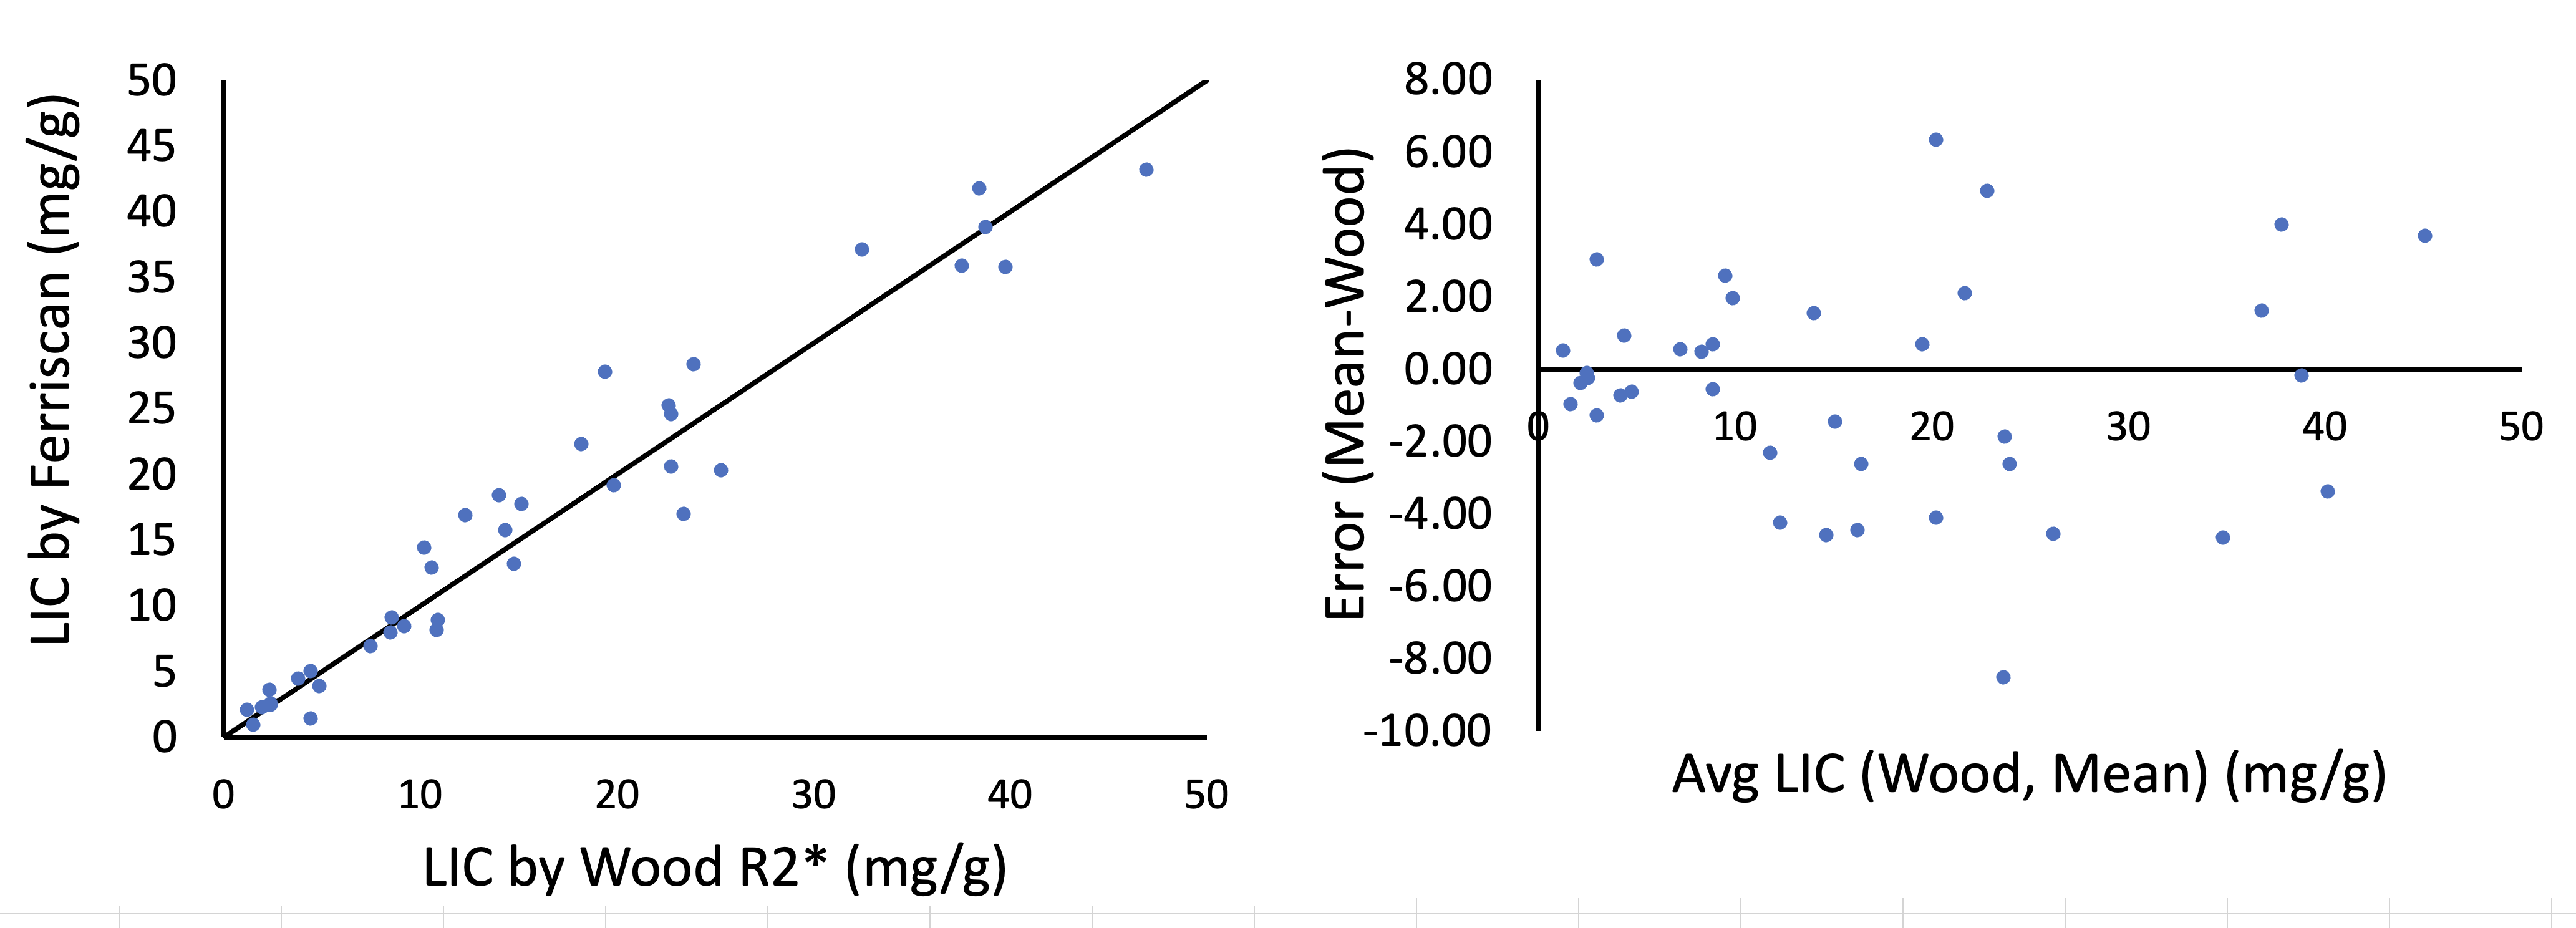
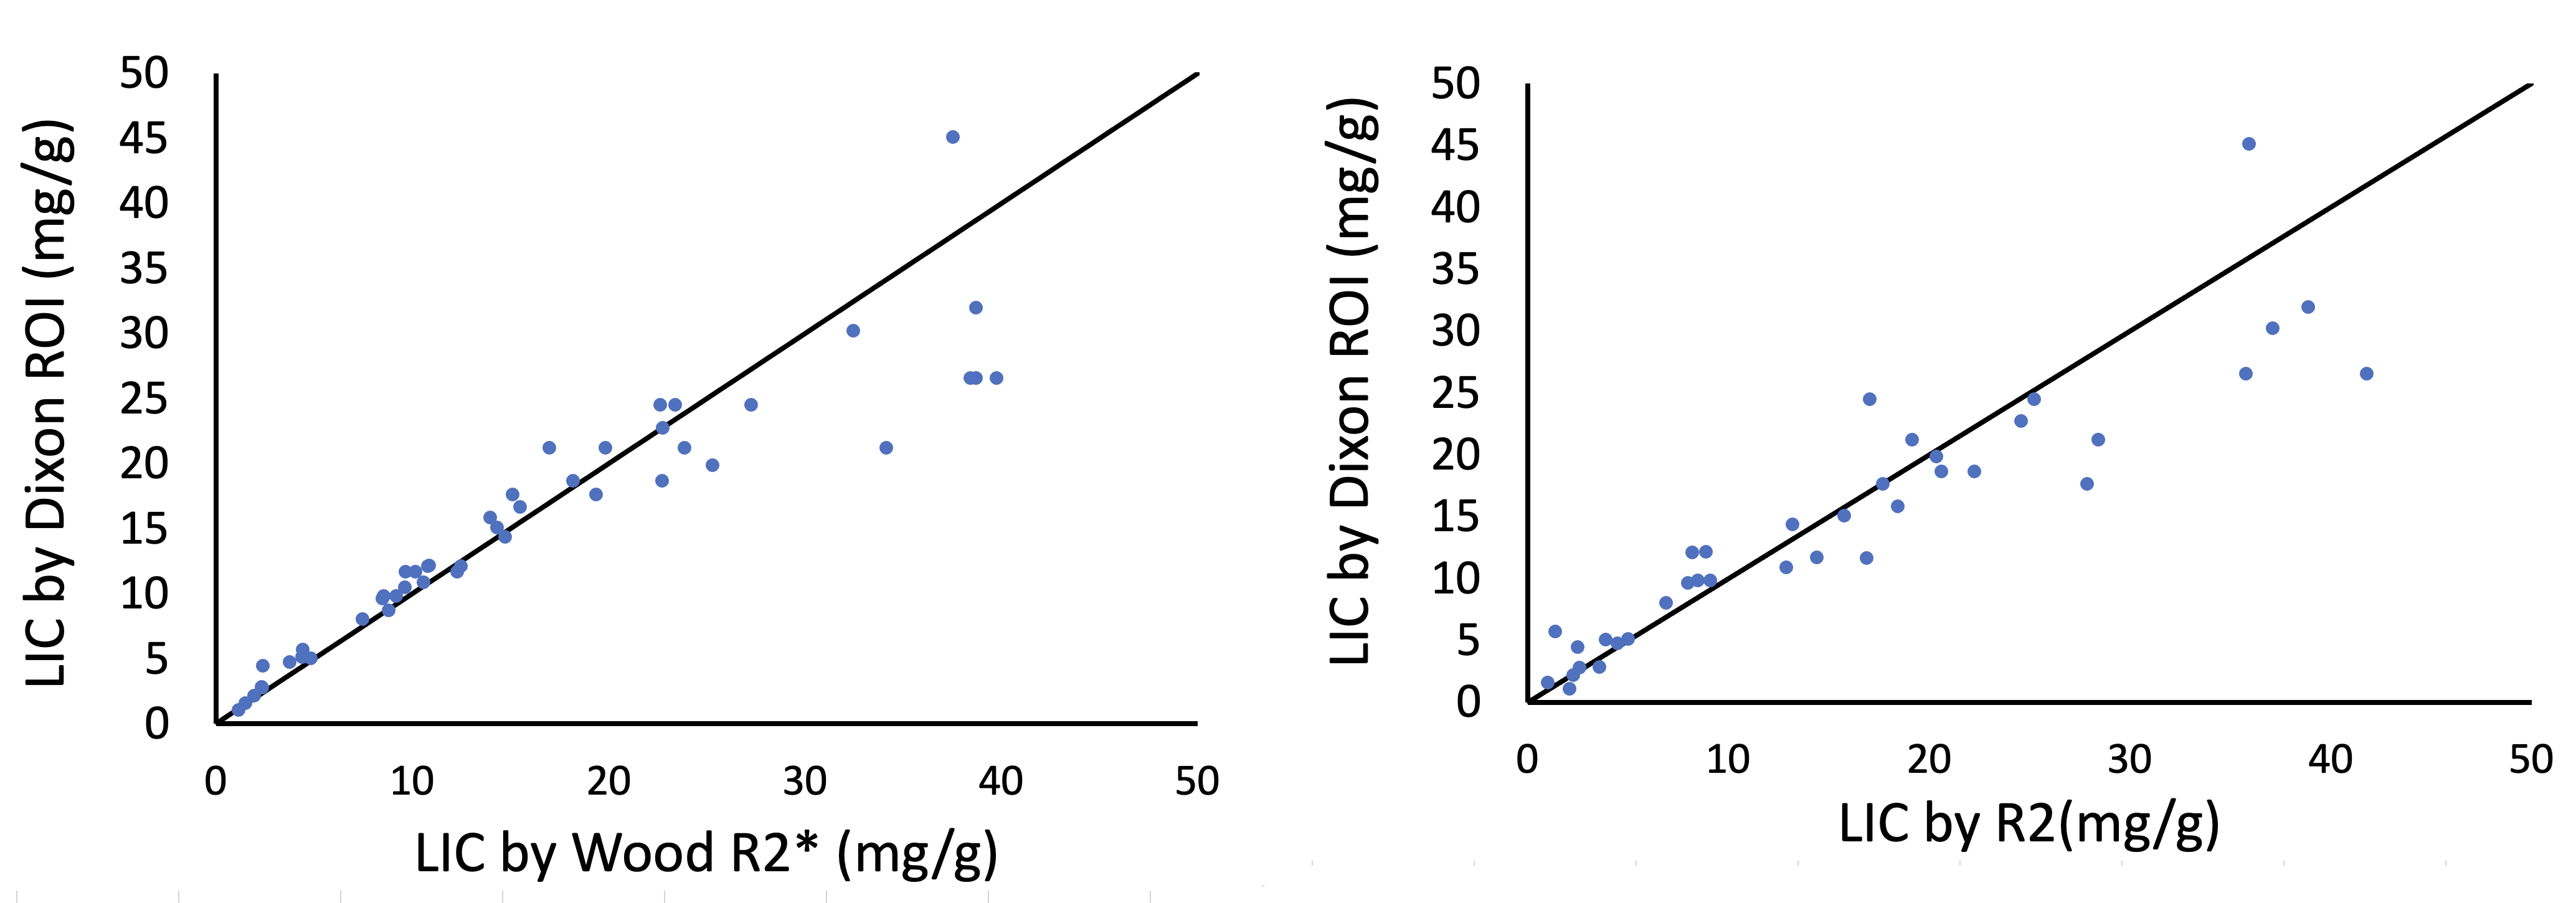
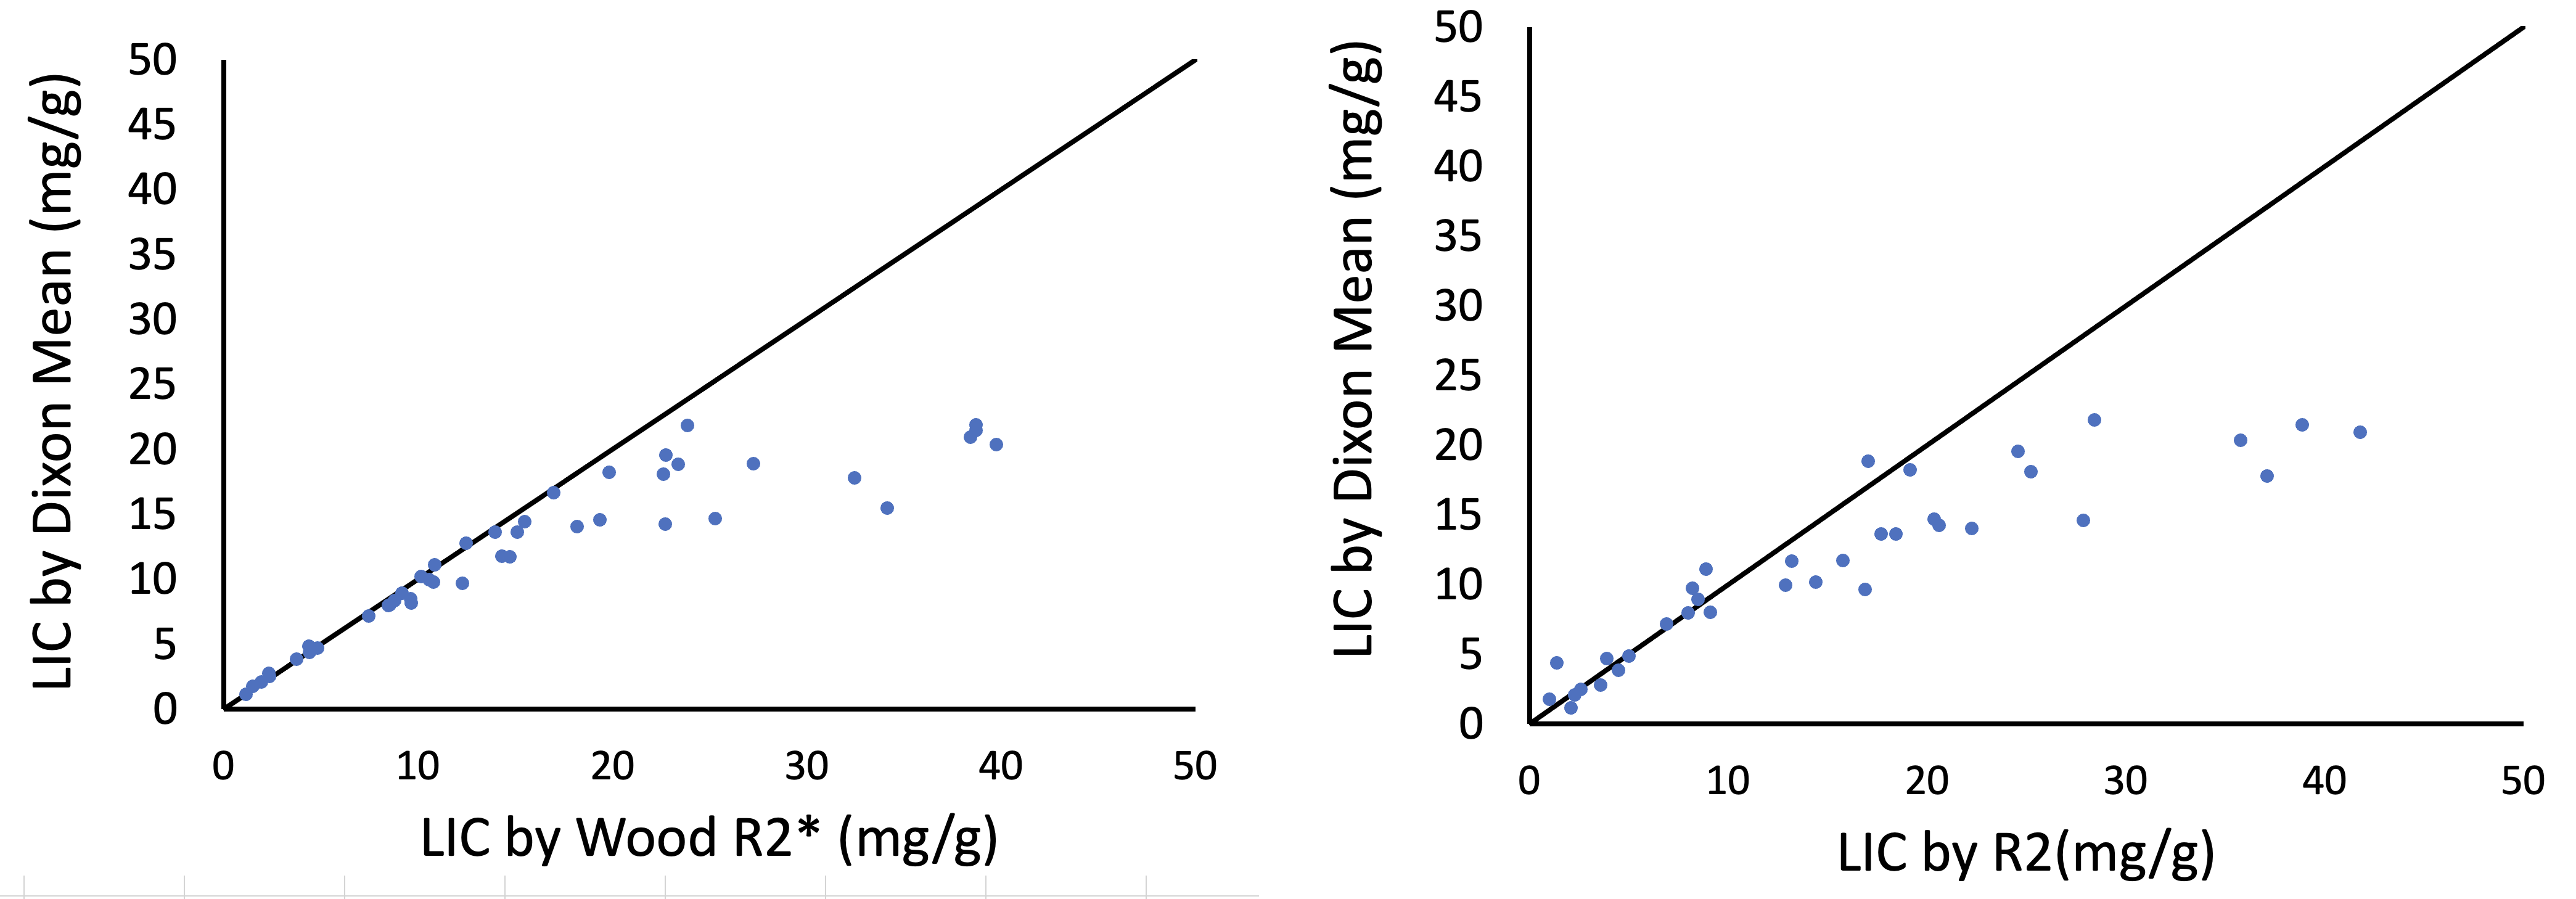
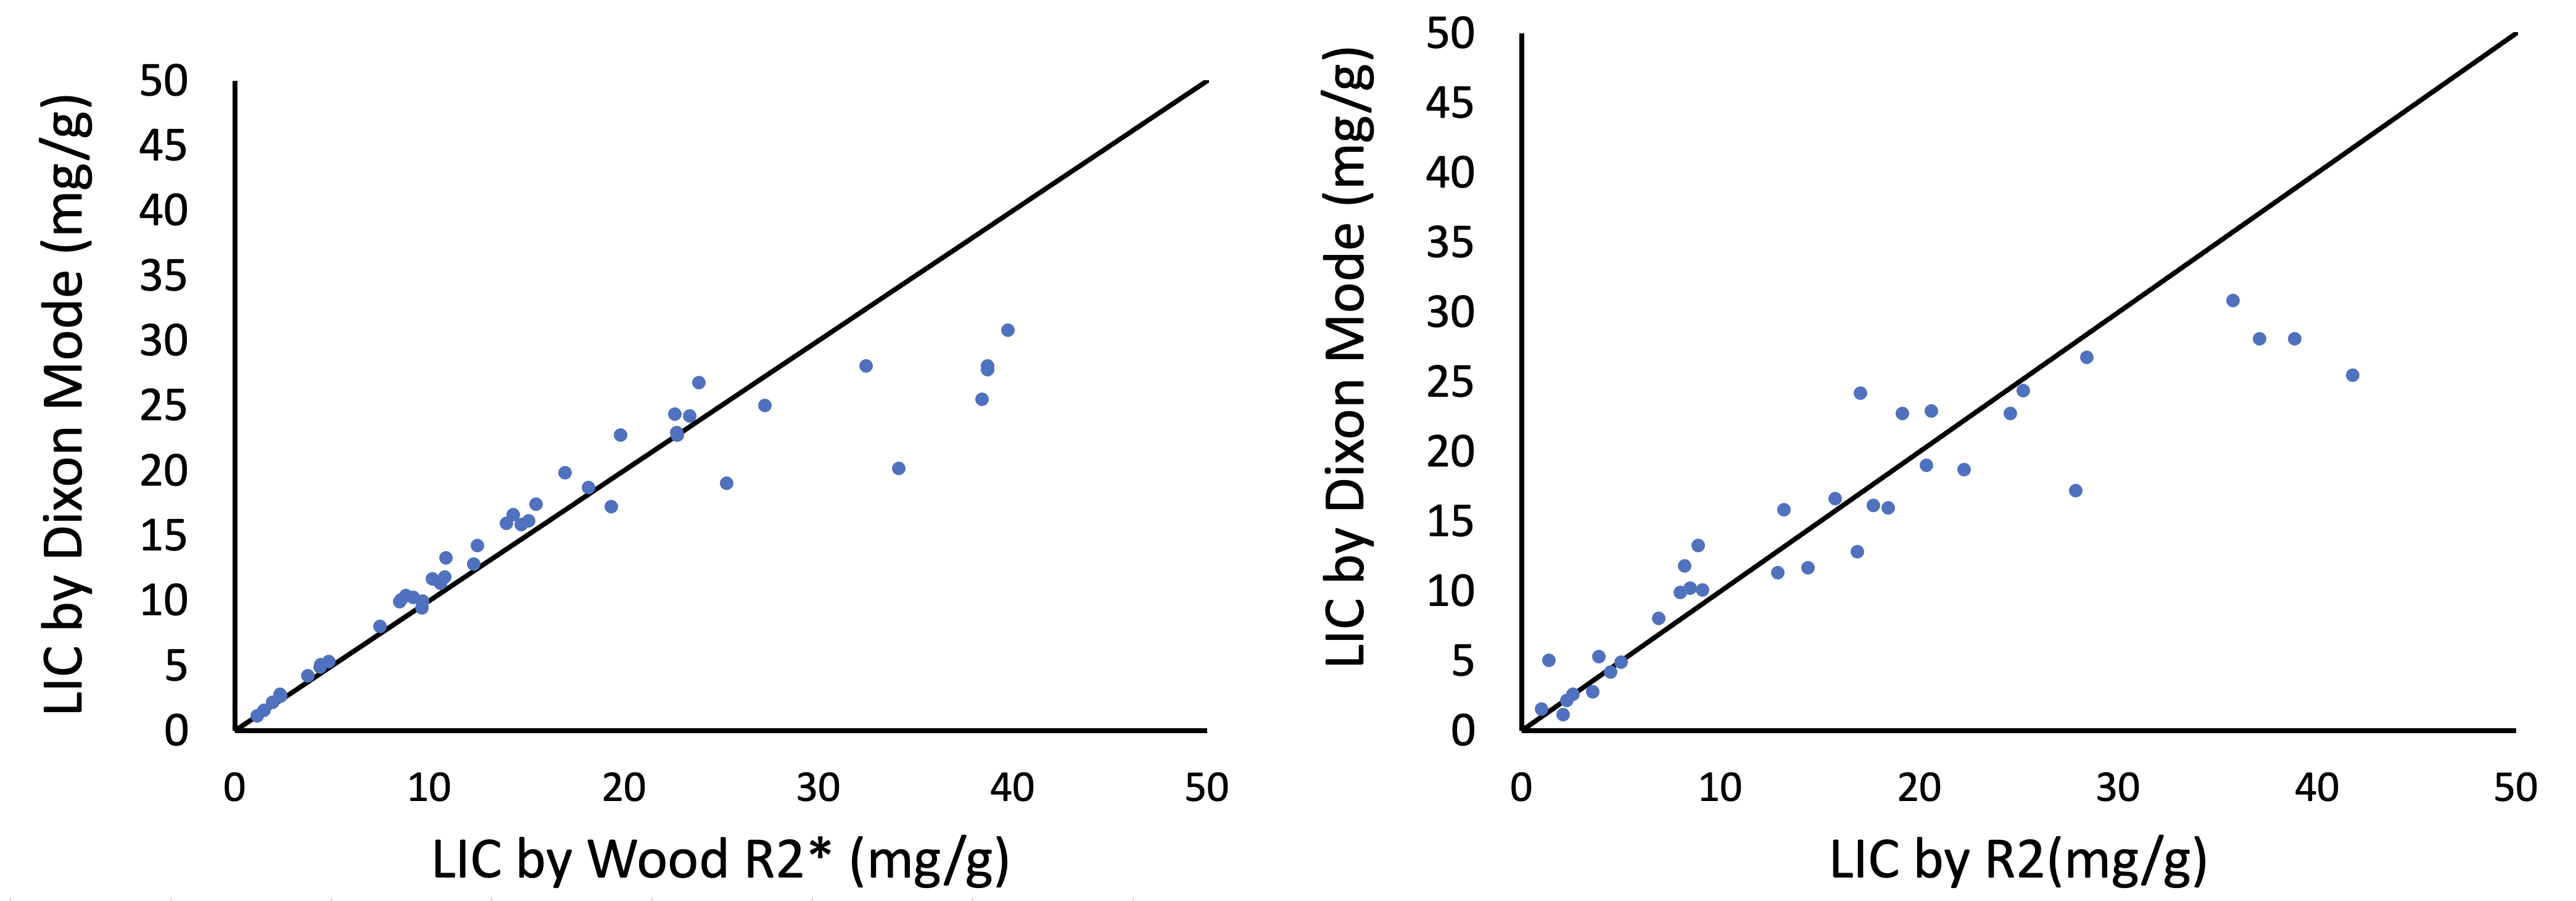
LIC was 16.6 ± 12.2 mg/g, with a range of 1.1 – 46.9 mg/g. Figure 1 demonstrates internal validation of the reference R2* and R2 techniques; the techniques are unbiased with a standard deviation of 3.1 mg/g (27.6%). Figure 2 compares the mDixon LIC (using 3 ROI) against both reference LICs. There is excellent agreement up to a LIC of 20-25 mg/g, with the mDixon method underestimating LIC for higher LICs. Figures 3 and 4 demonstrate the same relationships for the mean and mode of the pixelwise distribution across the whole liver.Discussion
So-called “Dixon” methods have been used to estimate organ steatosis for four decades5. The Philips mDixon Quant acquisition exploit multipeak spectral model to characterize fat precession6, small flip angles to lessen T1 weighting, and six echo sampling of R2* relaxation to simultaneously estimate the fat and water contributions in the liver. The product sequence is optimized for iron and fat quantitation in subjects having mild to moderate hepatic siderosis and concomitant hepatic steatosis. Our patient cohort of chronically-transfused children and adults have more severe hepatic steatosis than the product sequence was designed for, making the present data an important challenge. Despite this, mDixon Quant yielded accurate LIC estimates over most of the important clinical range (0-25 mg/g), with excessive signal loss only at higher LIC.It is important to note that the LIC dynamic range limitations are not inherent to the mDixon Quant sequence. Hernando et al was able to extend the effective dynamic range of multivendor Dixon pulse sequence for LIC estimation by using 12 echoes with shorter echo times, larger voxels, and larger flip angles7. Hernando et al, also abandoned fat estimation at high LIC values, improving R2* fit robustness at low signal-to-noise ratio.
Three important calibration considerations were also observed in this study. The Garbowski calibration is unaffected by Rician bias and is appropriate for R2* estimates calculated by complex fitting3. Secondly, it was necessary to use the alternate Ferriscan calibration5 to use Ferriscan as a reference technique at high LIC. Lastly, LIC estimates calculated by ROI tracing, voxelwise mean, and voxelwise mode were highly correlated but not interchangeable; the optimal approach is being further evaluated.
Conclusion
The product mDixonQuant and ISP postprocessing yielded highly consistent LIC estimates compared with two validated reference techniques over the LIC range that the technique was optimized. Sequence optimization and improved postprocessing may be necessary to accurately characterize LIC values > 25 mg/g at 1.5T.Acknowledgements
This work is an investigator-initiated project supported by Philips Healthcare, the National Institute for Diabetes, Digestive and Kidney Diseases(1R01DK097115-01A1) and the National Center for Research Resources (UL1 TR001855-02).References
1. Wood JC, Enriquez C, Ghugre N, et al. MRI R2 and R2* mapping accurately estimates hepatic iron concentration in transfusion-dependent thalassemia and sickle cell disease patients. Blood. 2005;106(4):1460-1465.Doyle E, Ghugre N, Coates TD, Wood JC. Fixing the MRI R2-iron calibration in liver. Am J Hematol. 2020;95(5):E120-E122.
2. St Pierre TG, Clark PR, Chua-anusorn W, et al. Noninvasive measurement and imaging of liver iron concentrations using proton magnetic resonance. Blood. 2005;105(2):855-861.
3. Garbowski MW, Carpenter JP, Smith G, et al. Biopsy-based calibration of T2* magnetic resonance for estimation of liver iron concentration and comparison with R2 Ferriscan. J Cardiovasc Magn Reson. 2014;16:40.
4. Meloni A, Zmyewski H, Rienhoff HY, Jr., et al. Fast approximation to pixelwise relaxivity maps: validation in iron overloaded subjects. Magn Reson Imaging. 2013;31(7):1074-1080.
5. Doyle E, Ghugre N, Coates TD, Wood JC. Fixing the MRI R2-iron calibration in liver. Am J Hematol. 2020;95(5):E120-E122.
6. Dixon WT. Simple proton spectroscopic imaging. Radiology. 1984;153(1):189-194.
7. Reeder SB, Robson PM, Yu H, et al. Quantification of hepatic steatosis with MRI: the effects of accurate fat spectral modeling. J Magn Reson Imaging. 2009;29(6):1332-1339.
8. Hernando D, Zhao R, Yuan Q, et al. Multicenter Reproducibility of Liver Iron Quantification with 1.5-T and 3.0-T MRI. Radiology. 2023;306(2):e213256.
Figures