4757
Assessing Pulmonary Function: A Comparative Study at 0.55T and 1.5T1Department of Radiology, Shanghai Ninth People’s Hospital, Shanghai JiaoTong University School of Medicine., Shang hai, China, 2MR scientific Marketing,Diagnostic Imaging, Siemens Healthineers Ltd, Shanghai, China, Shang hai, China, 3MR Research Collaboration Team, Siemens Healthineers Ltd. Shanghai, China., Shang hai, China, 4MR Application PredevelopmentResearch Collaboration CLS BODY, Siemens Healthineers AG, Erlangen, Germany, Erlangen, Germany, 5Institute for Diagnostic and Interventional Radiology, Hannover Medical School, OE 8220, Carl-Neuberg-Str.1, 30625 Hannover, Germany., Hannover, Germany
Synopsis
Keywords: Lung, Lung, PREFUL MRI
Motivation: The motivation for this study is to develop a non-invasive imaging technique for assessing pulmonary function without the need for ionizing radiation or potentially harmful contrast agents.
Goal(s): To evaluate the impact of different magnetic field strengths (0.55T and 1.5T) on functional parameters derived from the PREFUL MRI technique.
Approach: The study analyzed the data with MRLung software and conducting statistical comparisons to assess the differences in functional parameters, SNR, and CNR between the two field strengths.
Results: VDP, mean perfusion, and mean ventilation exhibited significant changes at the lower field strength, with higher SNR at 0.55T compared to 1.5T.
Impact: We demonstrate the potential of using a lower field strength (0.55T) MRI system for assessing pulmonary function, offering insights into the impact of field strength on functional parameters and quality, which may have implications for improving non-invasive pulmonary imaging methods.
Introduction
Early diagnosis and monitoring of treatment responses in pulmonary diseases, including Chronic Obstructive Pulmonary Disease (COPD), thromboembolic pulmonary hypertension (CTEPH), and cystic fibrosis (CF), are vital for patient management. Current pulmonary functional imaging methods often involve ionizing radiation (e.g., X-ray, CT) and the use of contrast agents, which may have associated risks1. A potential alternative is the recently introduced the phase-resolved functional lung (PREFUL) MRI technique2, which is a non-contrast, free-breathing, and dynamic imaging approach to assess lung function. This study aims to evaluate the functional parameters, SNR and CNR derived from PREFUL at 0.55T compared to 1.5T MRI.Methods and Materials
A group of 18 healthy volunteers participated in the study and underwent both 0.55T(MAGNETOM Free.Star, Siemens Healthineers) and 1.5T(MAGNETOM Aera, Siemens Healthineers) MRI scans within a two-week period. MRI data acquisition was performed using the same manufacturer and included routine structural imaging and quantitative assessment of ventilation and perfusion. The parameters were as below: PD fBLADE with trigger: TR:6753.11ms, TE:35ms, FOV:380*380, Voxel size:1.2*1.2*6mm; PREFUL (0.55T based on trueFISP) :TR:276.9ms, TE:1.6ms, FOV:450*450mm, Voxel size:1.75*1.75*15mm³, Time resolution:300ms, Scan time: 1min09s; PREFUL (1.5T based on 2D FLASH):TR:2.9ms, TE:1.35ms, FOV:500* 500mm, Voxel size:2*2*15mm³, Time Resolution:300ms, Scan time:1min01s. Image processing utilized the MRLung research software(Version 2.2.0, Siemens Healthineers, Erlangen,Germany) to analyze and generate functional parametric maps, including ventilation map((VR), perfusion map(Q), perfusion defect percentage maps (QDP maps), ventilation defect percentage maps (VDP maps) and ventilation/perfusion match maps (VQM maps). The software employed motion correction, lung segmentation, filtering, and phase-resolved analysis.Signal-to-noise ratio (SNR) and contrast-to-noise ratio (CNR) were calculated for lung parenchyma and pulmonary artery. Graphpad Prism 8.0 software (GraphPad Software Inc., San Diego, CA, USA) was used for statistical analysis. The differences of quantitative functional parameters including Q, VR, QDP, VDP and VQM were analyzed with non-parametric Wilcoxon signed-rank test Shapiro-Wilk test revealed no normal distribution, while SNR and CNR were analyzed with paired t test due to in accordance with normal distribution. Additionally, skewness and kurtosis of the Q and VR values were calculated with normalization by dividing each value by the 95th percentile of the values. Bland-Altman plots were created to evaluate the differences of all parameters between two series. Differences were considered statistically significant at P<0.05.Results
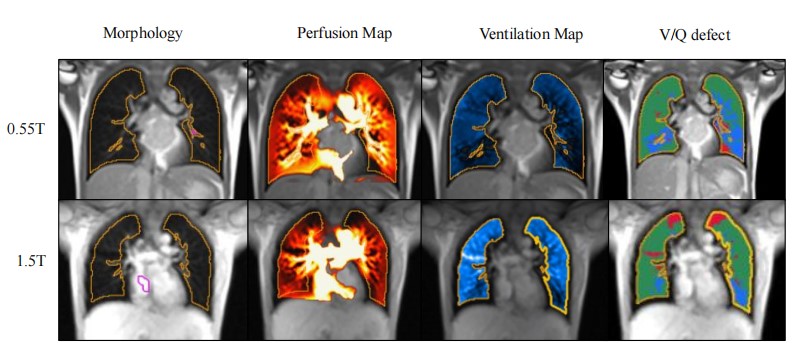
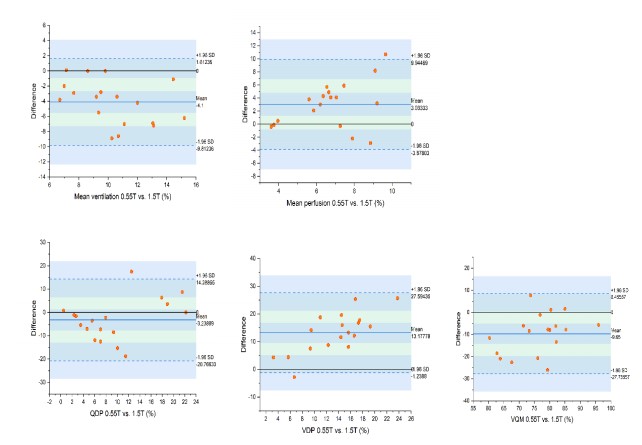
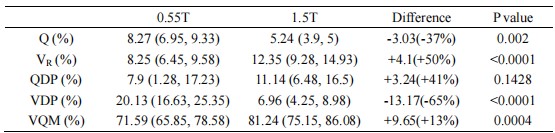
Functional parameters, including perfusion defect percentage (QDP), ventilation defect percentage (VDP), and ventilation/perfusion match (VQM), showed no significant differences between 0.55T and 1.5T MRI(Table 1). However, VDP, mean perfusion, and mean ventilation exhibited significant changes at 0.55T compared to 1.5T MRI. SNR was significantly higher at 0.55T for both expiration and inspiration states, while CNR showed no significant differences between the field strengths. (Table 2) Histogram analysis indicated reduced skewness and kurtosis at 0.55T compared to 1.5T, suggesting a change in the distribution of perfusion and ventilation values. The alterations in ventilation values were more pronounced than those in perfusion across different field strengths, explaining the significant changes in VDP and VQM(Fig.2). The mean differences of functional parameters between 0.55T and 1.5T were as follows: Q (3.03%, -3.88 to 9.94), VR (-4.1%, -9.81 to 1.61), QDP (-3.24%, -20.77 to 14.29), VDP (13.18%, -1.24 to 27.), and VQM (-9.65%, -27.76 to 8.46).Discussion
Alterations in perfusion and ventilation parameters are significant, with a 58% increase in mean perfusion and a 33% decrease in mean ventilation at 0.55T MRI compared to 1.5T. These findings are consistent with previous research on lower field strengths. The unique characteristics of 0.55T MRI, such as reduced susceptibility effects and slower spin-spin interactions, may contribute to the observed differences in functional parameters. The relationship between relaxation rates and field strength, as well as the distinct distributions of T1 and T2* values in lung tissue, could explain the altered perfusion and ventilation parameters. Also the utilized, fundamentally different pulse sequences may have a significant effect on the derived parameters. We also noted higher SNR at 0.55T, which may be attributed to lower field inhomogeneities and susceptibility effects.Conclusion
Perfusion and ventilation parameters, as well as SNR, are significantly different when comparing 0.55T and 1.5T MRI systems using the PREFUL method. These changes are likely influenced by the unique characteristics associated with lower field strength and the fact that a different pulse sequence type was used at 0.55T. The study highlights the importance of further optimizing the acquisition protocols and establishing a normative range of parameter values at 0.55T to warrant comparability of PREFUL parameters with higher field strengths.Acknowledgements
NoneReferences
1. Pöhler GH, Klimes F, Voskrebenzev A, Behrendt L, Czerner C, Gutberlet M et al. Chronic Thromboembolic Pulmonary Hypertension Perioperative Monitoring Using Phase-Resolved Functional Lung (PREFUL)-MRI. Journal of magnetic resonance imaging : JMRI 2020; 52(2): 610-619.
2. Voskrebenzev A, Gutberlet M, Klimeš F, Kaireit TF, Schönfeld C, Rotärmel A et al. Feasibility of quantitative regional ventilation and perfusion mapping with phase-resolved functional lung (PREFUL) MRI in healthy volunteers and COPD, CTEPH, and CF patients. Magnetic resonance in medicine 2018; 79(4): 2306-2314.
Figures