4756
Regional quantification of 129Xe Gaussian broadening in the lungs with time-domain Voigt fitting of 3D CSI1POLARIS, Division of Clinical Medicine, University of Sheffield, Sheffield, United Kingdom, 2Insigneo Institute, University of Sheffield, Sheffield, United Kingdom
Synopsis
Keywords: Lung, Hyperpolarized MR (Gas)
Motivation: Frequency-domain dissolved 129Xe CSI suffers from low spectral resolution, which can result in inaccuracies in the fitted spectral parameters. Time-domain Voigt fitting of CSI can improve accuracy and enable regional quantification of Gaussian broadening of 129Xe lung spectra.
Goal(s): To quantify regional Gaussian broadening of 129Xe resonances in the lung airspaces and adjacent lung parenchyma.
Approach: Time-domain Voigt fitting was performed on 129Xe 3D CSI data from the lungs of healthy volunteers.
Results: Gaussian broadening contributed to 75-80% and 45% of the total linewidth for the gas and membrane 129Xe resonances, respectively, over all healthy volunteers. Corresponding Voigt T2 values were also quantified.
Impact: We have demonstrated regional quantification of 129Xe Gaussian broadening in the lungs. Knowledge of this should enhance accuracy of spectral parameters computed for lung disease metrics while offering potential utility as a metric itself.
Introduction
Recent CSI techniques have quantified regional spectral parameters of 129Xe within red blood cells, parenchyma/blood plasma (membrane,M) and airspaces (gas) of the lungs.1 However, frequency-domain CSI has limited spectral resolution for 10-15s breath-hold scans, primarily due to the necessarily short acquisition windows restricting the number of sample points, which can result in inaccuracies in the fitted parameters. This method also assumes Lorentzian lineshapes for the resonances, while prior research indicates a substantial contribution of Gaussian broadening to the M linewidth.2,3 To enhance accuracy and enable regional quantification of Gaussian broadening, here we employ time-domain Voigt fitting of 3D CSI data from the lungs of healthy volunteers.Methods
Imaging was performed on 3 healthy volunteers (HV) on a 1.5T GE 450w scanner with 129Xe polarised to ~30% (POLARIS, Sheffield, UK).4 Images were acquired during breath-hold after the inhalation of 1L of HP 129Xe from functional residual capacity. Sequence details: 3D CSI with voxel size(2.9cm)3,matrix=14×14×7,FOV=40×40×20cm3,FA=10°/0.1° for dissolved-phase/gas resonances,TR/TE=8ms/0.9ms,1799 excitations.1 In the spectral dimension, 88 sample points were acquired with BW=20kHz. Images were reconstructed to 64x64x20 while the original spectral resolution was preserved. Following application of a mask, data analysis was performed by fitting the real and imaginary parts of the time-domain signal(Fig.1(a)) to a 3-resonance Voigt function defined by$$Re[V(t))]=\sum_{n=1}^{3}A_{n}\text{exp}(-\pi\Gamma_n^Lt)\text{exp}\left[-\left( \frac{\pi\Gamma_n^Gt}{2\sqrt{\text{ln}2}} \right)^2 \right]\text{cos}\left[ \left( \omega_{0,n}-\omega_t \right)t+\phi_n \right]$$$$Im[V(t))]=\sum_{n=1}^{3}A_{n}\text{exp}(-\pi\Gamma_n^Lt)\text{exp}\left[-\left( \frac{\pi\Gamma_n^Gt}{2\sqrt{\text{ln}2}} \right)^2 \right]\text{sin}\left[ \left( \omega_{0,n}-\omega_t \right)t+\phi_n \right]$$,
where A is the FID the amplitude, ΓL and ΓG are Lorentzian and Gaussian linewidths (set to zero for the RBC resonance), ω0-ωt=Δω is frequency difference between the 129Xe resonance frequencies and RF transmit/receive frequency and φ is the phase of the nth (n=Gas,M,RBC) 129Xe resonant peak. Voigt T2 values for the gas and membrane signals were calculated using an empirically-derived expression $$T_2^V=\alpha T_2^L[1-\text{exp}(-T_2^G/\alpha T_2^L)]+\beta T_2^L$$
where T2L=1/πΓL and T2G=2√ln2/πΓG are the Lorentzian and Gaussian T 2s, respectively, and α=0.965 and β=0.00012 are empirical constants. The error in this function was computed by calculating the absolute error between synthetic spectra with known T 2V and T2V calculated with this function over a range of T2G and T 2L values parameterised by d=(T2G-T2L)/(T2G+T2L), i.e. d=1(Gaussian dominated) for T2G>>T2L and d=-1(Lorentzian dominated) for T2G<<T2L(Fig.1(b)).
Results
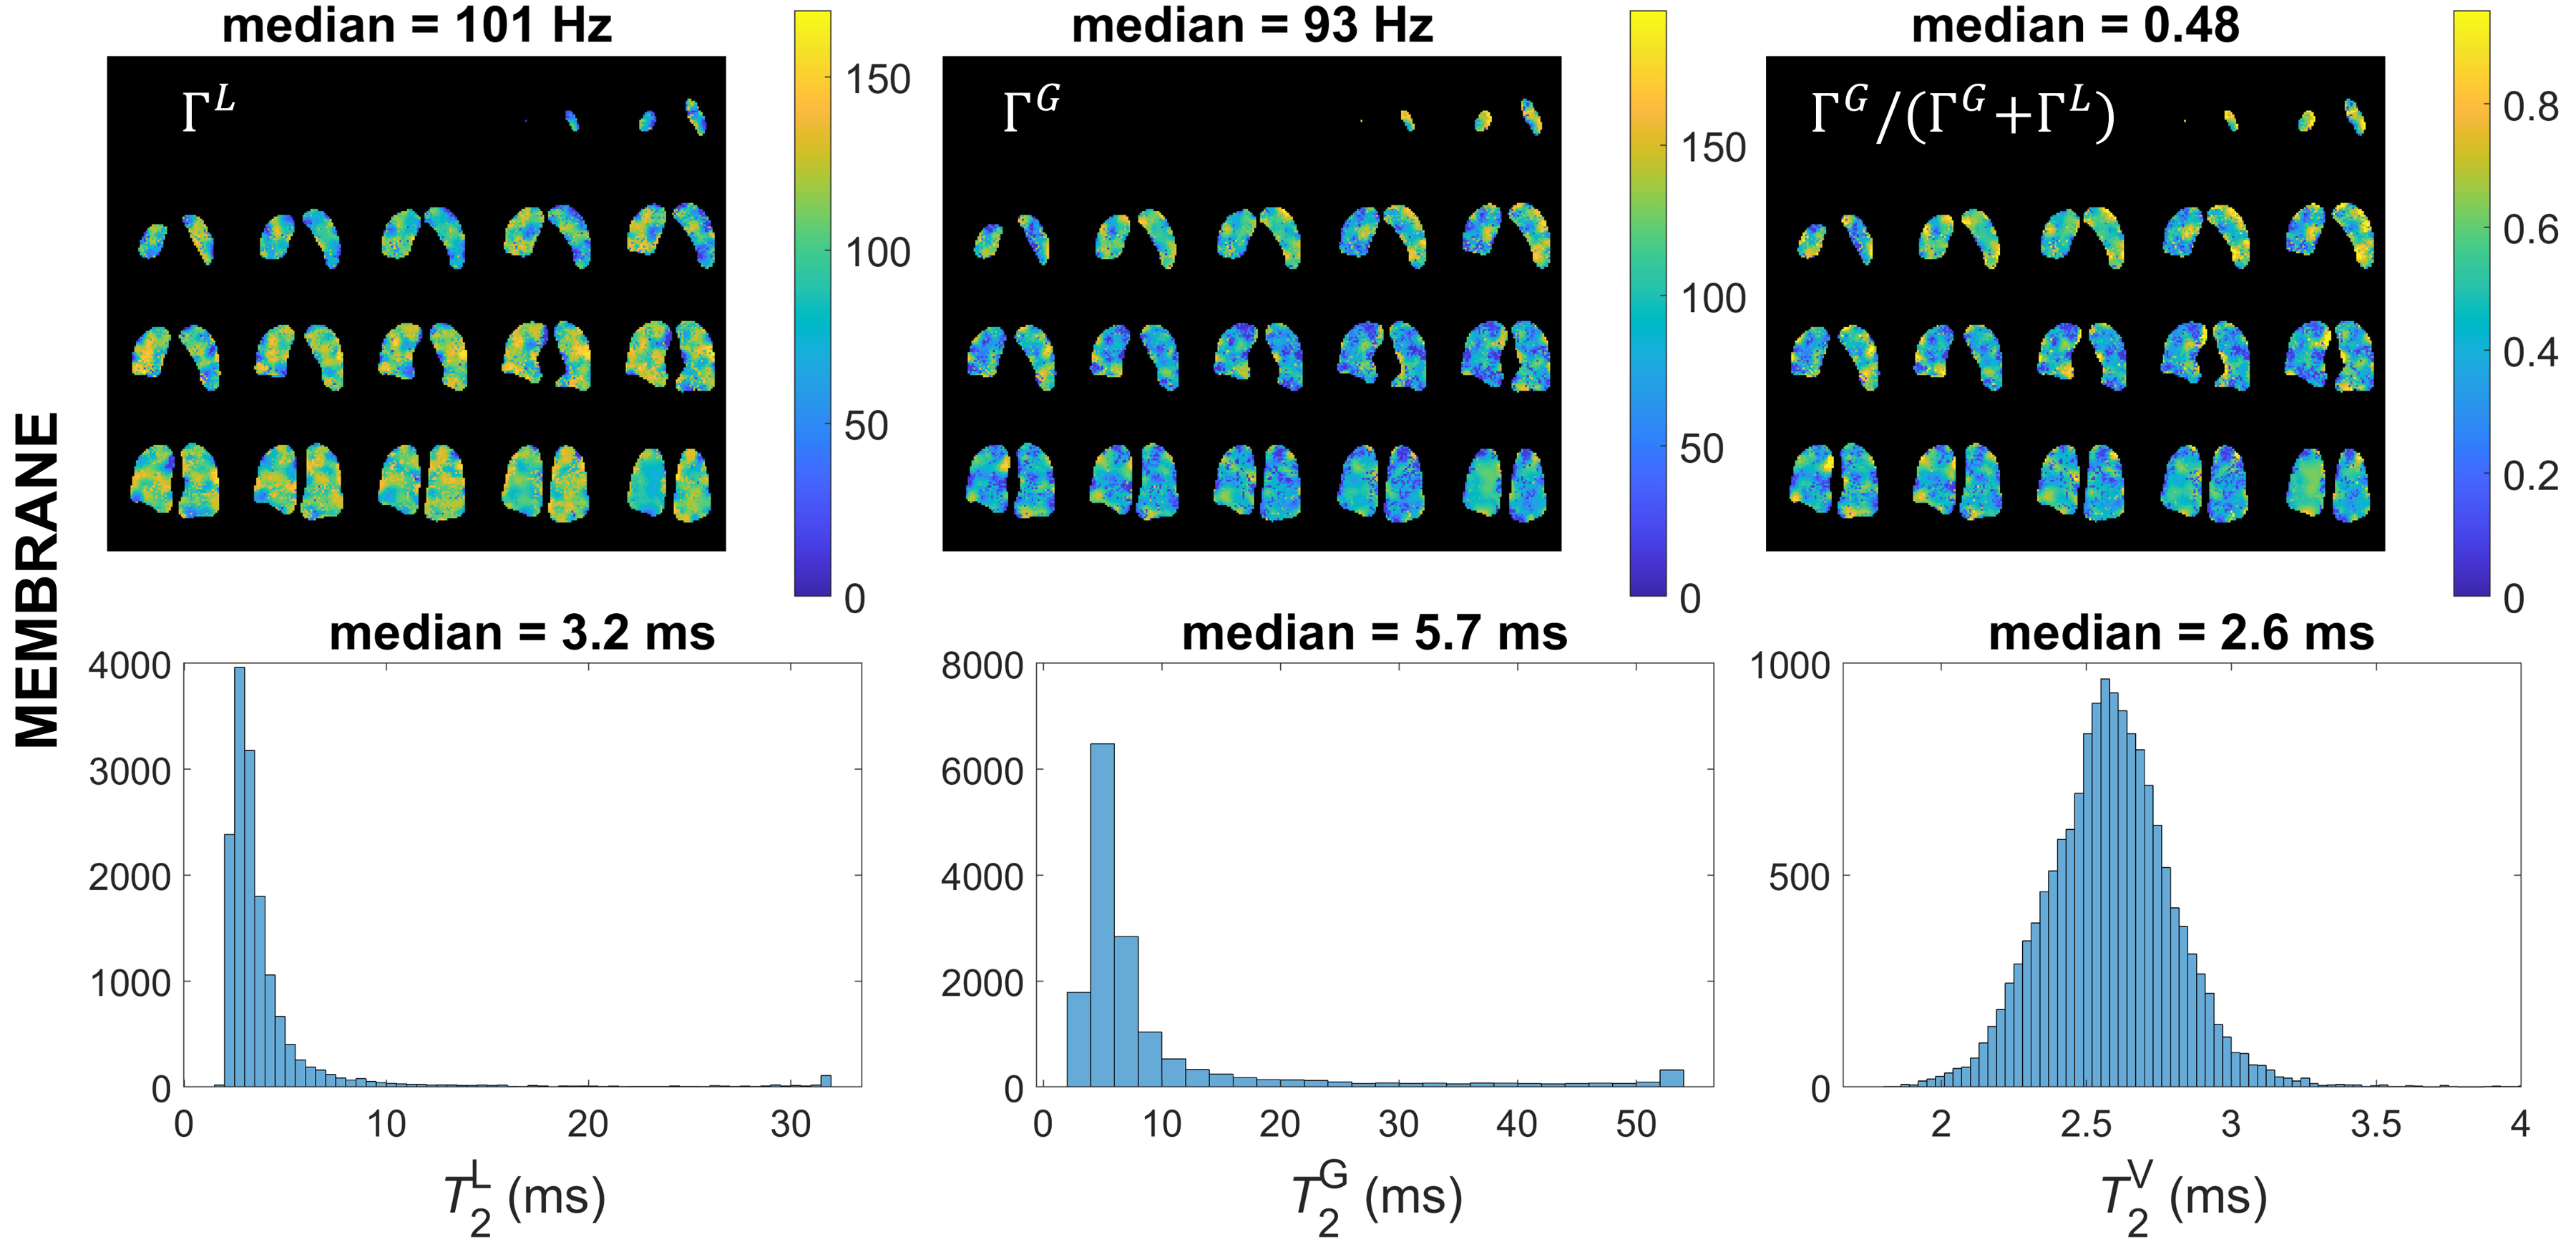
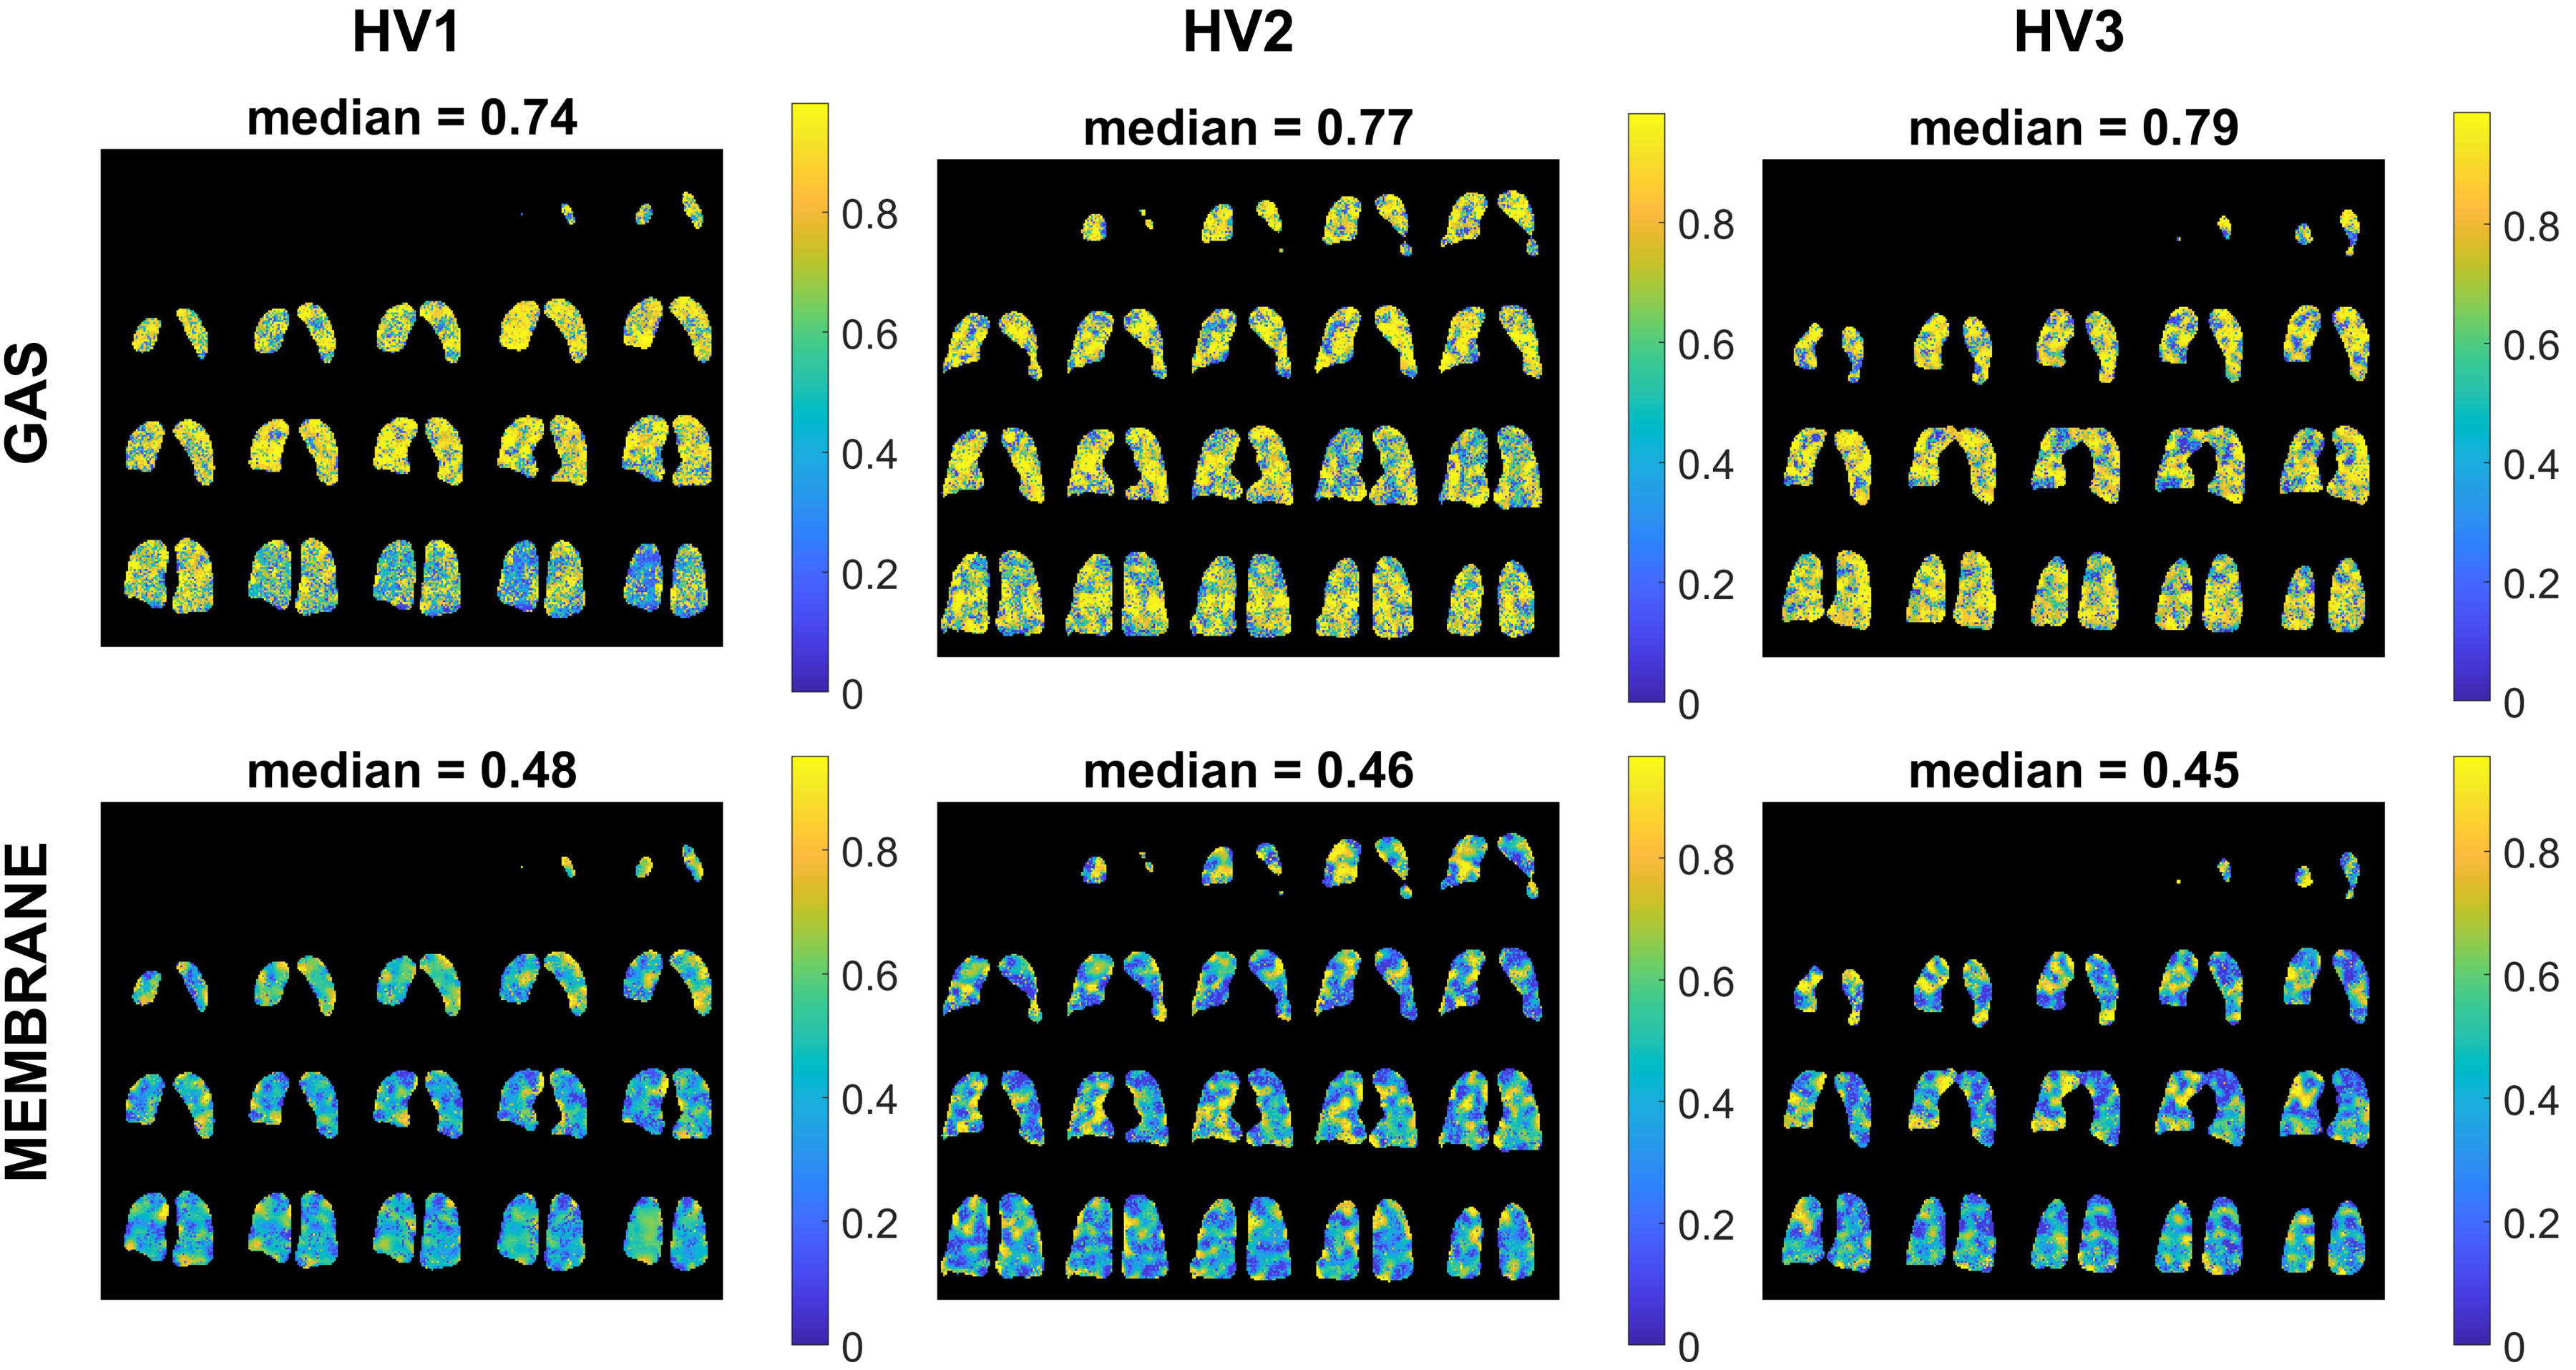
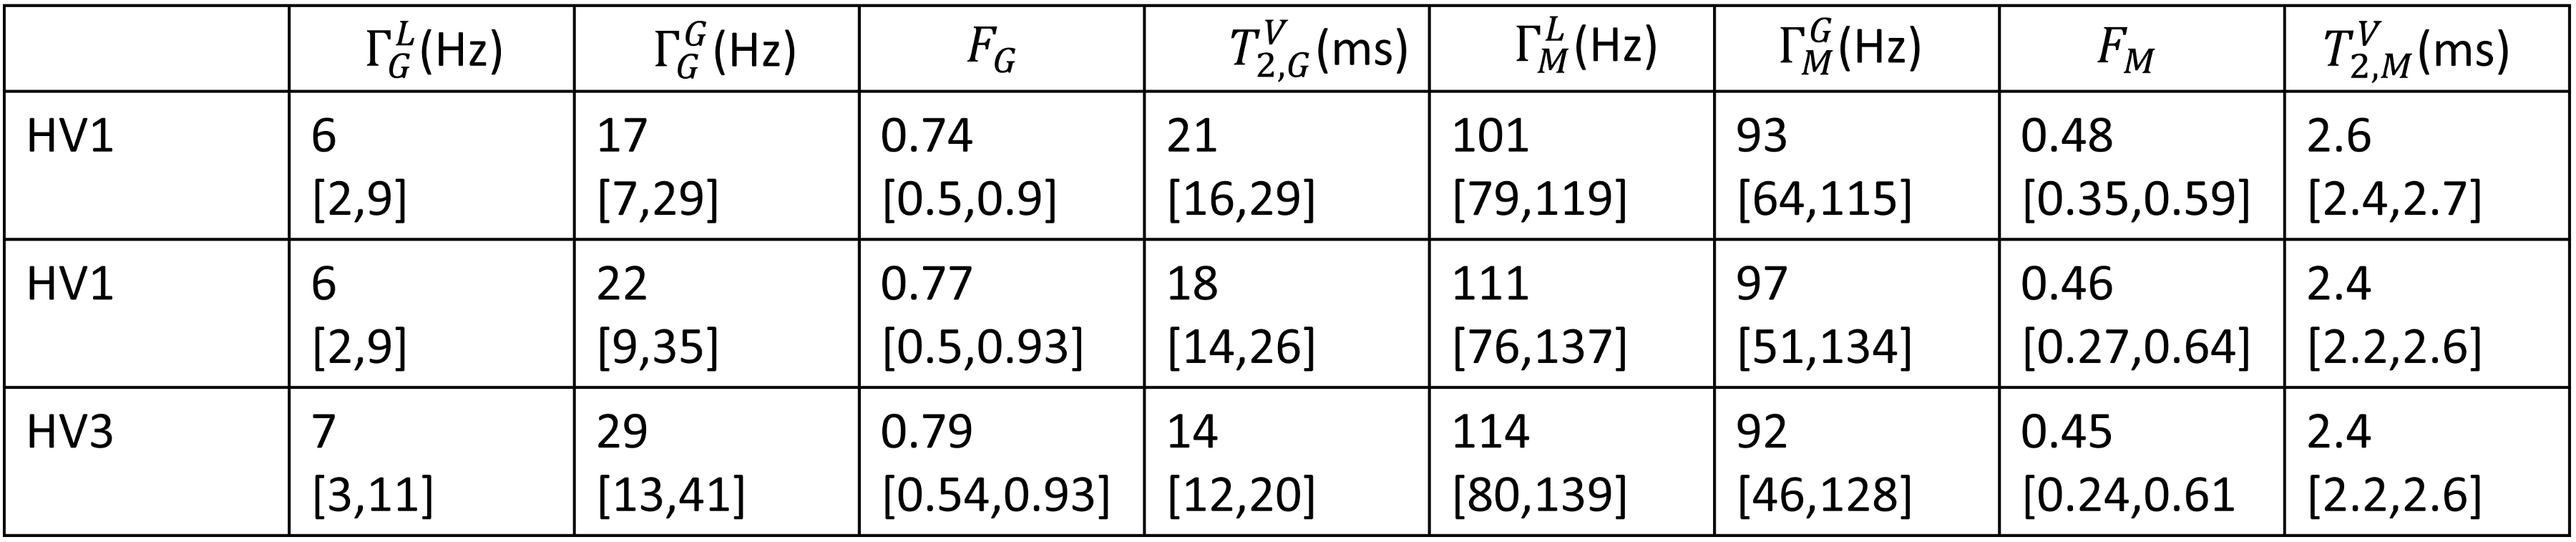
With the exception of ΓL and ΓG, all fitted parameters converged to values within the bounds of the fitting function. When ΓL and ΓG are respectively ~zero, it indicated purely Gaussian and Lorentzian broadening(Fig.1,bottom). The function for computing T2V from measured T2G and T2L was shown to have an error of <2% for d values -0.75-1(Fig.1(b)). The 129Xe-gas resonance was shown to be Gaussian-dominated on average over the lung volume with median Gaussian fractions of 0.74[0.5,0.9],0.77[0.5,0.93] and 0.79[0.54,0.93] for the 3 HVs. The M resonance was shown to have approximately equivalent contributions from Lorentzian and Gasussian broading, with median Gaussian fractions of 0.48[0.35,0.59],0.46[0.27,0.64] and 0.45[0.24,0.61]. The M Voigt T2s were similar over all HVs, with median values of 2.6ms[2.4,2.7],2.4ms[2.2,2.6] and 2.4ms[2.2,2.6], whereas there was more variation observed in the gas Voigt T2s, with values of 21ms[16,29], 18ms[14,26] and 14ms[12,20](Fig.5). While there are clear regional areas of elevated/reduced Gaussian broadening for both gas and M resonances across, there was not a clear consistent pattern in any particular area of the lungs across the HVs(Fig.4).Discussion
Gaussian broadening was found to contribute ~75-80% and ~45% to the total linewdith for gas and M resonances, respectively, in the lungs of HVs. While similar Gaussian broadening values have been observed from whole-lung spectroscopy for the M resonance,2,3 this study quantifies Gaussian broadening of the gas resonance for the first time, revealing that, on average, Gaussian broadening dominates over Lorentzian broadening for 129Xe gas in the lungs, most likely due to sampling inhomogenous B0 over the voxel. Incorporating Gaussian components for both gas and M resonances should improve spectral parameter quantification accuracy, and consequently enhance accuracy of disease metrics derived from these parameters. Although no consistent pattern of Gaussian broadening was observed over the lungs in HVs, reduced Gaussian broadening may be present in areas of alveolar damage in e.g. emphysematous lungs due to increased free diffusion of 129Xe gas in these regions. In contrast, elevated Gaussian broadening in the M resonance may be present in fibrotic lungs due to increased B0 inhomogeneity from regions with elevated tissue heterogenity. As such, fractional Gaussian broadening may provide an additional metric for assessing the severity of lung diseases.Conclusion
We demonstrate regional quantification of 129Xe Gaussian broadening in the lungs. Knowledge of this is expected to increase accuracy of computed spectral parameters for evaluating lung disease metrics and may also serve as a valuable metric in its own right.Acknowledgements
This work was supported by MRC grant MR/M008894/1, the National Institute for Health and Care Research (NIHR) Sheffield Biomedical Research Centre (NIHR203321) and AMS Springboard award R/162501-1. The views expressed are those of the author(s) and not necessarily those of the NIHR or the Department of Health and Social Care.References
1. Collier GJ, Schulte RF, Rao M, Norquay G, Ball J, Wild JM. Imaging gas-exchange lung function and brain tissue uptake of hyperpolarized 129Xe using sampling density-weighted MRSI. Magnetic Resonance in Medicine 2023;89(6):2217-2226.
2. Bier EA, Robertson SH, Schrank GM, Rackley C, Mammarappallil JG, Rajagopal S, McAdams HP, Driehuys B. A protocol for quantifying cardiogenic oscillations in dynamic 129Xe gas exchange spectroscopy: The effects of idiopathic pulmonary fibrosis. NMR in biomedicine 2019;32(1):e4029-e4029.
3. Norquay G, Collier GJ, Wild JM. Temporal correlation of alveolar-capillary 129Xe signal dynamics with the cardiac cycle. Proc ISMRM 2021;p3563.
4. Norquay G, Collier GJ, Rao M, Stewart NJ, Wild JM. 129Xe-Rb Spin-Exchange Optical Pumping with High Photon Efficiency. Physical Review Letters 2018;121(15):153201.
Figures
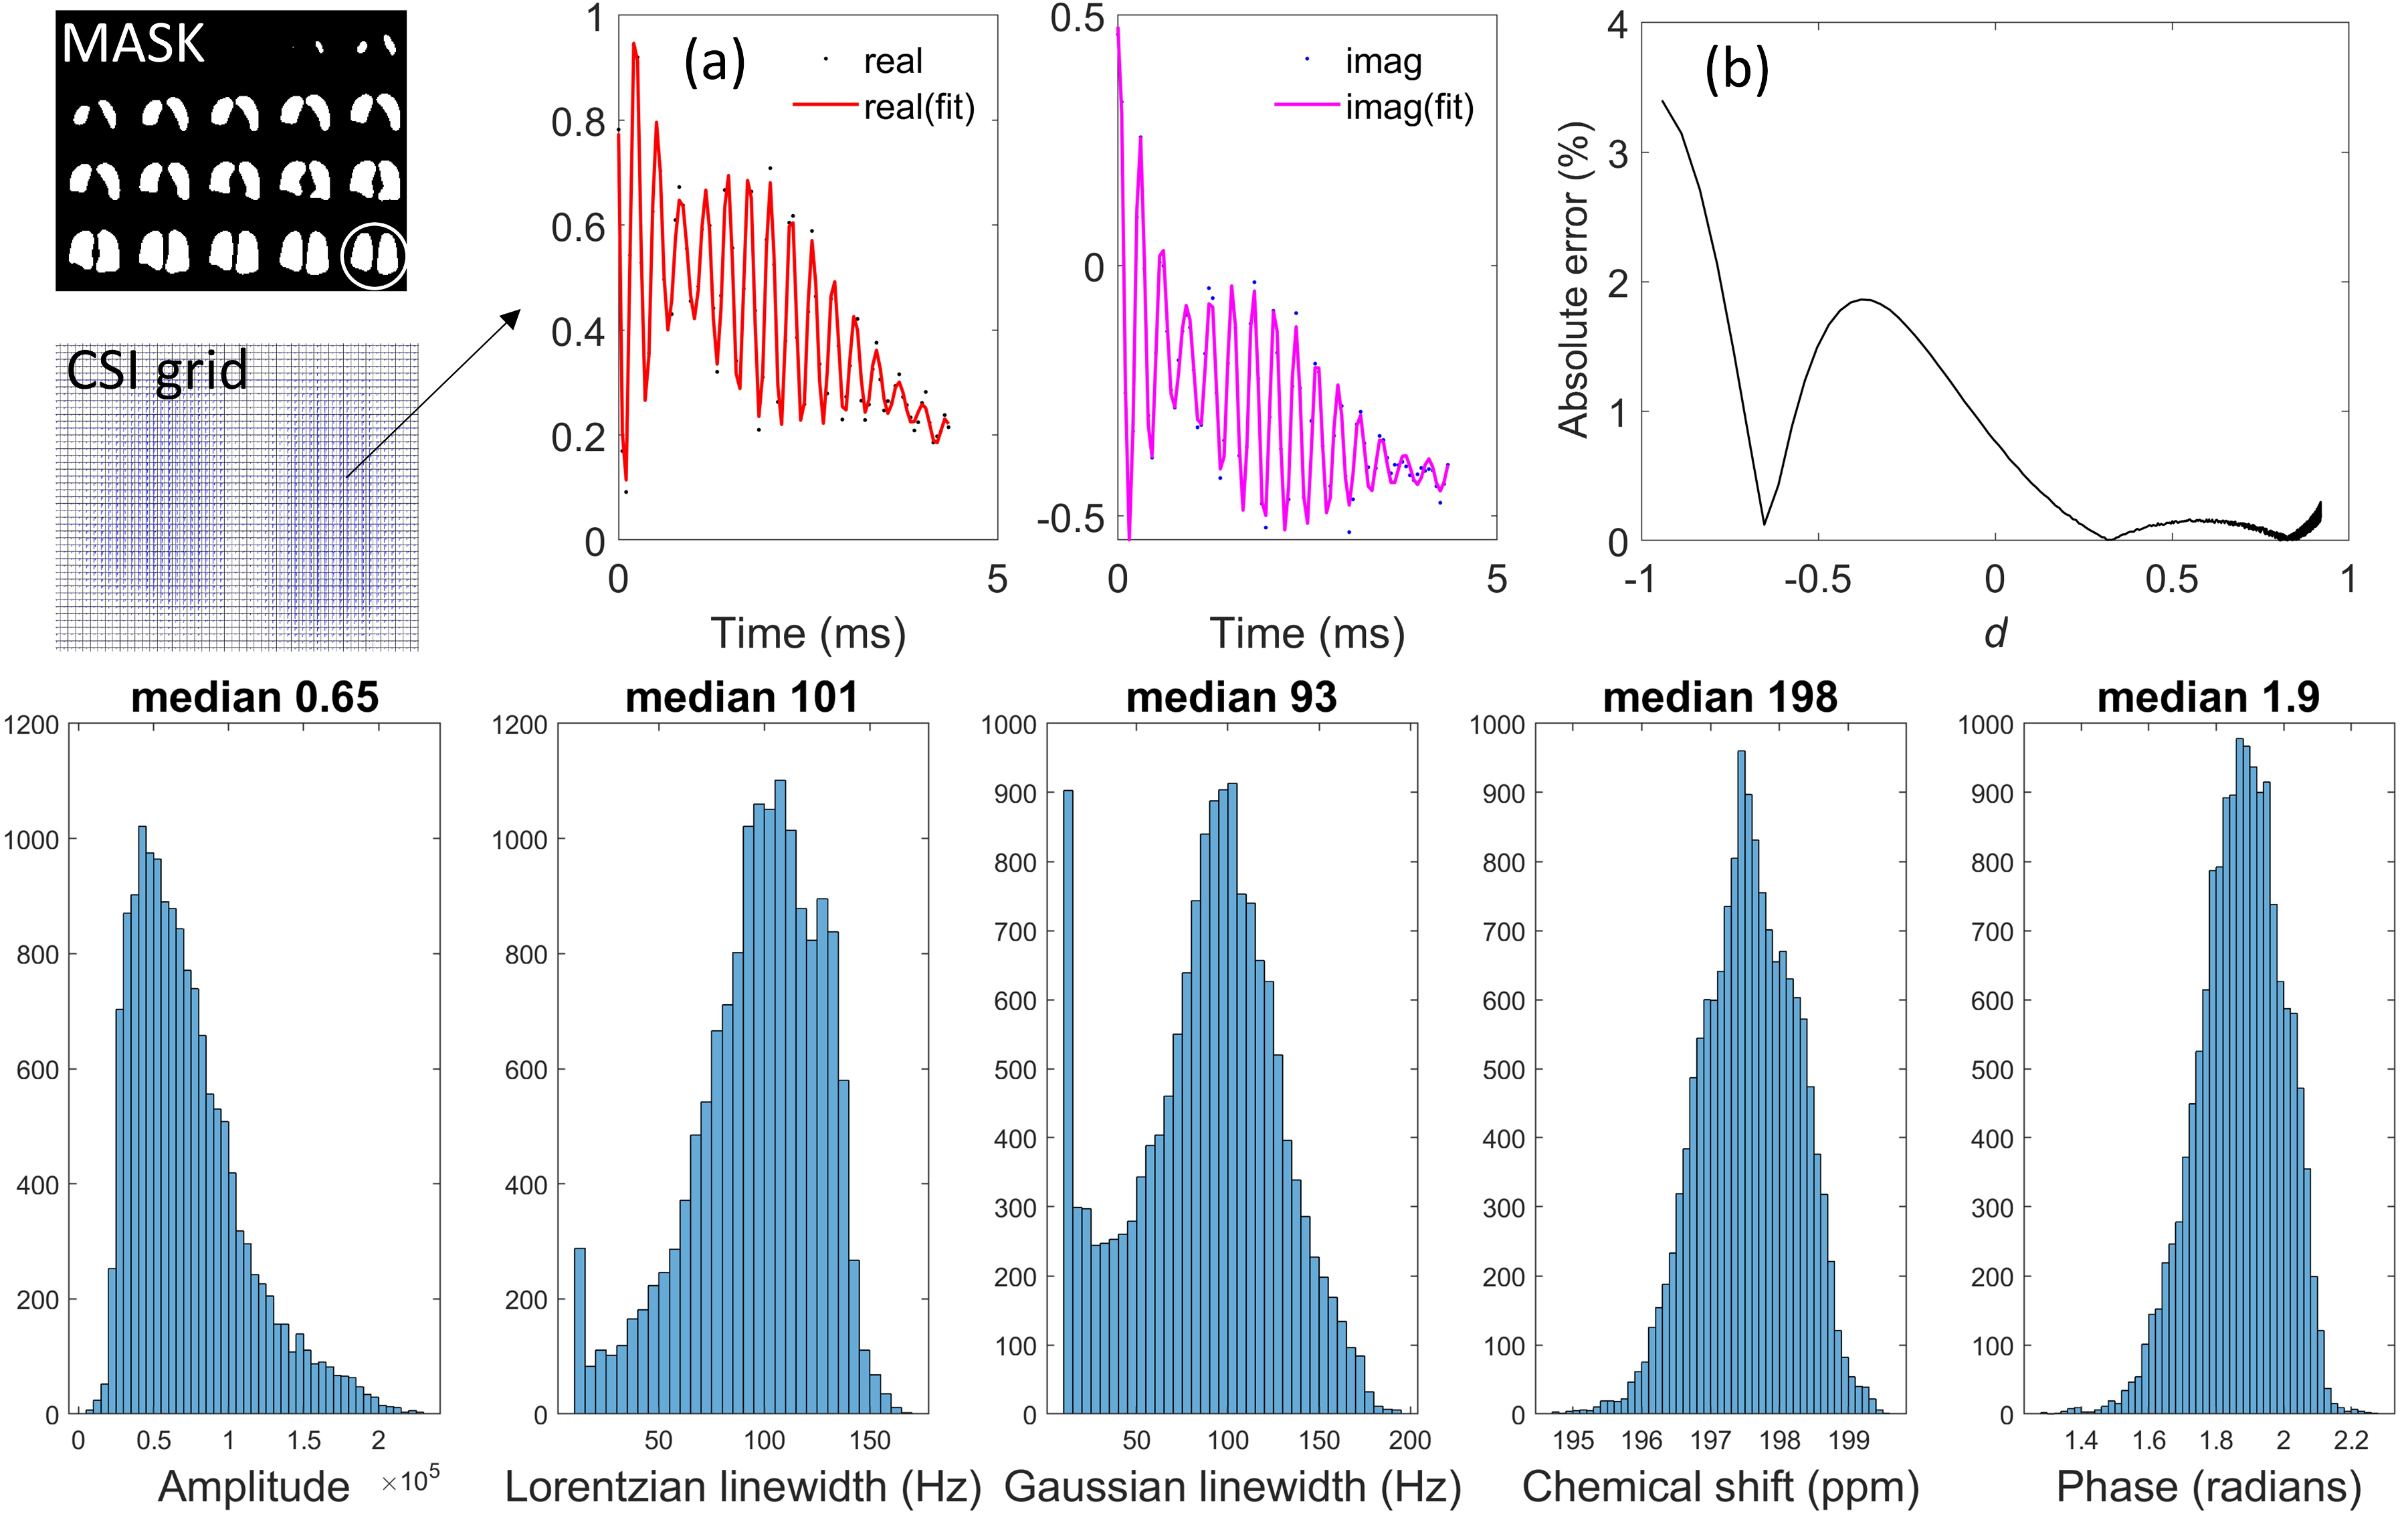
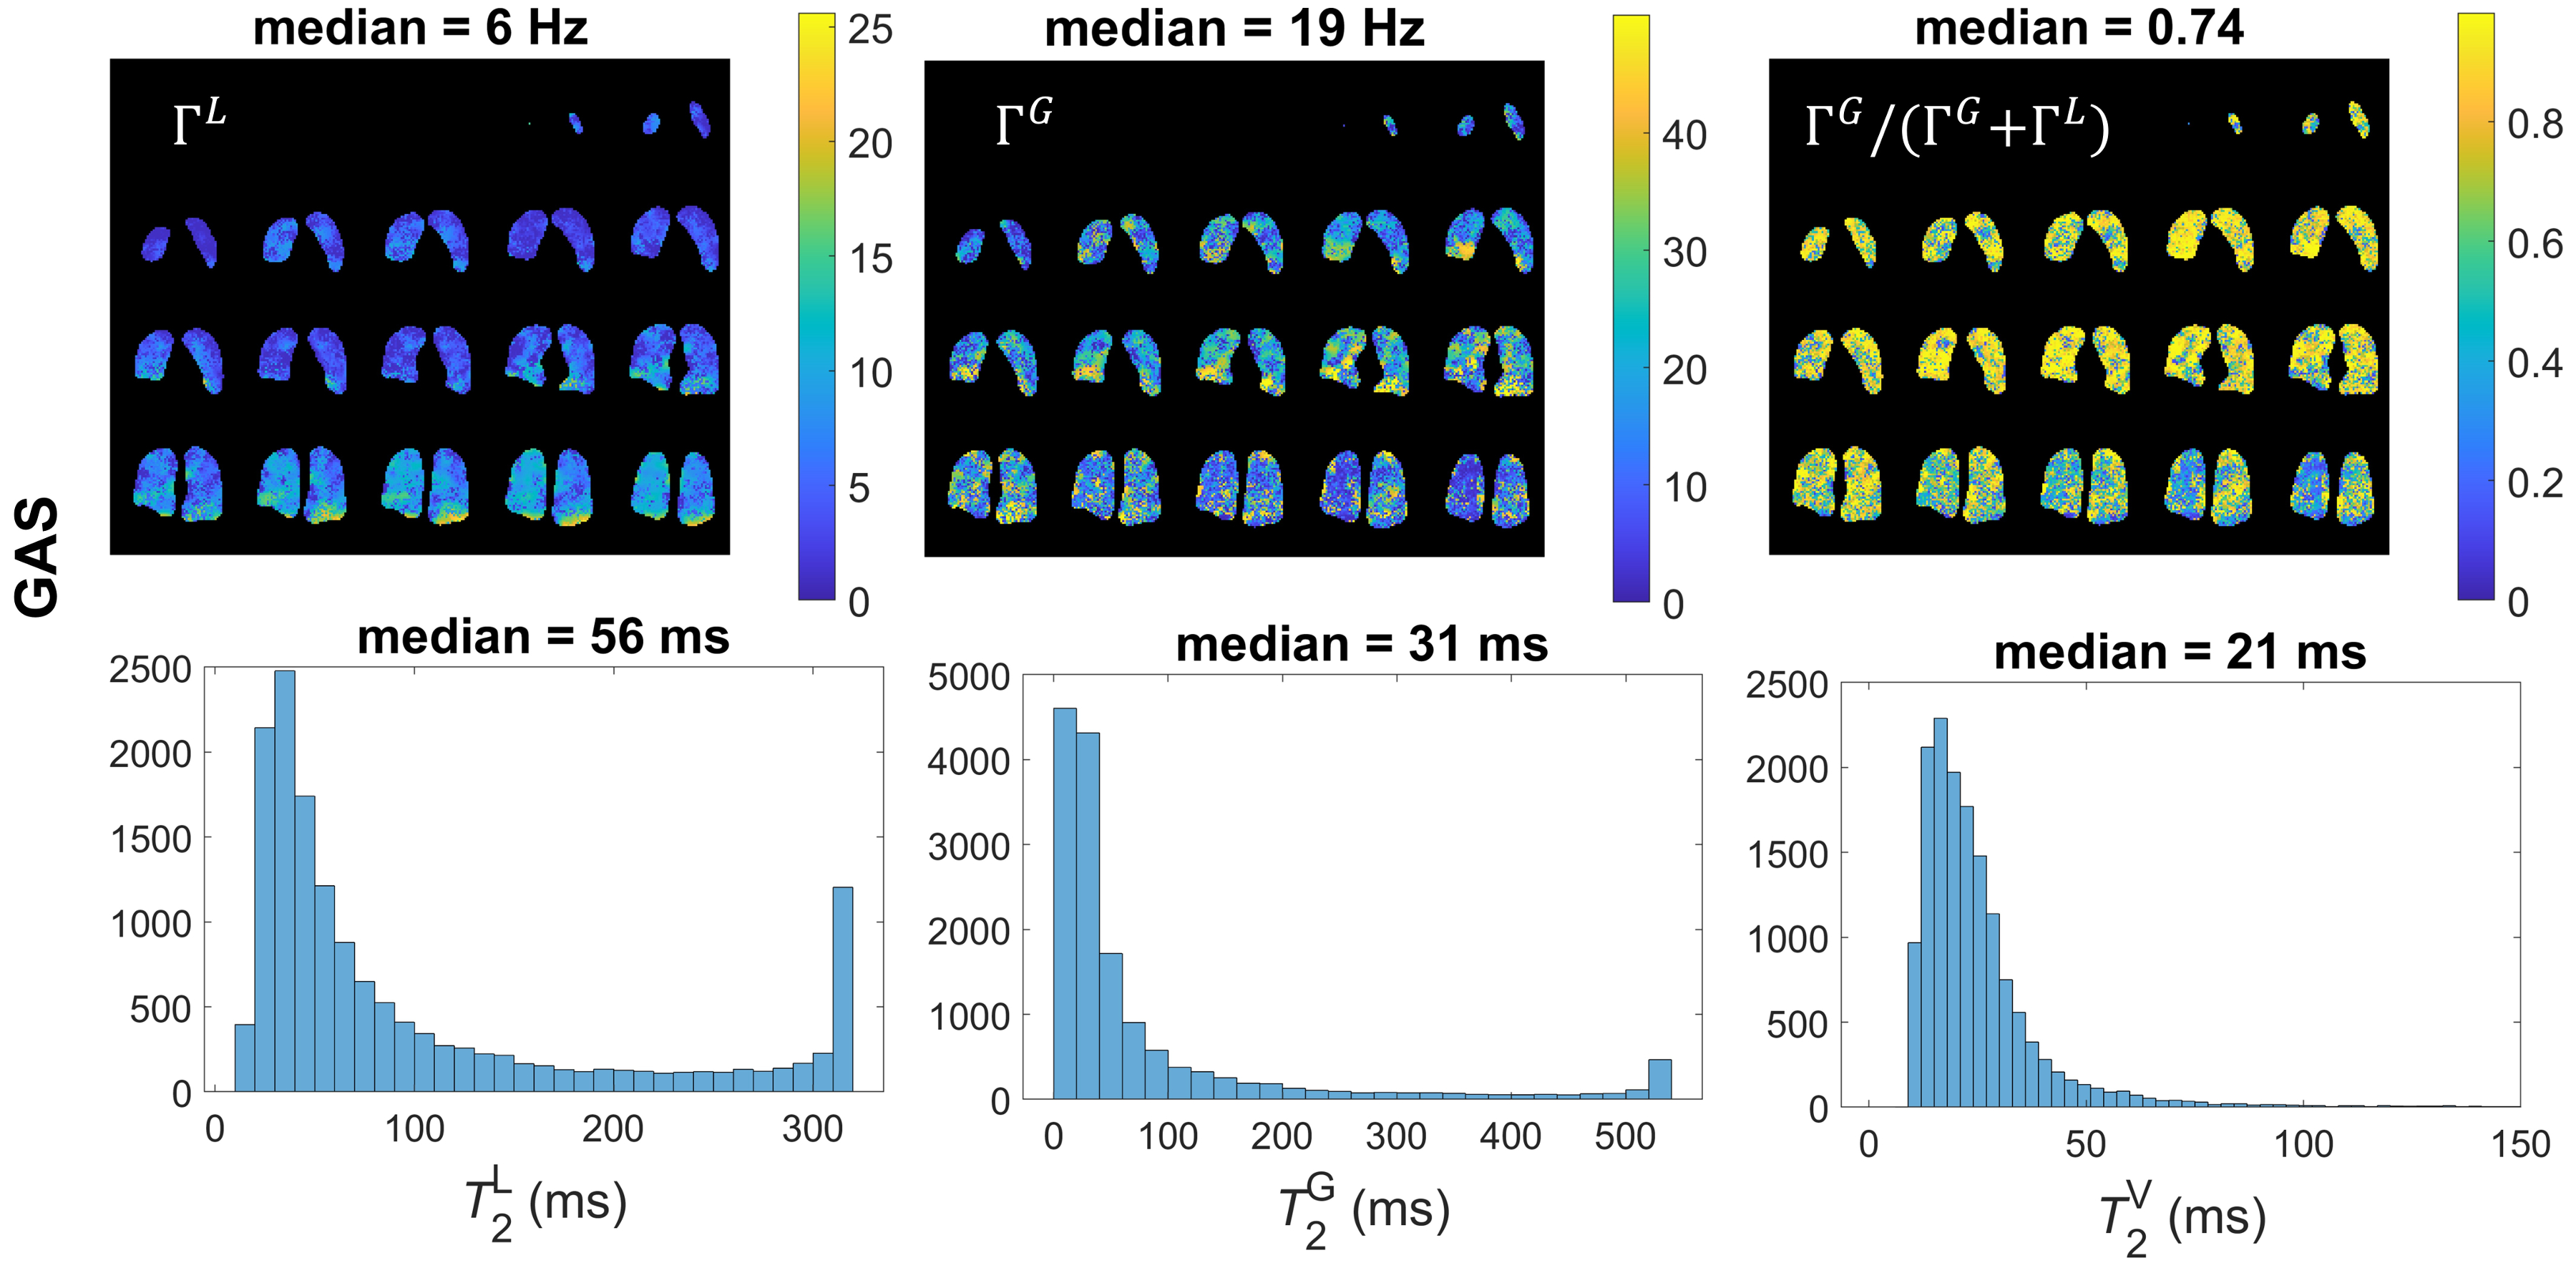
Figure 2: (top) Regional parameter maps of Lorentzian (ΓL) and Gaussian (ΓG) linewidths and Gaussian linewidth fraction [F=ΓG/(ΓG+ΓL)] from 129Xe gas signal in the lungs of a healthy volunteer. (bottom) Distributions of Lorentzian and Gaussian T2 relaxation times and corresponding Voigt T2 times.