4750
A study on brown adipose tissue using histogram features from fat fraction maps in modify Dixon technique1Gansu University of Chinese Medicine, Lan Zhou, China, 2Department of Radiology, Gansu Provincial Hospital, Lan Zhou, China, 3Philips Healthcare, Xi'an, China
Synopsis
Keywords: Endocrine, Fat, brown adipose tissue
Motivation: The recent discovery of brown adipose tissue (BAT) in adults presents new approaches for treating metabolic disorders.
Goal(s): Noninvasive methods for distinguishing between BAT and white adipose tissue (WAT) are still under the exploration.
Approach: In this study, histogram features of human BAT and WAT were extracted using fat fraction (FF) maps that generated from the modified Dixon (mDIXON) technique. The features were subsequently analyzed and differentiated between the two types of adipose tissue.
Results: The results indicated that 16 out of 18 extracted features were statistically significant. Furthermore, in the reproducibility study, four features exhibited strong reproducibility.
Impact: This study demonstrated the feasibility of differentiating BAT and WAT by using noninvasive MRI approach. The mDIXON technique allows for BAT's quantification, providing a convenient way for researching BAT's correlation with certain metabolic disorders.
Introduction
BAT has the capacity to burn excess body fat to produce calories, making it a promising new avenue for the treatment of metabolic diseases like obesity and diabetes. Therefore, the quantitative assessment of BAT is crucial in clinical practice[1, 2]. The current gold standard is [18F]-2-fluoro-d-2-deoxy-d-glucose (18F-FDG) PET/CT. However, PET/CT is not widely accessible due to its high cost and ionizing radiation[3]. mDIXON technology utilizes the different magnetization properties of adipose tissue to separate it into two components: water and fat, resulting in two key images that display water and fat tissue respectively[4]. Compared to WAT, BAT contains more mitochondria and blood vessels, leading to distinct differences in the distribution of water and fat components, which can be visualized in mDIXON images[5]. In this study, we used histogram features extracted from the mDIXON technique's FF maps to differentiate between BAT and WAT.Materials and Methods
This study prospectively collected healthy volunteers from March 2023 to June 2023. A total of 42 participants underwent final scanning. All data were acquired using a 3.0T scanner (Elition, Philips Healthcare, the Netherlands) with a 32-channel head coil. The imaging protocol included mDIXON sequences. The parameters of the mDIXON were as follows: TR=5.6ms, TE=0.97ms, slice thickness=3mm, spatial resolution=2.5×2.5mm2, scan time=16 seconds. To test the reproducibility and repeatability of the mDIXON sequence, test-retest scans were performed. BAT was defined as subclavian region, while subcutaneous fat was defined as WAT. Two thoracic radiologists, each with more than 5 years of experience in interpreting MRI images draw the regions-of-interest (ROI)on the fat fraction (FF) maps using 3D Slicer software, and histogram features were extracted using Philips IntelliSpace Discovery platform. Statistical analysis was performed using SPSS software (version 25) and MedCalc (version 20). Normally distributed data was analyzed using t-tests, while non-normally distributed data was analyzed using rank-sum tests to differentiate the histogram features of brown and WAT. Intra-class correlation coefficient (ICC) was calculated to determine the inter-observer repeatability of measurements between two radiologists and the reproducibility. A significance level of P < 0.05 was considered as statistically significant. Repeatability was assessed by using Bland-Altman analysis.Results
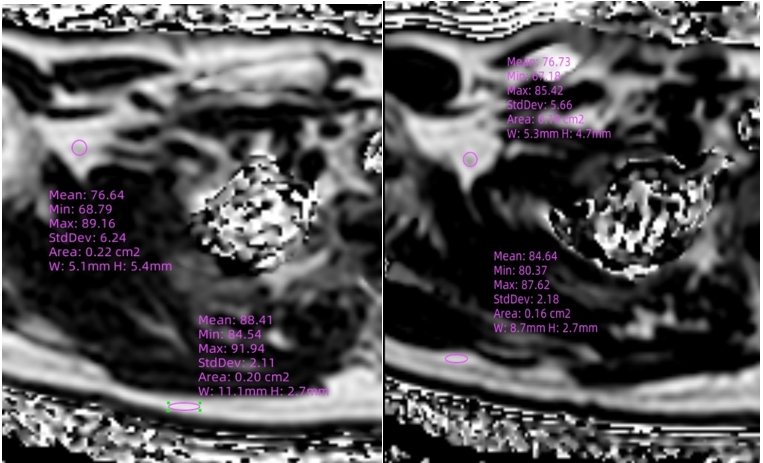
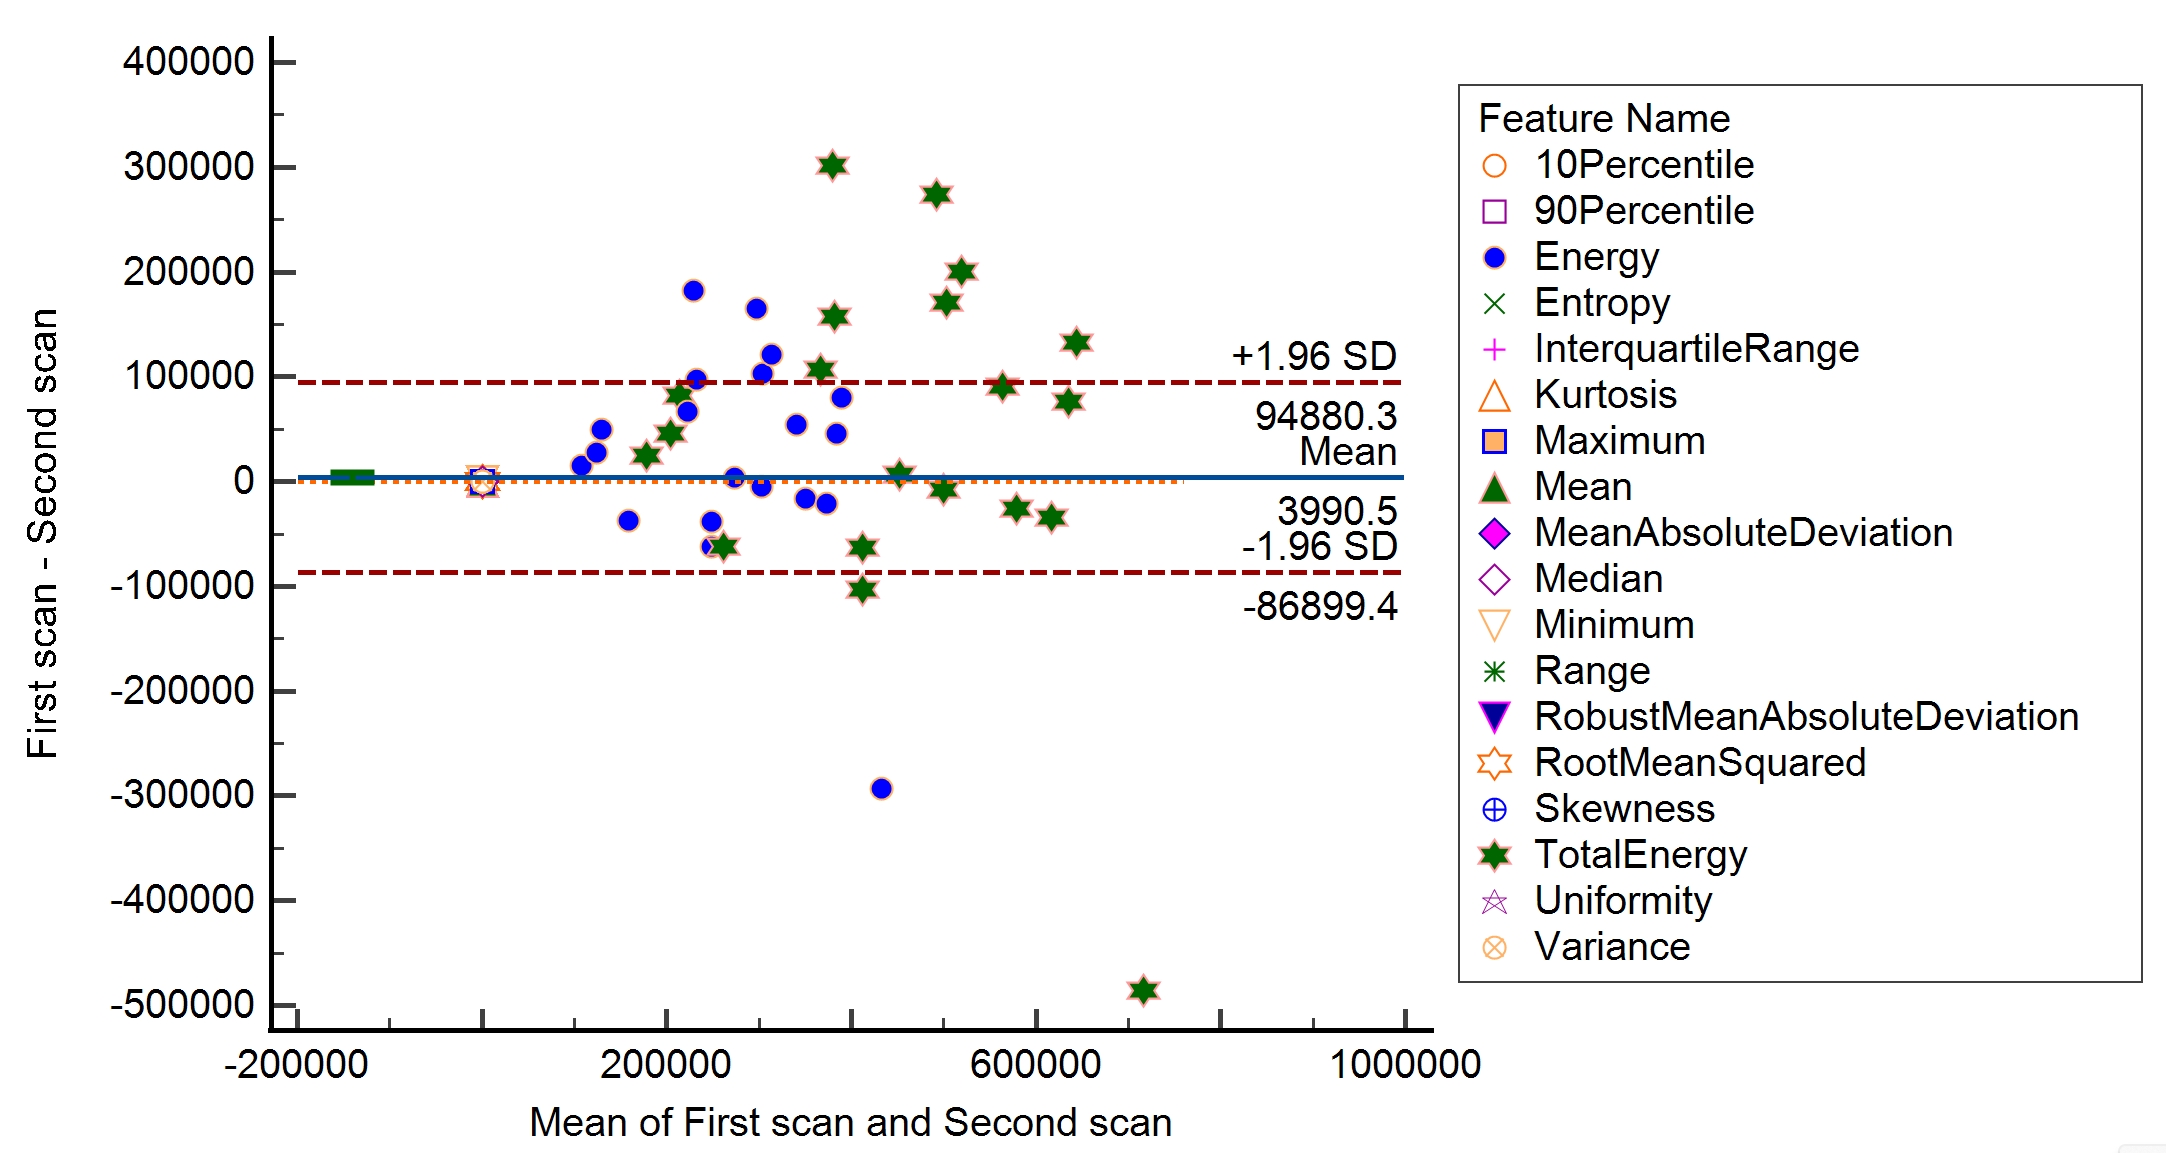
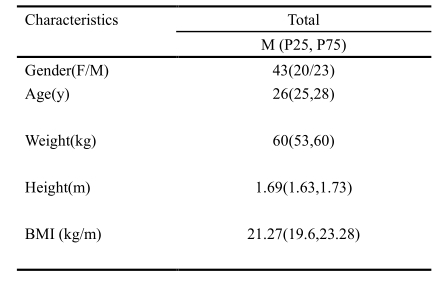
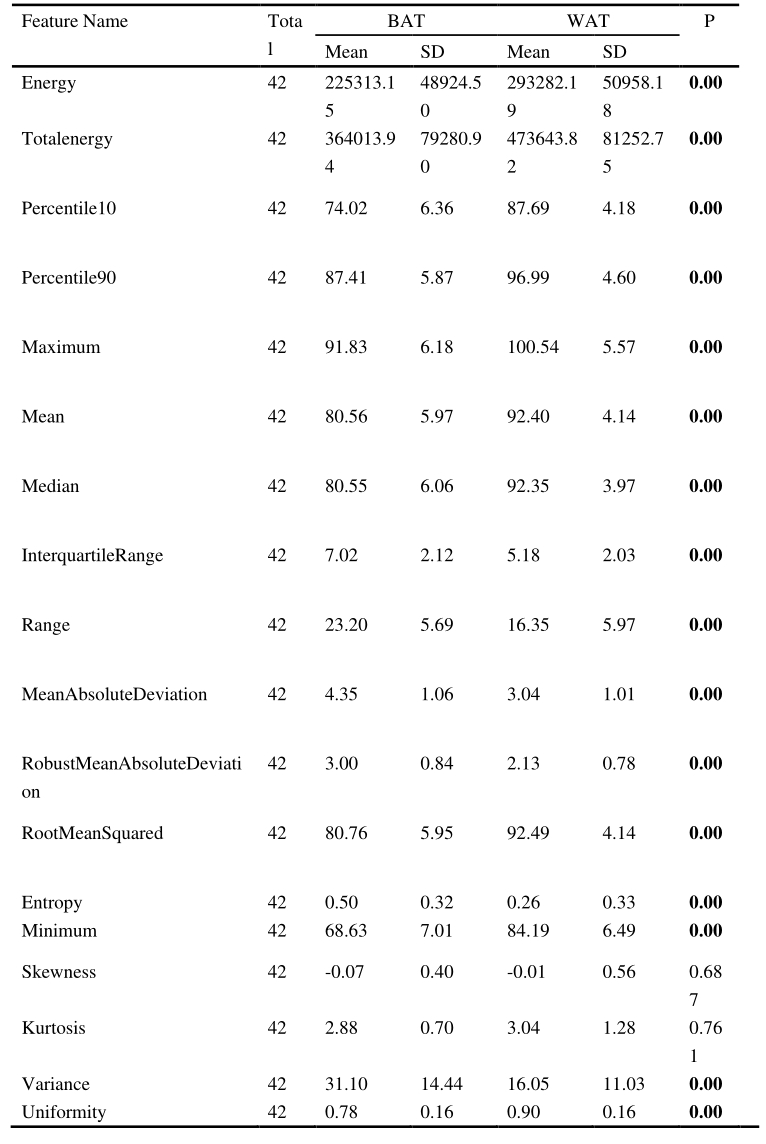
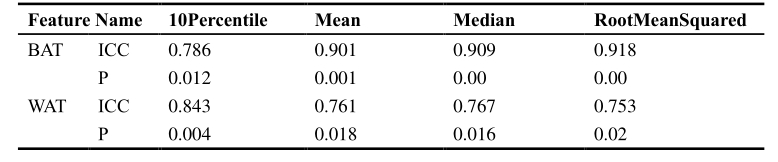
The clinical data of the volunteers was presented in Table 1. Figure 1 illustrated two typical example images along with their corresponding measurements, showing lower FF values for BAT compared to WAT. Table 2 presented a comparison of the histogram characteristics between BAT and WAT, indicating statistical significance for all features except Skewness and Kurtosis. In Table 3, the repeatability results for the features Percentile10, Mean, Median, and RootMeanSquared were shown, with an ICC ranging from 0.753 to 0.918, indicating high scan reproducibility. As shown in the Bland-Altman plots in figure 2, the results of the Bland-Altman analysis showed a p-value of 0.10, which is greater than 0.05. This suggests that there was no significant deviation from zero in the difference between the two measurements. Therefore, we can conclude that the two measurements were consistent with each other.Discussion
In the current study, we observed a statistically significant difference in the histogram features of the FF maps for BAT and WAT. While previous studies have focused on the variations in FF values between these two types of fat tissues, the evaluation of histogram features, which provide a more comprehensive understanding of their disparities, has been overlooked[6-9]. These significant and evident differences in the histogram features provide valuable insights into the distinctive characteristics of BAT and WAT in terms of tissue structure and function. Moreover, the higher ICC values indicate a strong agreement between the measurements of the study subjects under the same scanning conditions. This minimizes the impact of random error and enhances our confidence in analyzing and interpreting the data. Additionally, higher ICC values contribute to the accuracy of the study findings and reduce the potential for errors. The results of the Bland-Altman analysis revealed a strong level of agreement between the two measurements, indicating their reliability and accuracy. This outcome instills confidence in the researcher to utilize this specific measure for assessing BAT[10]. It is important to acknowledge that the limitation of this study stems from the small number of volunteers. In order to enhance the robustness and reliability of our results, more participants will be recruited in the future work.Conclusion
We have illustrated the ability to differentiate and quantitatively characterize BAT and WAT using mDIXON technology. This result offers novel insights and methodologies for addressing metabolic disorders, such as diabetic obesity.Acknowledgements
No acknowledgement found.References
1. Scheele C, Wolfrum C. Brown Adipose Crosstalk in Tissue Plasticity and Human Metabolism. Endocrine reviews. 2020;41(1):53-65. doi: 10.1210/endrev/bnz007. 2. Franssens BT, Hoogduin H, Leiner T, van der Graaf Y, Visseren FLJ. Relation between brown adipose tissue and measures of obesity and metabolic dysfunction in patients with cardiovascular disease. Journal of magnetic resonance imaging : JMRI. 2017;46(2):497-504. doi: 10.1002/jmri.25594. 3. van Marken Lichtenbelt WD, Vanhommerig JW, Smulders NM, Drossaerts JM, Kemerink GJ, Bouvy ND, et al. Cold-activated brown adipose tissue in healthy men. The New England journal of medicine. 2009;360(15):1500-8. doi: 10.1056/NEJMoa0808718. 4. Hui SCN, Ko JKL, Zhang T, Shi L, Yeung DKW, Wang D, et al. Quantification of brown and white adipose tissue based on Gaussian mixture model using water-fat and T2* MRI in adolescents. Journal of magnetic resonance imaging : JMRI. 2017;46(3):758-68. doi: 10.1002/jmri.25632. 5. Montanari T, Pošćić N, Colitti M. Factors involved in white-to-brown adipose tissue conversion and in thermogenesis: a review. Obesity reviews : an official journal of the International Association for the Study of Obesity. 2017;18(5):495-513. doi: 10.1111/obr.12520. 6. Smith DL, Jr., Yang Y, Hu HH, Zhai G, Nagy TR. Measurement of interscapular brown adipose tissue of mice in differentially housed temperatures by chemical-shift-encoded water-fat MRI. Journal of magnetic resonance imaging : JMRI. 2013;38(6):1425-33. doi: 10.1002/jmri.24138. 7. Rasmussen JM, Entringer S, Nguyen A, van Erp TG, Burns J, Guijarro A, et al. Brown adipose tissue quantification in human neonates using water-fat separated MRI. PloS one. 2013;8(10):e77907. doi: 10.1371/journal.pone.0077907. 8. Lundström E, Ljungberg J, Andersson J, Manell H, Strand R, Forslund A, et al. Brown adipose tissue estimated with the magnetic resonance imaging fat fraction is associated with glucose metabolism in adolescents. Pediatric obesity. 2019;14(9):e12531. doi: 10.1111/ijpo.12531. 9. Andersson J, Roswall J, Kjellberg E, Ahlström H, Dahlgren J, Kullberg J. MRI estimates of brown adipose tissue in children - Associations to adiposity, osteocalcin, and thigh muscle volume. Magnetic resonance imaging. 2019;58:135-42. doi: 10.1016/j.mri.2019.02.001. 10. Giavarina D. Understanding Bland Altman analysis. Biochemia medica. 2015;25(2):141-51. doi: 10.11613/bm.2015.015.Figures