4749
Performance of non-invasive biomarkers in identifying patients with at-risk metabolic dysfunction-associated steatohepatitis1Radiology, Mayo Clinic, Rochester, MN, United States, 2Gastroenterology and Hepatology, Mayo Clinic, Rochester, MN, United States, 3Anatomic Pathology, Mayo Clinic, Rochester, MN, United States, 4UC San Diego Medical Center, San Diego, CA, United States
Synopsis
Keywords: Liver, Elastography
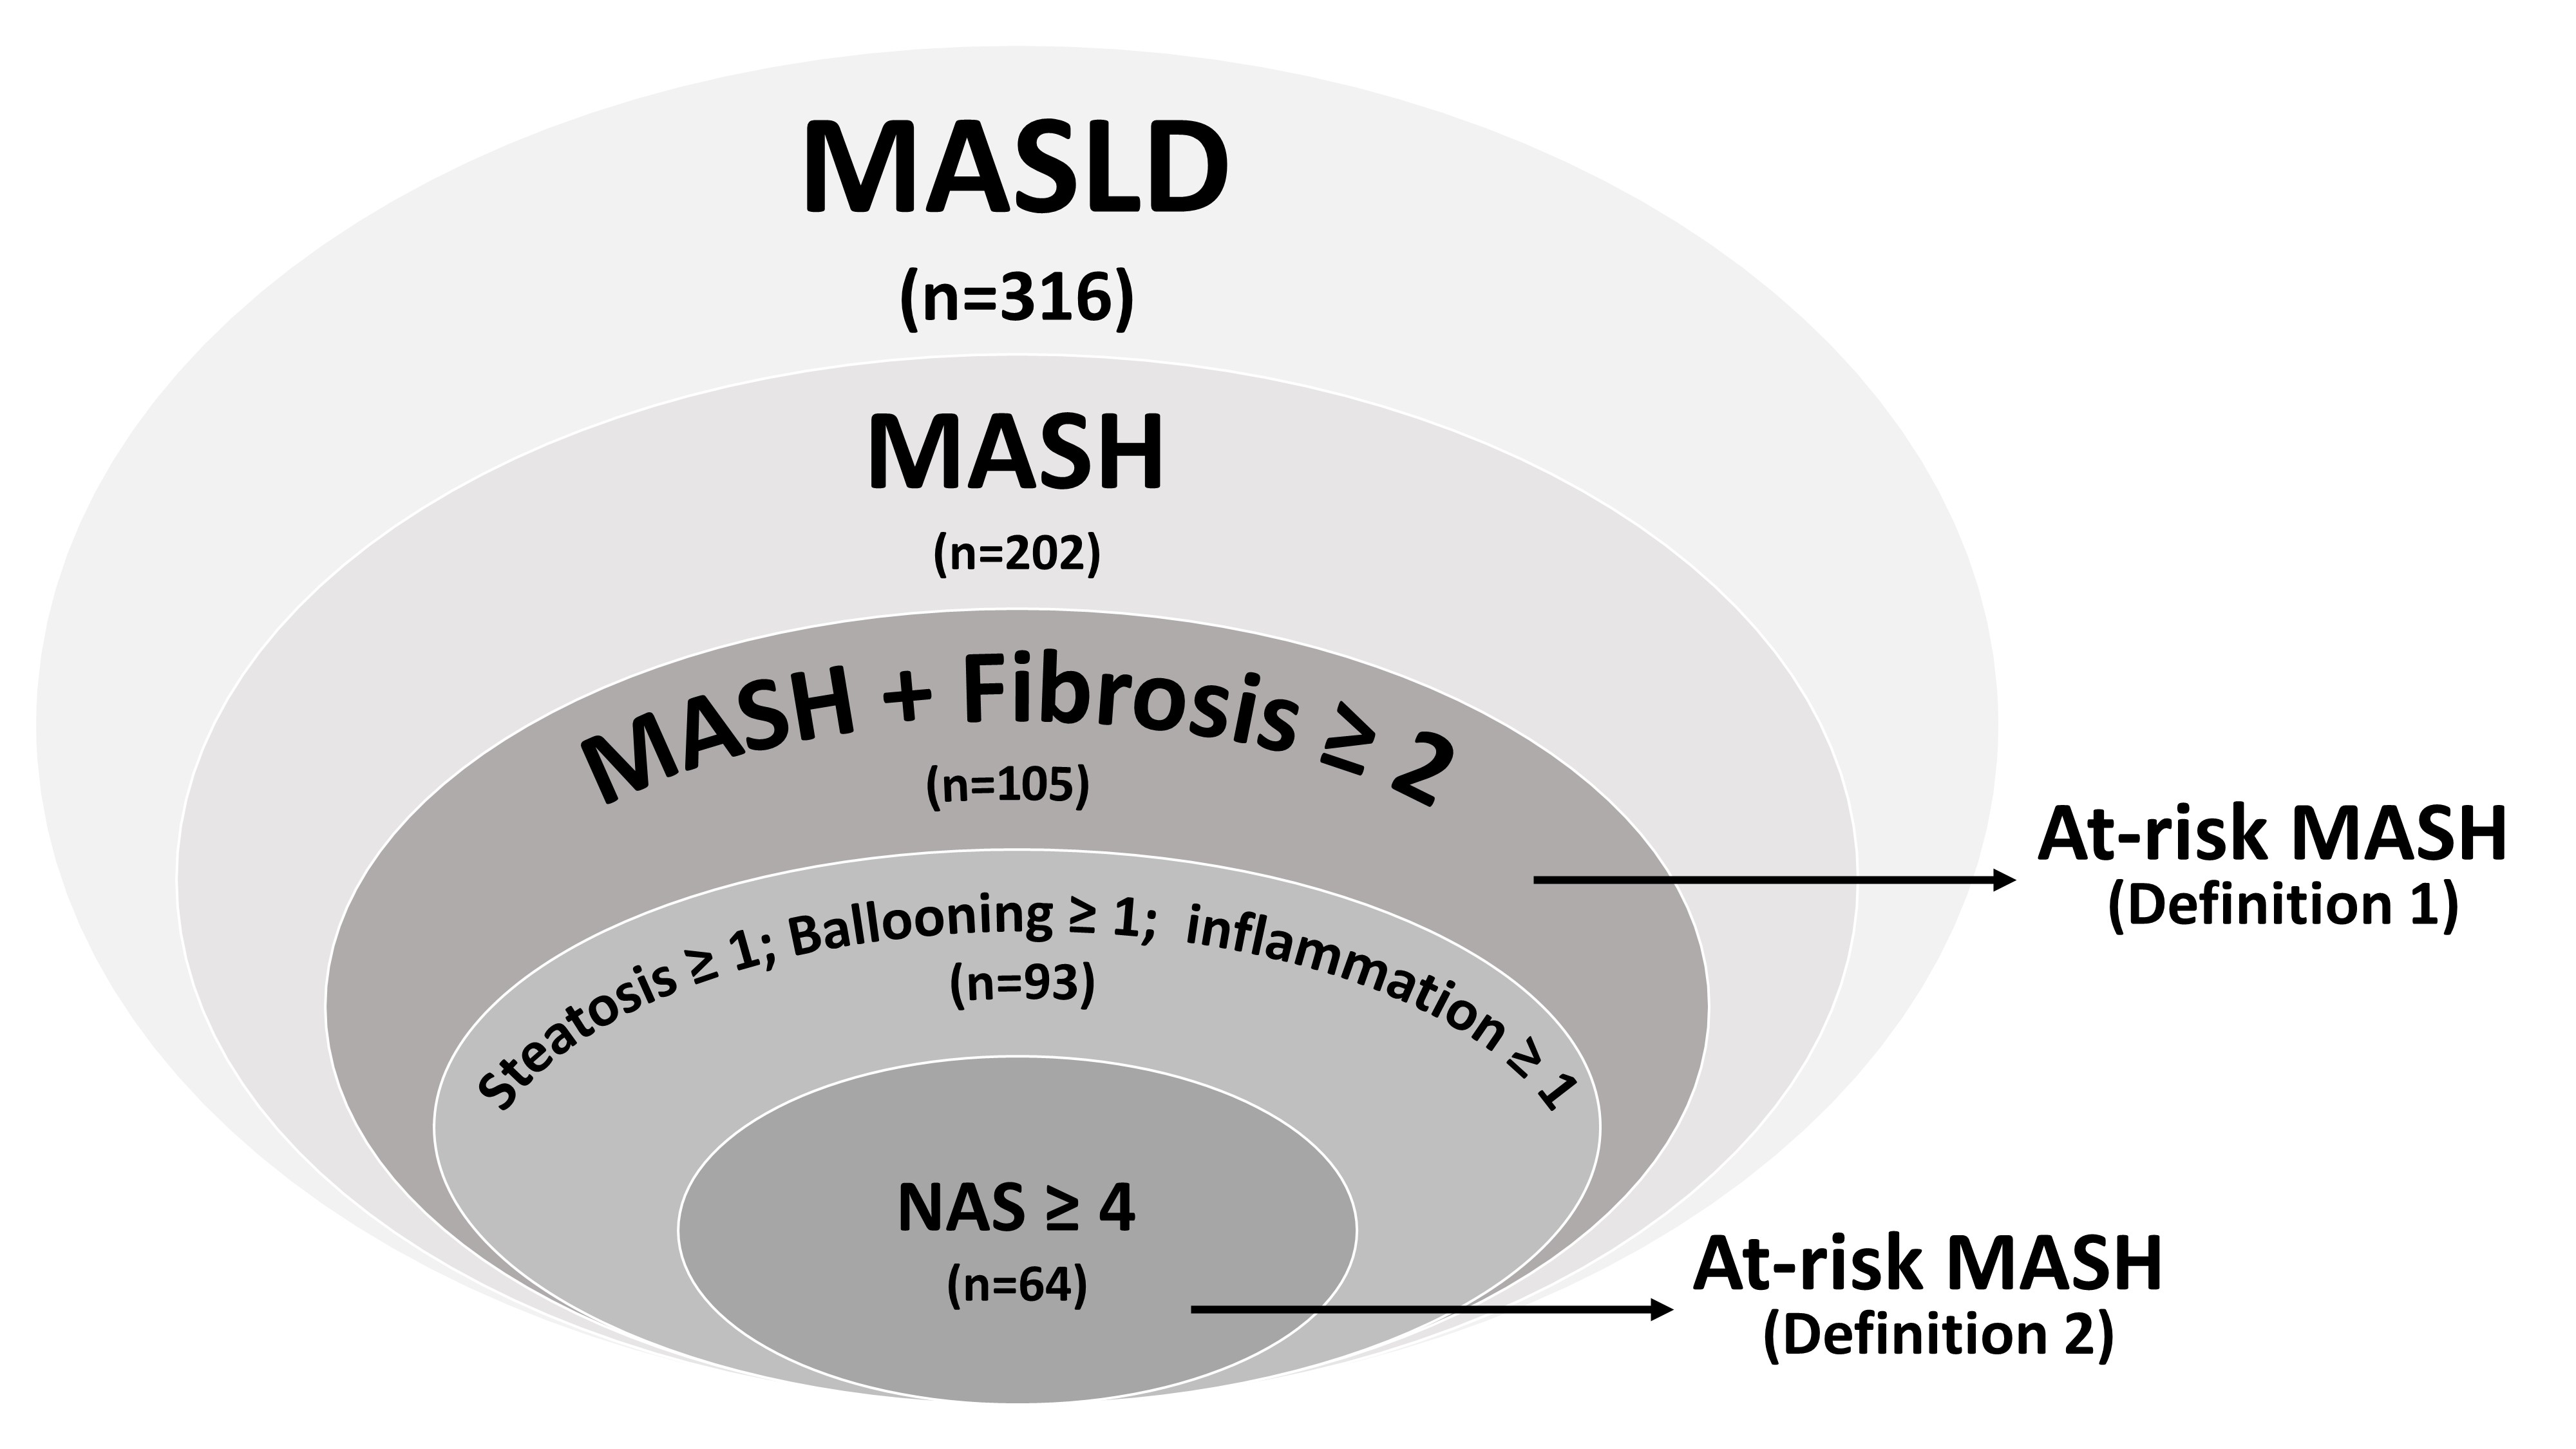
Motivation: MRE-assessed liver stiffness, MRI-derived fat fraction, AST, and FIB-4 are promising predictors for identifying at-risk MASH, which is defined as MASH with fibrosis stage 2 or higher. Some investigators have also proposed an additional criterion, NAS ≥ 4 with at least 1 point in each category.
Goal(s): Assess prediction models for diagnostic accuracy in identifying at-risk MASH under both definitions.
Approach: AUC and its 95% confidence intervals were used to assess the overall diagnostic accuracy.
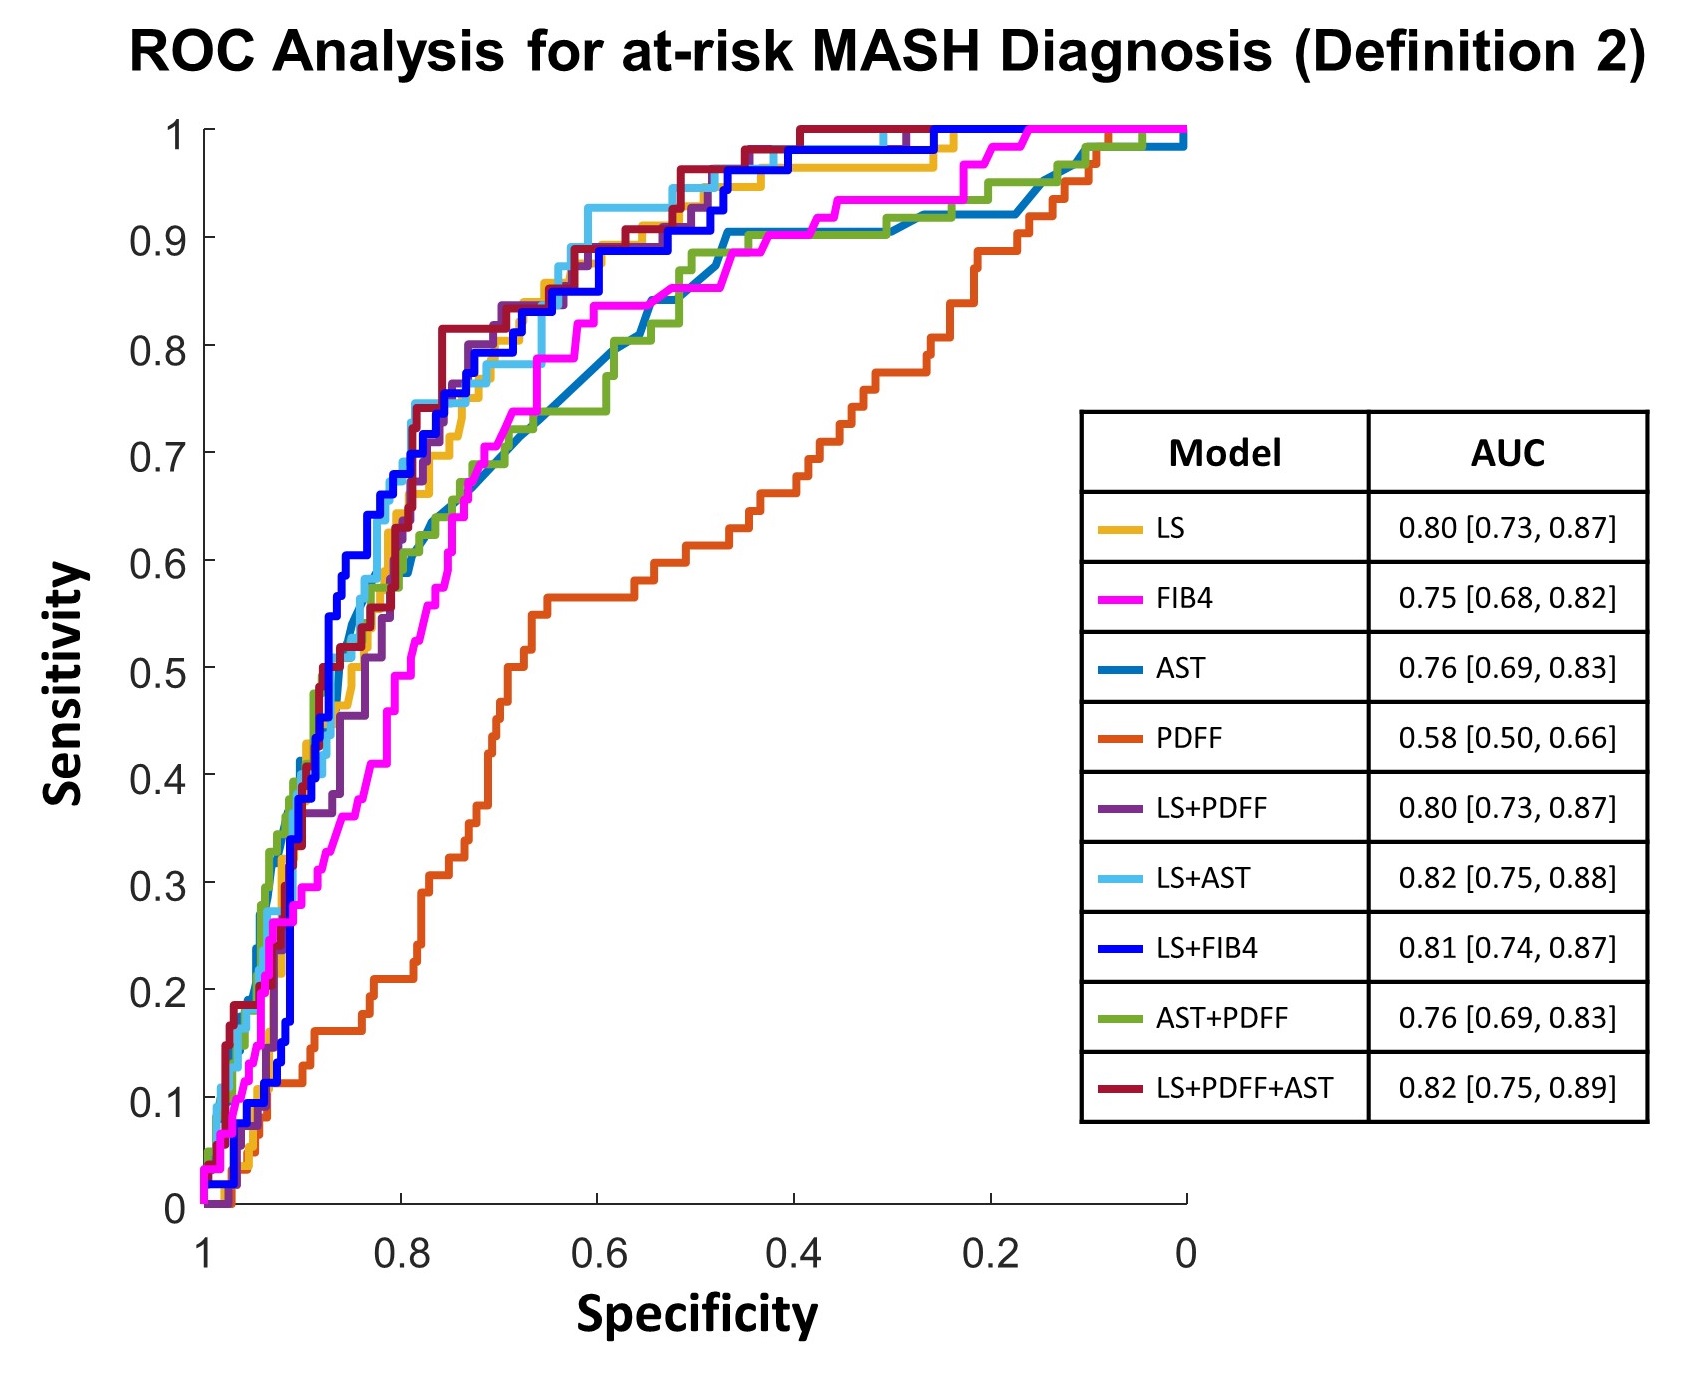
Results: The additional criterion influenced the performance of prediction models, but liver stiffness remains the most reliable single predictor among non-invasive biomarkers.
Impact: At-risk MASH is defined as a MASH diagnosis with fibrosis stage ≥2. Adding a criterion of NAS≥4 with ≥1 point in each category impacts diagnostic accuracy but liver stiffness remains the most reliable single predictor.
Introduction
Metabolic Dysfunction-Associated Steatotic Liver Disease (MASLD) is a complex condition that is experiencing a significant increase in prevalence, particularly among individuals with metabolic disorders (1). The more severe form of metabolic dysfunction-associated steatohepatitis (MASH) is associated with faster disease progression and higher mortality rates (2). It has been demonstrated that MASH patients with fibrosis stage 2 or higher, have less favorable outcomes with a significantly increased risk of liver-related mortality (3-6). Therefore, a MASH diagnosis with fibrosis stage 2 or higher is defined as at-risk MASH (Definition 1), which is now used as a criterion for enrollment in clinical trials and pharmacologic therapy (7). Some investigators have also proposed an additional criterion, stating that the MASLD activity score (NAS) needs to be no less than 4 with at least 1 point in each category (Definition 2) (8).Recently, studies using noninvasive biomarkers to identify at-risk MASH for both definitions have garnered significant clinical interest. Among these biomarkers, MR Elastography (MRE)-assessed liver stiffness (LS), MRI-derived proton density fat fraction (PDFF), aspartate aminotransferase (AST) and fibrosis 4 index (FIB-4) have emerged as promising predictors for identifying at-risk MASH (8-10).
In this study, we aimed to evaluate the diagnostic accuracy of prediction models in identifying patients meeting the criteria for at-risk MASH under both definitions.
Methods
This study encompassed two datasets, one from Mayo Clinic (N=188) and the other one from UCSD (N=128). In total, 316 patients who had suspected or diagnosed MASLD, were enrolled. All patients underwent MRI/MRE exams, laboratory tests, and liver biopsies. LS was calculated from 2D MRE at 60Hz. PDFF was calculated from 6-point Dixon MRI. All liver biopsies were assessed by the presence of MASH, grade of steatosis, inflammation, ballooning, and fibrosis stage based on MASH Clinical Research Network (CRN) Histologic Scoring System (11). Wilcoxon rank sum tests were applied to test the differences between groups. Logistic regression models were trained to diagnose at-risk MASH. The area under the receiver operating characteristic (AUC) and its 95% confidence intervals were used to assess the overall diagnostic accuracy. A significance level of p<0.05 was used in this study.Results
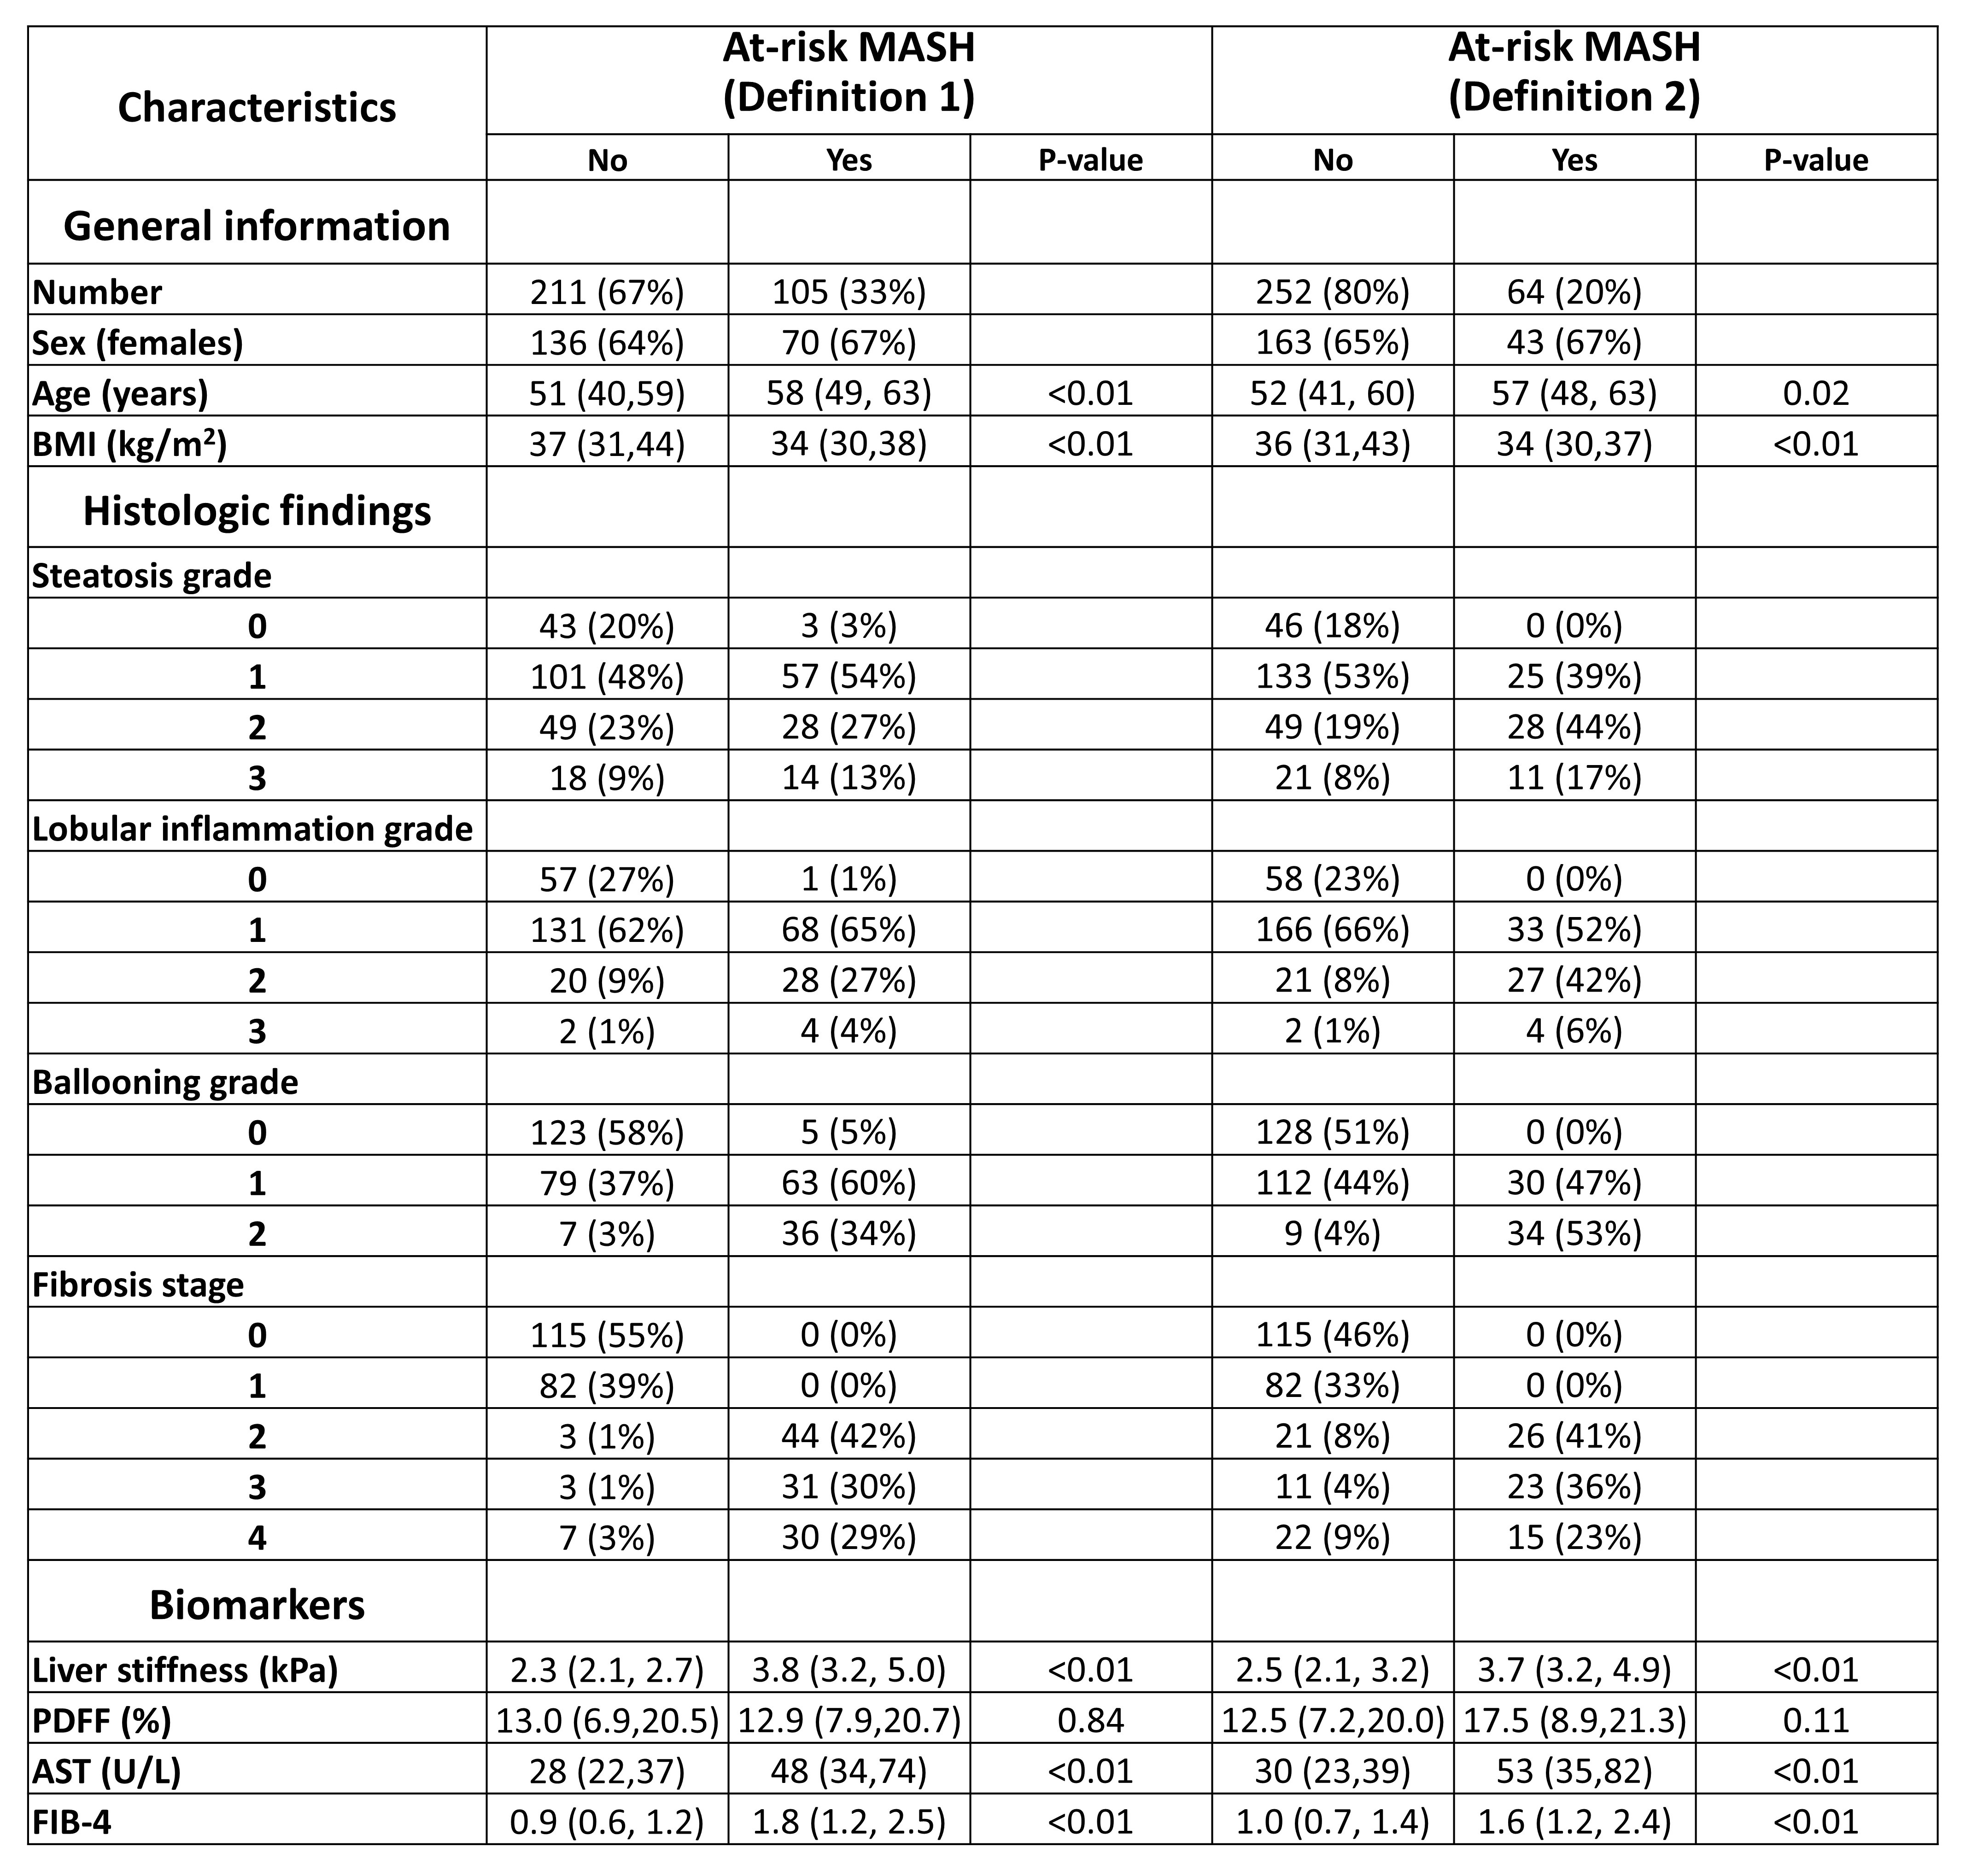
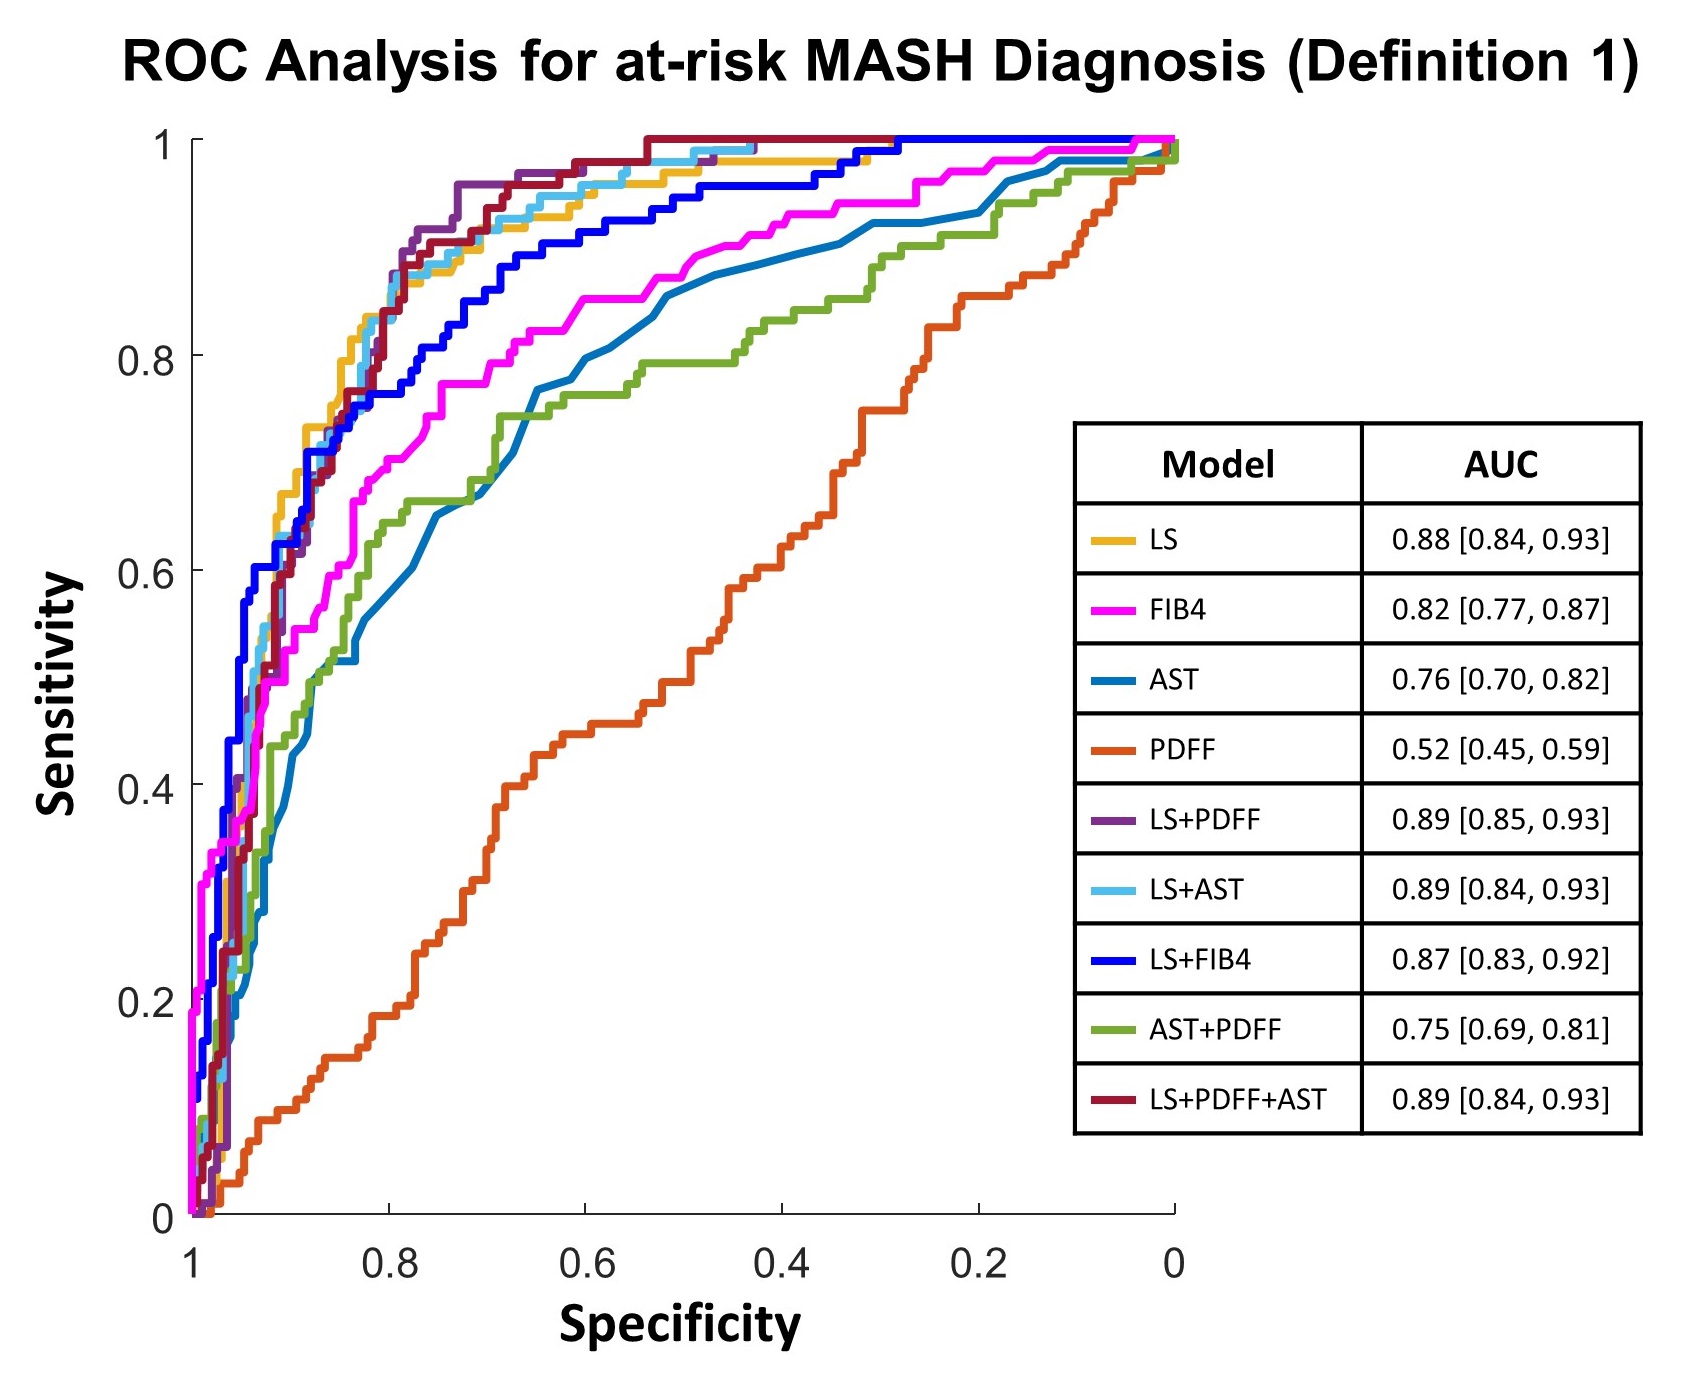
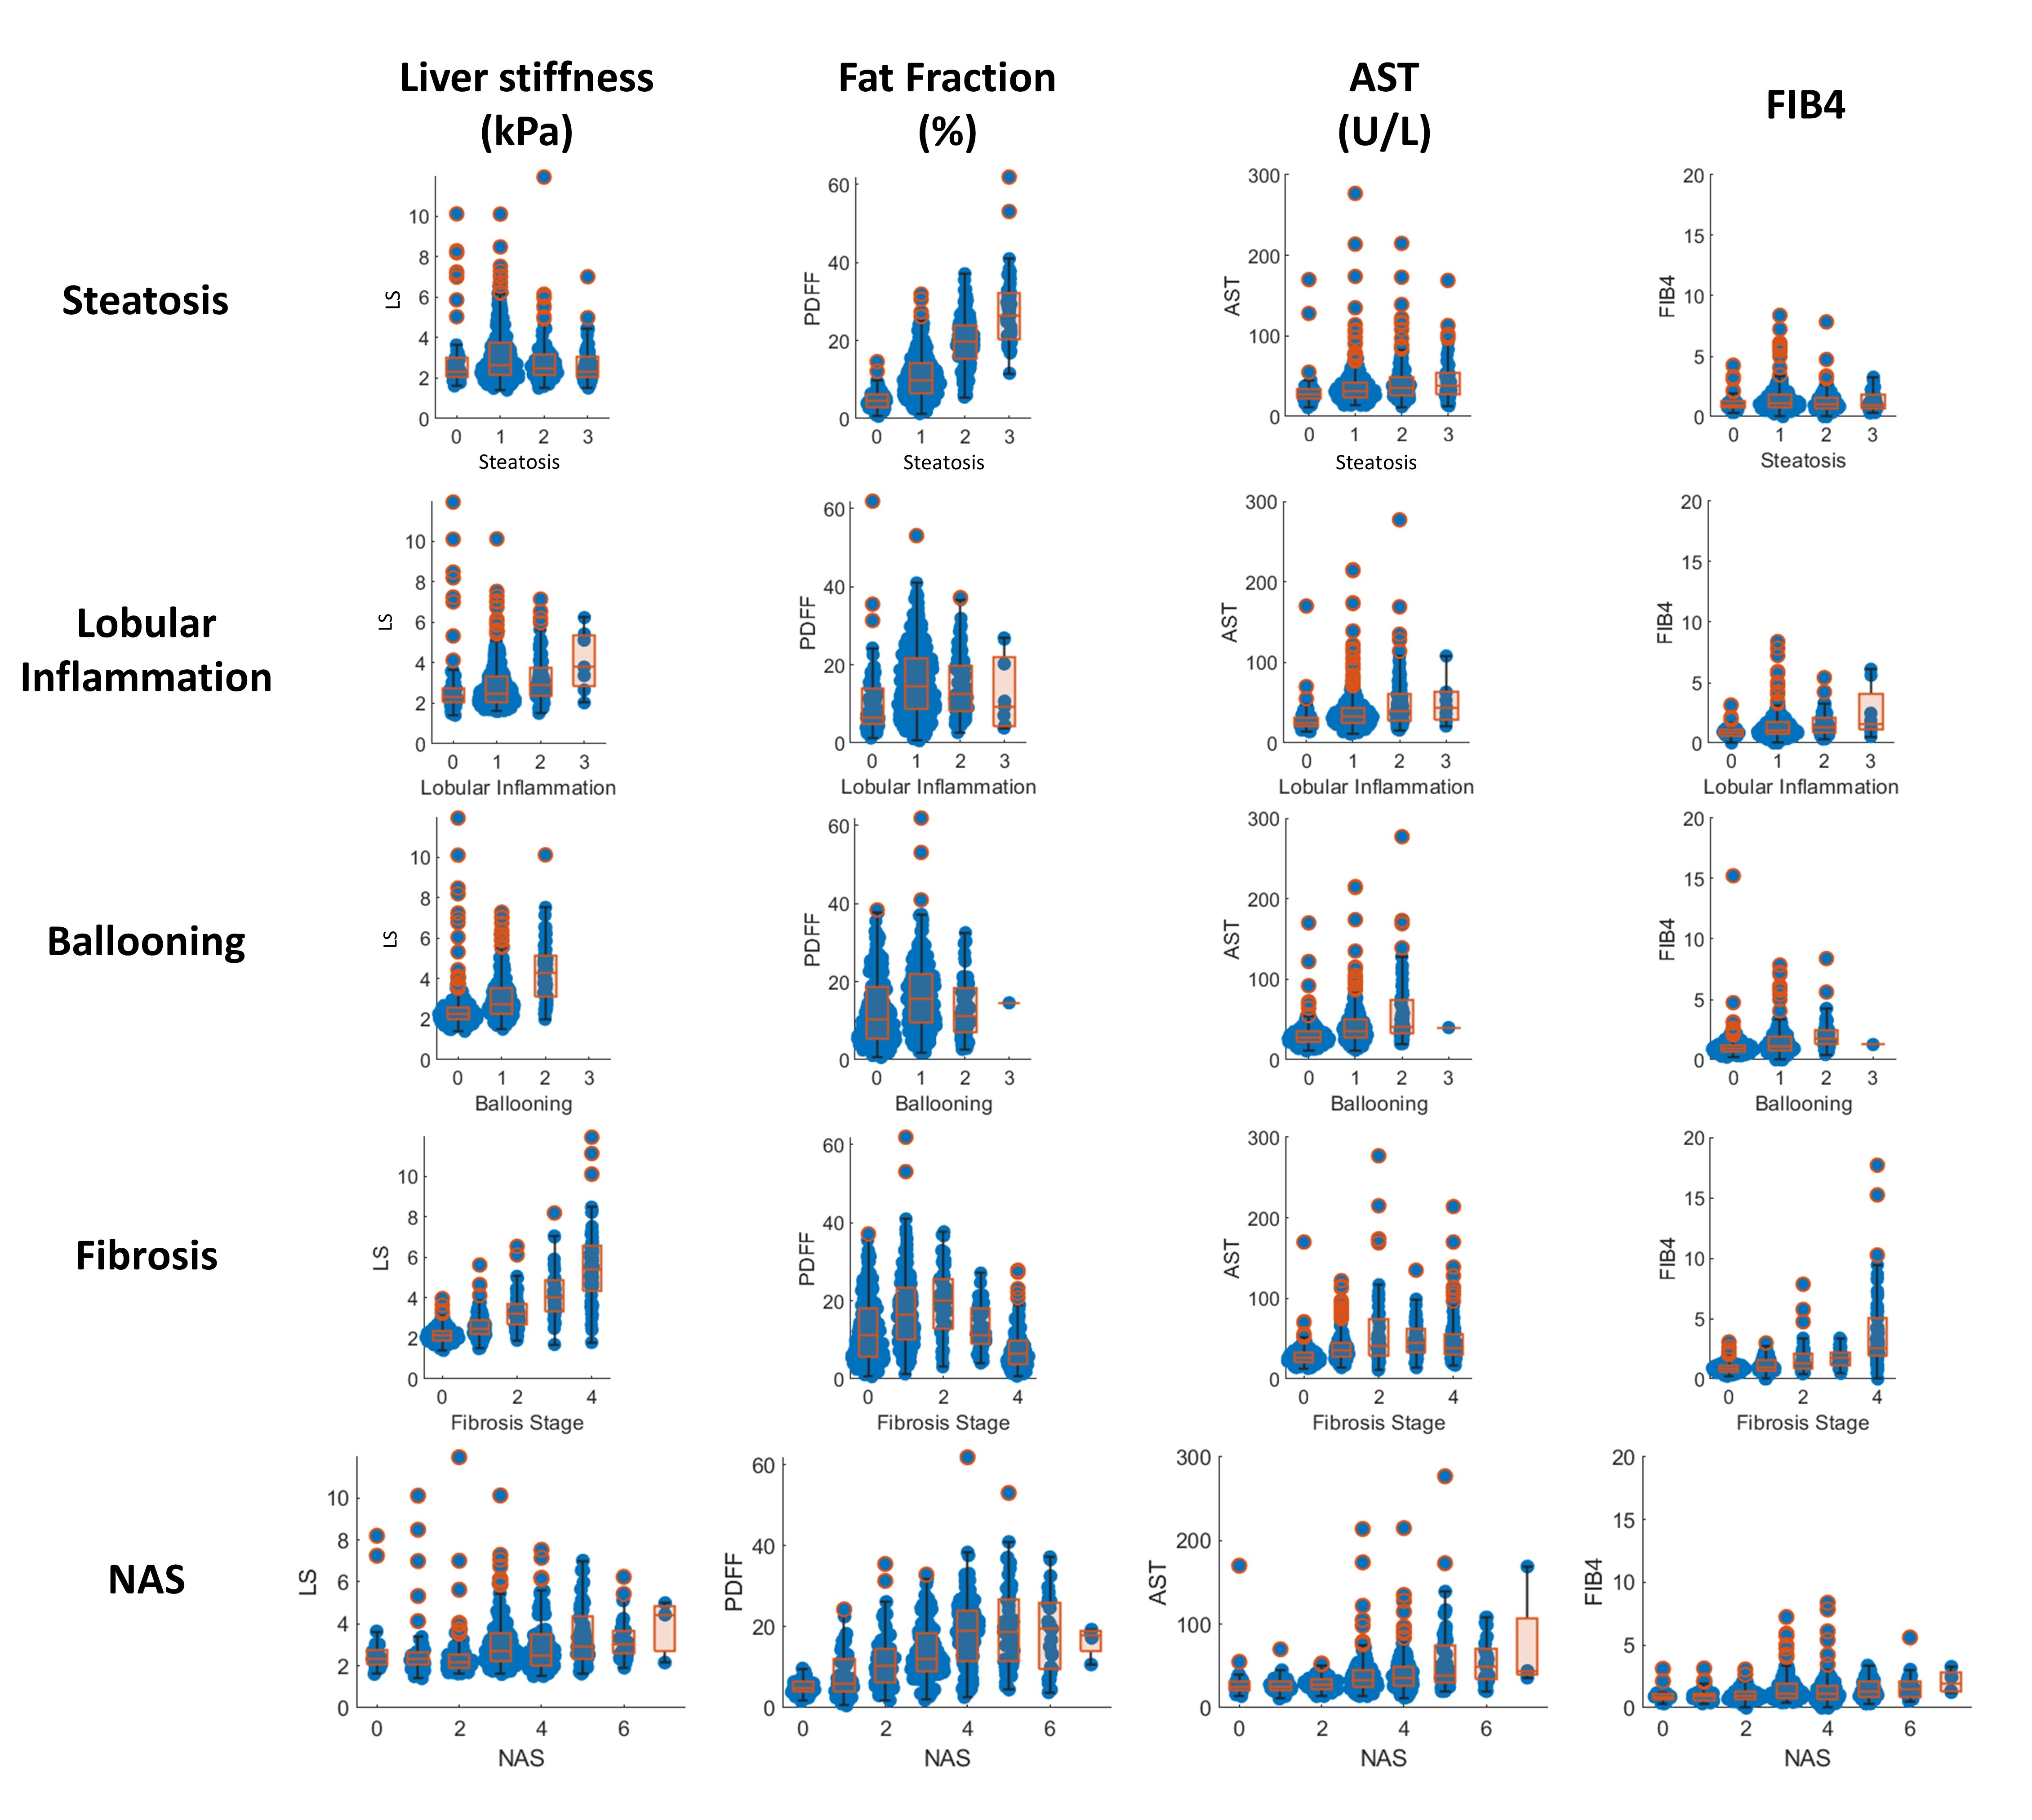
The patient characteristics under the two at-risk MASH criteria are listed in Table 1. LS, AST, and FIB4 all showed significant differences between the non-at-risk and at-risk MASH groups under both definitions, whereas PDFF showed no significant difference. The prediction model with LS and PDFF showed the highest AUC value (0.89 [0.85, 0.93]) in identifying at-risk MASH of Definition 1 (Figure 1). The prediction model with LS, PDFF and AST showed the highest AUC value (0.82 [0.75, 0.89]) in identifying at-risk MASH of Definition 2 (Figure 2). As shown in Figure 3, PDFF and AST increased with steatosis grade, while LS and AST increased with ballooning and inflammation grades. LS and FIB4 also demonstrated an increase with fibrosis stages (Figure 3). However, it’s worth noting that PDFF did not show a monotonically increasing trend against inflammation, fibrosis stages or NAS score.Discussion
The introduction of the criterion that the NAS should be no less than 4 with at least 1 point in each category (Figure 4) had an impact on the apparent diagnostic accuracy of prediction models. This change resulted in forty-one patients being categorized as at-risk MASH according to definition 1 but excluded from definition 2. Among these patients, eight had no points in either steatosis, ballooning or lobular inflammation, while four had incomplete biopsy diagnosis. The remaining twenty-nine had one point in each category, thus their NAS was 3. Determining the true distinction between a NAS score of 3 and 4 can be challenging, especially considering the relatively moderate to poor interobserver agreement in grading steatosis, ballooning, and inflammation (12, 13). The classification of these twenty-nine patients with a NAS score of 3 as at-risk or not depends on their clinical outcomes. We plan to conduct follow-up examinations for these patients to compare their disease progression to those at-risk MASH patients with NAS≥4. By the time we present this work, we will have accumulated additional data for a more comprehensive analysis.In this large cohort, despite a decrease in diagnostic accuracy for identifying at-risk MASH as per definition 2, LS remains the most reliable single predictor when compared to other factors. This observation aligns with recent findings from a study involving 89 patients (9).
Conclusion
Our study demonstrates that different definitions of at-risk MASH influenced the diagnostic accuracy of noninvasive biomarkers but don’t alter the superior performance of liver stiffness. Further analysis of the inclusion criteria needs to be explored.Acknowledgements
This study is funded by NIH grants EB017197 (M.Y.), EB001981(R.L.E.), DK115594 (A.M.A.), DK059615 (V.S.), and DoD grant W81XWH-19-1-0583-01 (M.Y.).References
1. Powell EE, Wong VW, Rinella M. Non-alcoholic fatty liver disease. Lancet (London, England) 2021;397(10290):2212-2224. doi: 10.1016/s0140-6736(20)32511-3
2. Simon TG, Roelstraete B, Khalili H, Hagström H, Ludvigsson JF. Mortality in biopsy-confirmed nonalcoholic fatty liver disease: results from a nationwide cohort. Gut 2021;70(7):1375-1382. doi: 10.1136/gutjnl-2020-322786
3. Kleiner DE, Brunt EM, Wilson LA, Behling C, Guy C, Contos M, Cummings O, Yeh M, Gill R, Chalasani N, Neuschwander-Tetri BA, Diehl AM, Dasarathy S, Terrault N, Kowdley K, Loomba R, Belt P, Tonascia J, Lavine JE, Sanyal AJ. Association of Histologic Disease Activity With Progression of Nonalcoholic Fatty Liver Disease. JAMA Netw Open 2019;2(10):e1912565. doi: 10.1001/jamanetworkopen.2019.12565
4. Rowe IA, Parker R. The diagnosis of nonalcoholic fatty liver disease should carry important prognostic information. Nat Rev Gastroenterol Hepatol 2019;16(8):449-450. doi: 10.1038/s41575-019-0168-0
5. Dulai PS, Singh S, Patel J, Soni M, Prokop LJ, Younossi Z, Sebastiani G, Ekstedt M, Hagstrom H, Nasr P, Stal P, Wong VW, Kechagias S, Hultcrantz R, Loomba R. Increased risk of mortality by fibrosis stage in nonalcoholic fatty liver disease: Systematic review and meta-analysis. Hepatology 2017;65(5):1557-1565. doi: 10.1002/hep.29085
6. Ekstedt M, Hagström H, Nasr P, Fredrikson M, Stål P, Kechagias S, Hultcrantz R. Fibrosis stage is the strongest predictor for disease-specific mortality in NAFLD after up to 33 years of follow-up. Hepatology 2015;61(5):1547-1554. doi: 10.1002/hep.27368
7. Harrison SA, Allen AM, Dubourg J, Noureddin M, Alkhouri N. Challenges and opportunities in NASH drug development. Nature medicine 2023;29(3):562-573. doi: 10.1038/s41591-023-02242-6
8. Woreta TA, Van Natta ML, Lazo M, Krishnan A, Neuschwander-Tetri BA, Loomba R, Mae Diehl A, Abdelmalek MF, Chalasani N, Gawrieh S, Dasarathy S, Vuppalanchi R, Siddiqui MS, Kowdley KV, McCullough A, Terrault NA, Behling C, Kleiner DE, Fishbein M, Hertel P, Wilson LA, Mitchell EP, Miriel LA, Clark JM, Tonascia J, Sanyal AJ. Validation of the accuracy of the FAST™ score for detecting patients with at-risk nonalcoholic steatohepatitis (NASH) in a North American cohort and comparison to other non-invasive algorithms. PloS one 2022;17(4):e0266859. doi: 10.1371/journal.pone.0266859
9. Li J, Lu X, Zhu Z, Kalutkiewicz KJ, Mounajjed T, Therneau TM, Venkatesh SK, Sui Y, Glaser KJ, Hoodeshenas S, Manduca A, Shah VH, Ehman RL, Allen AM, Yin M. Head-to-head comparison of magnetic resonance elastography-based liver stiffness, fat fraction, and T1 relaxation time in identifying at-risk NASH. Hepatology 2023. doi: 10.1097/hep.0000000000000417
10. Kim BK, Tamaki N, Imajo K, Yoneda M, Sutter N, Jung J, Lin T, Tu XM, Bergstrom J, Nguyen K, Nguyen L, Le T, Madamba E, Richards L, Valasek MA, Behling C, Sirlin CB, Nakajima A, Loomba R. Head-to-head comparison between MEFIB, MAST, and FAST for detecting stage 2 fibrosis or higher among patients with NAFLD. Journal of hepatology 2022;77(6):1482-1490. doi: 10.1016/j.jhep.2022.07.020
11. Kleiner DE, Brunt EM, Van Natta M, Behling C, Contos MJ, Cummings OW, Ferrell LD, Liu YC, Torbenson MS, Unalp-Arida A, Yeh M, McCullough AJ, Sanyal AJ. Design and validation of a histological scoring system for nonalcoholic fatty liver disease. Hepatology 2005;41(6):1313-1321. doi: 10.1002/hep.20701
12. Jung ES, Lee K, Yu E, Kang YK, Cho MY, Kim JM, Moon WS, Jeong JS, Park CK, Park JB, Kang DY, Sohn JH, Jin SY. Interobserver Agreement on Pathologic Features of Liver Biopsy Tissue in Patients with Nonalcoholic Fatty Liver Disease. J Pathol Transl Med 2016;50(3):190-196. doi: 10.4132/jptm.2016.03.01
13. Davison BA, Harrison SA, Cotter G, Alkhouri N, Sanyal A, Edwards C, Colca JR, Iwashita J, Koch GG, Dittrich HC. Suboptimal reliability of liver biopsy evaluation has implications for randomized clinical trials. Journal of hepatology 2020;73(6):1322-1332. doi: 10.1016/j.jhep.2020.06.025
Figures