4748
Assessment of Patients with Non-Alcoholic Fatty Liver Disease In Vivo Using Ultrashort Echo Time Magnetization Transfer (UTE-MT)1The Fifth Affiliated Hospital of Sun Yat-Sen University, Zhuhai, China, 2University of California San Diego, San Diego, CA, United States
Synopsis
Keywords: Liver, Liver
Motivation: UTE-MT is suggested to indirectly assess macromolecular contents in both short and long T2 tissues, which may have the potential to assess non-alcoholic fatty liver disease (NAFLD).
Goal(s): To utilize the UTE-MT technique to assess the patients with NAFLD.
Approach: A total of 40 subjects were recruited (20 with NAFLD and 20 without NAFLD) and underwent UTE-MT scans on a 3T MRI scanner.
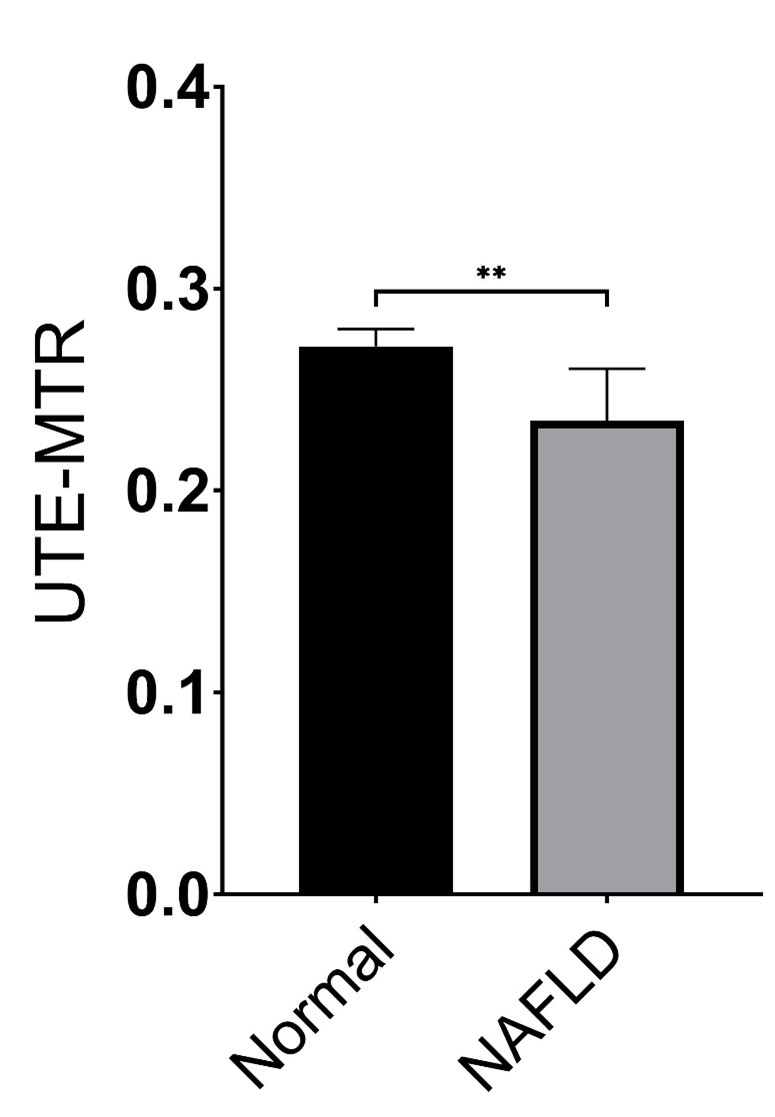
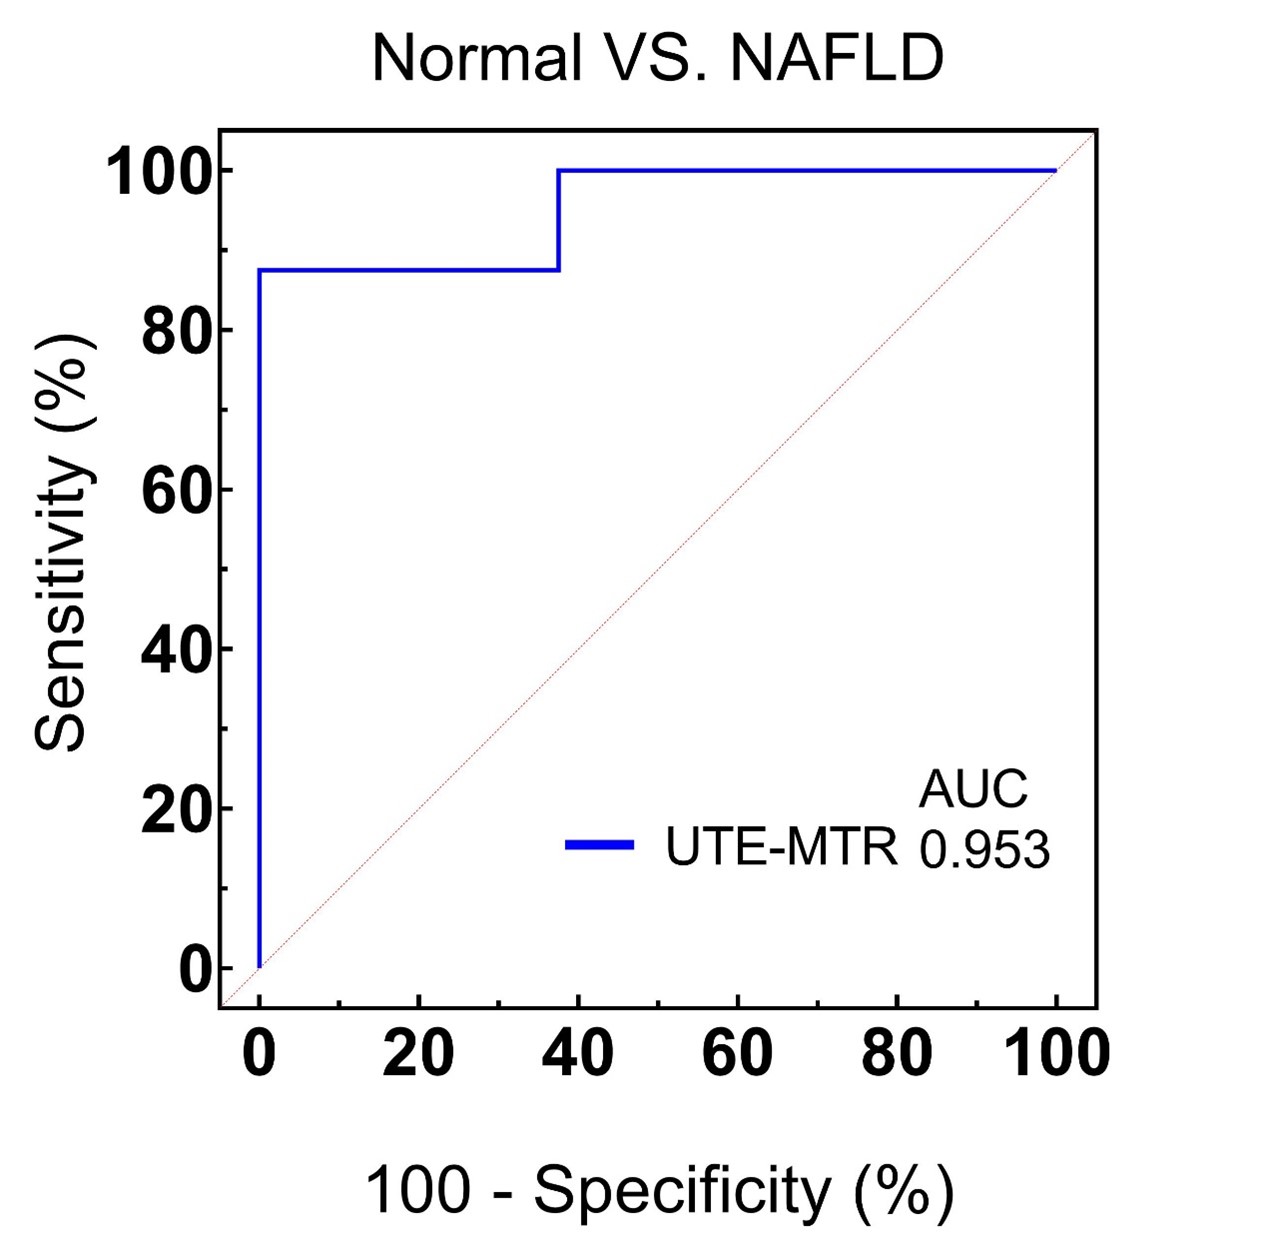
Results: The liver UTE-MTR value of NAFLD patients was significantly lower than that of normal ones (P<0.001). The ROC analysis between NAFLD patients and normal controls showed a high AUC value of 0.953.
Impact: The UTE-MT technique can be utilized for the assessment of macromolecular content changes in NAFLD livers. The UTE-MTR may serve as a promising biomarker for screening patients with NAFLD.
Introduction
Non-alcoholic fatty liver disease (NAFLD) represents the hepatic dimension of a constellation of conditions intricately linked with metabolic dysfunction [1]. The ultrashort echo time magnetization transfer (UTE-MT) technique is proposed to indirectly evaluate macromolecular content changes in either short or long T2 tissues [2, 3]. The principal objective of this study is to conduct a prospective assessment of hepatic macromolecular content variations through the application of the UTE-MT imaging technique in cohorts with and without NAFLD.Methods
A total of 40 subjects were recruited (20 with NAFLD and 20 normal volunteers) and underwent UTE-MT scans on a 3.0T MRI scanner (Signa, Pioneer, GE Healthcare). A Fermi pulse was employed to generate the MT contrast in the UTE-MT sequence with a duration of 8 ms and bandwidth of 160 Hz. The frequency offset of this MT pulse was 1500 Hz. The UTE-MT sequence was scanned twice with a flip angle of 750° for MT-On and 0° for MT-Off. Other UTE-MT sequence parameters were as follows: TR = 85 ms, TE = 0.032 ms, excitation flip angle = 5°, FOV = 38 × 38 cm2, matrix = 128 × 128, slice thickness = 6 mm, slice number = 28, and total scan time = 3 min. The UTE-MT scan is triggered by respiratory gating. Liver UTE-MT ratio (UTE-MTR) value was measured and compared between subjects with and without NAFLD using a two-tailed test. The performance of UTE-MTR in discrimination of the normal and NAFLD cohorts was also evaluated using receiver operator characteristic (ROC) analysis.Results
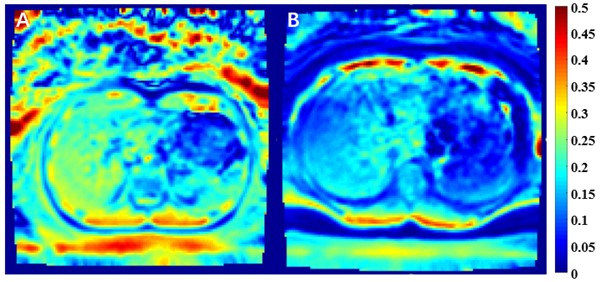
Figure 1 shows representative liver UTE-MTR maps of the subjects with and without NAFLD. The liver UTE-MTR values of patients with NAFLD were significantly lower than those of the normal group (P < 0.001) (Figure 2), demonstrating a lower macromolecular content in the NAFLD cohort. A high area under the curve (AUC) value (AUC = 0.953) obtained from the ROC analysis demonstrates that the UTE-MTR could differentiate the subjects with and without NAFLD (Figure 3).Discussion and Conclusion
To our best knowledge, this is the first prospective study to apply the UTE-MT technique in the liver to assess NAFLD. Our findings suggested the macromolecular content in the liver of NAFLD patients decreases in comparison to normal clothes. This demonstrates that the UTE-MTR is a promising biomarker for screening of patients with NAFLD.Acknowledgements
No acknowledgement found.References
[1] Brunt EM, Wong VW, Nobili V et al (2015) Nonalcoholic fatty liver disease. Nat Rev Dis Primers 1:15080
[2] Li Y, Liang X, Liu J, Ma Y (2023) Assessment of Osteoporosis at the Lumbar Spine Using Ultrashort Echo Time Magnetization Transfer (UTE-MT) MRI. J Magn Reson Imaging. 10.1002/jmri.28910
[3] Jerban S, Ma Y, Wong JH et al (2019) Ultrashort echo time magnetic resonance imaging (UTE-MRI) of cortical bone correlates well with histomorphometric assessment of bone microstructure. Bone 123:8-17
Figures