4746
PDFF diagnoses MASH in patients with severe obesity but without known liver disease1Department of Radiology, University of Wisconsin-Madison, Madison, WI, United States, 2Department of Pathology and Laboratory Medicine, University of Wisconsin-Madison, Madison, WI, United States, 3Department of Radiology, UC San Diego, San Diego, CA, United States, 4Department of Surgery, University of Wisconsin-Madison, Madison, WI, United States, 5Department of Surgery, William S. Middleton VA, Madison, WI, United States, 6Department of Medicine, UC San Diego, San Diego, CA, United States, 7Translational Clinical Sciences, Pfizer Research & Development, Cambridge, MA, United States, 8Department of Surgery, UC San Diego, San Diego, CA, United States, 9San Diego Supercomputer Center, UC San Diego, San Diego, CA, United States, 10Department of Medical Physics, University of Wisconsin-Madison, Madison, WI, United States, 11Department of Biomedical Engineering, University of Wisconsin-Madison, Madison, WI, United States, 12Department of Medicine, University of Wisconsin-Madison, Madison, WI, United States, 13Department of Emergency Medicine, University of Wisconsin-Madison, Madison, WI, United States
Synopsis
Keywords: Liver, Quantitative Imaging, PDFF, MASH, NASH, MASLD, NAFLD, cT1
Motivation: To address the pressing need for non-invasive diagnosis of metabolic dysfunction-associated steatohepatitis (MASH).
Goal(s): To evaluate the potential of proton-density fat-fraction (PDFF), corrected T1 (cT1), liver enzymes, and fibrosis scores to assist in the diagnosis of MASH.
Approach: The study included study participants with obesity and at risk for MASH, undergoing bariatric surgery with intraoperative liver biopsy. Potential predictors and predictor combinations were evaluated as classifiers for MASH and steatosis.
Results: PDFF distinguished MASH from non-MASH (AUC=0.85; 95%CI 0.79-0.91, p<0.0001). A cutoff of PDFF≥13.9% detected MASH with 90% specificity and 59% sensitivity. Neither cT1, liver enzymes, nor fibrosis scores significantly improved diagnostic performance.
Impact: Our results suggest that PDFF alone may be sufficient for non-invasive detection of metabolic dysfunction-associated steatohepatitis (MASH). This novel use case for an established method has the potential to transform the diagnostic approach to MASH which currently necessitates invasive biopsy.
Introduction
Metabolic dysfunction-associated steatotic liver disease (MASLD) affects 25-30% of the global population1-5, particularly individuals with obesity1,6. 10-20% of cases of isolated steatosis can progress to metabolic dysfunction-associated steatohepatitis (MASH)7, which increases the risk of cirrhosis and hepatocellular carcinoma. Liver biopsy is the reference standard for MASH diagnosis, but is costly, invasive, and prone to sampling error8-15. There is a pressing need for accurate, non-invasive diagnosis of MASH8.Recent studies have suggested that MRI-based proton-density fat-fraction (PDFF), a well-established biomarker of liver fat content, may be useful for diagnosing MASH16-20. The purpose of this study is to assess the diagnostic accuracy of PDFF, corrected T1 (cT1), liver enzymes, and fibrosis scores for detecting MASH in individuals with obesity but without known liver disease.
Methods
This analysis is part of a 2-cycle, multicenter prospective study in patients with obesity who are at risk for MASLD and are undergoing bariatric surgery. Cycle 1 took place from 07/2010-01/2016, and cycle 2 from 12/2020-present. Informed consent was obtained after IRB approval. Participants underwent MRI and phlebotomy less than one week prior to intraoperative wedge or core liver biopsy. Blood analysis included aminotransferases (ALT, AST) and platelet count.Imaging was performed on clinical 3.0T MRI systems (GE Signa HDxt, Discovery MR750, or Signa Premier; GE Healthcare, Waukesha, WI) using chemical-shift encoded MRI to quantify PDFF (IDEAL IQ, GE Healthcare). Typical acquisition parameters included: FOV=400-440x320-330mm, matrix=224-256x128-160, slice thickness=8-10mm, TE1=0.76ms, ΔTE=0.71ms, 6 echoes, TR=6.6-7.5ms, bandwidth=125-143kHz, and flip angle=3°. For cycle 2, LiverMultiScan cT1 (Perspectum Ltd, Oxford, UK) was also generated from modified Look Locker and multi-echo gradient echo pulse acquisitions.
PDFF maps were analyzed using open-source software (Horos, version 3.3.5) by placing the largest possible elliptical ROIs in each of the nine Couinaud segments21. Perspectum provided cT1 results (Figure 1). Histologically defined endpoints were ‘steatosis’, ‘no steatosis’, ‘MASH’, and ‘non-MASH’.
We evaluated PDFF, cT1, aminotransferases, and FIB-422 and APRI23 as classifiers for MASH and steatosis. We generated receiver-operating characteristic (ROC)-curves to determine the best threshold for discriminating histologically-diagnosed MASH and non-MASH. Performance parameters were calculated. We also performed Bayesian Information Criterion (BIC)-based stepwise logistic regression to determine the best multivariate model.
Results
179 participants completed PDFF exams and underwent serum biomarker testing and liver biopsy (Table 1). A sub-cohort of 71 participants from cycle 2 also completed cT1 acquisition.Participants with MASH had higher PDFF and cT1 compared to those with non-MASH (Figure 2). PDFF distinguished MASH from non-MASH (AUC=0.85; 95%CI: 0.79-0.91, p<0.0001). PDFF>13.9% identified MASH with high specificity (90%; 95%CI: 84%-95%; sensitivity 59%), while PDFF<6.1% excluded MASH with high sensitivity (92%, 95%CI: 80%-98%; specificity 59%, Figure 3a+e).
Performance of all predictors was compared using the cycle 2 sub-cohort, who underwent both PDFF and cT1 (Table 2). For distinguishing MASH from non-MASH, PDFF had the highest AUC (0.90; 95%CI: 0.82-0.97), followed by cT1 (0.73; 95%CI: 0.61-0.86). With the combination of PDFF+cT1, AUC increased slightly, although it did not reach statistical significance (0.91; 95%CI: 0.84-0.98; p=0.472) (Figure 3c).
Considering the entire cohort (N=179), PDFF had high AUC for separation of steatosis from no steatosis (AUC=0.95; 95%CI: 0.92-0.98; p<0.0001) (Figure 3b). For the cycle 2 cohort (N=71), adding cT1 did not significantly improve performance for the detection of steatosis (PDFF vs PDFF+cT1, p>0.05; Figure 3d).
In the sub-cohort with complete sets of predictors, the BIC-based search identified PDFF as the sole best predictor for the detection of both MASH and steatosis. None of the other predictors improved the model’s performance.
Discussion
PDFF had the best diagnostic performance of any single biomarker for both the diagnosis of MASH and steatosis. Interestingly, adding cT1 did not add diagnostic value compared to PDFF alone, nor did aminotransferases or composite biomarkers (FIB-4, APRI). Our results suggest that PDFF alone may be sufficient for non-invasive detection of a high likelihood of MASH. Further, we propose the following diagnostic categories in obese patients with no known liver disease: ‘probable’ (PDFF>13.9%), ‘possible’ (PDFF=6.1-13.9%), and ‘not likely’ (PDFF<6.1%).Recent studies have shown that cT1 improves the prognostic value of PDFF to identify MASH16,18. However, those cohorts consisted of patients with known or suspected MASH who had clinical indications for biopsy.
Based on encouraging work in recent studies19,20 future work will include magnetic resonance elastography (MRE) for possible stratification of MASH into groups with fibrosis stage ≤F1, and ≥F2, i.e.: at-risk MASH.
Conclusion
Our results demonstrate that PDFF has the highest diagnostic accuracy of any of the single biomarkers evaluated in this study, for diagnosis of MASH and detection of steatosis, and may be sufficient for non-invasive detection of early stages of MASHAcknowledgements
This work was supported by the NIH (R01 DK088925). The authors also acknowledge GE Healthcare who provides research support to the University of Wisconsin-Madison, as well as clinical research support from Pfizer Inc. Dr. Reeder is the John H. Juhl Endowed Chair of Radiology.References
1. Younossi ZM, Koenig AB, Abdelatif D, Fazel Y, Henry L, Wymer M. Global epidemiology of nonalcoholic fatty liver disease-Meta-analytic assessment of prevalence, incidence, and outcomes. Hepatology (Baltimore, Md) 2016;64(1):73-84. (In eng). DOI: 10.1002/hep.28431.
2. Ahmed A, Wong RJ, Harrison SA. Nonalcoholic Fatty Liver Disease Review: Diagnosis, Treatment, and Outcomes. Clin Gastroenterol Hepatol 2015;13(12):2062-70. DOI: 10.1016/j.cgh.2015.07.029.
3. Byrne CD, Targher G. NAFLD: a multisystem disease. J Hepatol 2015;62(1 Suppl):S47-64. DOI: 10.1016/j.jhep.2014.12.012.
4. Torres DM, Williams CD, Harrison SA. Features, diagnosis, and treatment of nonalcoholic fatty liver disease. Clin Gastroenterol Hepatol 2012;10(8):837-58. DOI: 10.1016/j.cgh.2012.03.011.
5. Rinella ME. Nonalcoholic fatty liver disease: a systematic review. JAMA 2015;313(22):2263-73. DOI: 10.1001/jama.2015.5370.
6. Young S, Tariq R, Provenza J, et al. Prevalence and Profile of Nonalcoholic Fatty Liver Disease in Lean Adults: Systematic Review and Meta-Analysis. Hepatology communications 2020;4(7):953-972. (In eng). DOI: 10.1002/hep4.1519.
7. Tilg H, Moschen AR. Evolution of inflammation in nonalcoholic fatty liver disease: the multiple parallel hits hypothesis. Hepatology (Baltimore, Md) 2010;52(5):1836-46. (In eng). DOI: 10.1002/hep.24001.
8. Younossi ZM, Loomba R, Anstee QM, et al. Diagnostic modalities for nonalcoholic fatty liver disease, nonalcoholic steatohepatitis, and associated fibrosis. Hepatology (Baltimore, Md) 2018;68(1):349-360. (In eng). DOI: 10.1002/hep.29721.
9. Younossi ZM, Gramlich T, Liu YC, et al. Nonalcoholic fatty liver disease: assessment of variability in pathologic interpretations. Mod Pathol 1998;11(6):560-5. (In eng).
10. Tapper EB, Lok AS. Use of Liver Imaging and Biopsy in Clinical Practice. The New England journal of medicine 2017;377(8):756-768. (In eng). DOI: 10.1056/NEJMra1610570.
11. Poynard T, Lenaour G, Vaillant JC, et al. Liver biopsy analysis has a low level of performance for diagnosis of intermediate stages of fibrosis. Clinical gastroenterology and hepatology : the official clinical practice journal of the American Gastroenterological Association 2012;10(6):657-63.e7. (In eng). DOI: 10.1016/j.cgh.2012.01.023.
12. Özcan HN, Oğuz B, Haliloğlu M, Orhan D, Karçaaltıncaba M. Imaging patterns of fatty liver in pediatric patients. Diagn Interv Radiol 2015;21(4):355-60. (In eng). DOI: 10.5152/dir.2015.14505.
13. Jayakumar S, Middleton MS, Lawitz EJ, et al. Longitudinal correlations between MRE, MRI-PDFF, and liver histology in patients with non-alcoholic steatohepatitis: Analysis of data from a phase II trial of selonsertib. Journal of hepatology 2019;70(1):133-141. (In eng). DOI: 10.1016/j.jhep.2018.09.024.
14. Chalasani N, Younossi Z, Lavine JE, et al. The diagnosis and management of nonalcoholic fatty liver disease: Practice guidance from the American Association for the Study of Liver Diseases. Hepatology (Baltimore, Md) 2018;67(1):328-357. (In eng). DOI: 10.1002/hep.29367.
15. Pai RK, Kleiner DE, Hart J, et al. Standardising the interpretation of liver biopsies in non-alcoholic fatty liver disease clinical trials. Alimentary pharmacology & therapeutics 2019;50(10):1100-1111. (In eng). DOI: 10.1111/apt.15503.
16. Dennis A, Kelly MD, Fernandes C, et al. Correlations Between MRI Biomarkers PDFF and cT1 With Histopathological Features of Non-Alcoholic Steatohepatitis. Frontiers in endocrinology 2020;11:575843. DOI: 10.3389/fendo.2020.575843.
17. Garteiser P, Castera L, Coupaye M, et al. Prospective comparison of transient elastography, MRI and serum scores for grading steatosis and detecting non-alcoholic steatohepatitis in bariatric surgery candidates. JHEP Rep 2021;3(6):100381. DOI: 10.1016/j.jhepr.2021.100381.
18. Andersson A, Kelly M, Imajo K, et al. Clinical Utility of Magnetic Resonance Imaging Biomarkers for Identifying Nonalcoholic Steatohepatitis Patients at High Risk of Progression: A Multicenter Pooled Data and Meta-Analysis. Clinical gastroenterology and hepatology : the official clinical practice journal of the American Gastroenterological Association 2021 (In eng). DOI: 10.1016/j.cgh.2021.09.041.
19. Alsaqal S, Hockings P, Ahlstrom H, et al. The Combination of MR Elastography and Proton Density Fat Fraction Improves Diagnosis of Nonalcoholic Steatohepatitis. J Magn Reson Imaging 2022;56(2):368-379. DOI: 10.1002/jmri.28040.
20. Allen AM, Shah VH, Therneau TM, et al. Multiparametric Magnetic Resonance Elastography Improves the Detection of NASH Regression Following Bariatric Surgery. Hepatology communications 2020;4(2):185-192. DOI: 10.1002/hep4.1446.
21. Campo CA, Hernando D, Schubert T, Bookwalter CA, Pay AJV, Reeder SB. Standardized Approach for ROI-Based Measurements of Proton Density Fat Fraction and R2* in the Liver. AJR Am J Roentgenol 2017;209(3):592-603. DOI: 10.2214/AJR.17.17812.
22. Sterling RK, Lissen E, Clumeck N, et al. Development of a simple noninvasive index to predict significant fibrosis in patients with HIV/HCV coinfection. Hepatology (Baltimore, Md) 2006;43(6):1317-25. (In eng). DOI: 10.1002/hep.21178.
23. Lin ZH, Xin YN, Dong QJ, et al. Performance of the aspartate aminotransferase-to-platelet ratio index for the staging of hepatitis C-related fibrosis: an updated meta-analysis. Hepatology (Baltimore, Md) 2011;53(3):726-36. DOI: 10.1002/hep.24105.
Figures
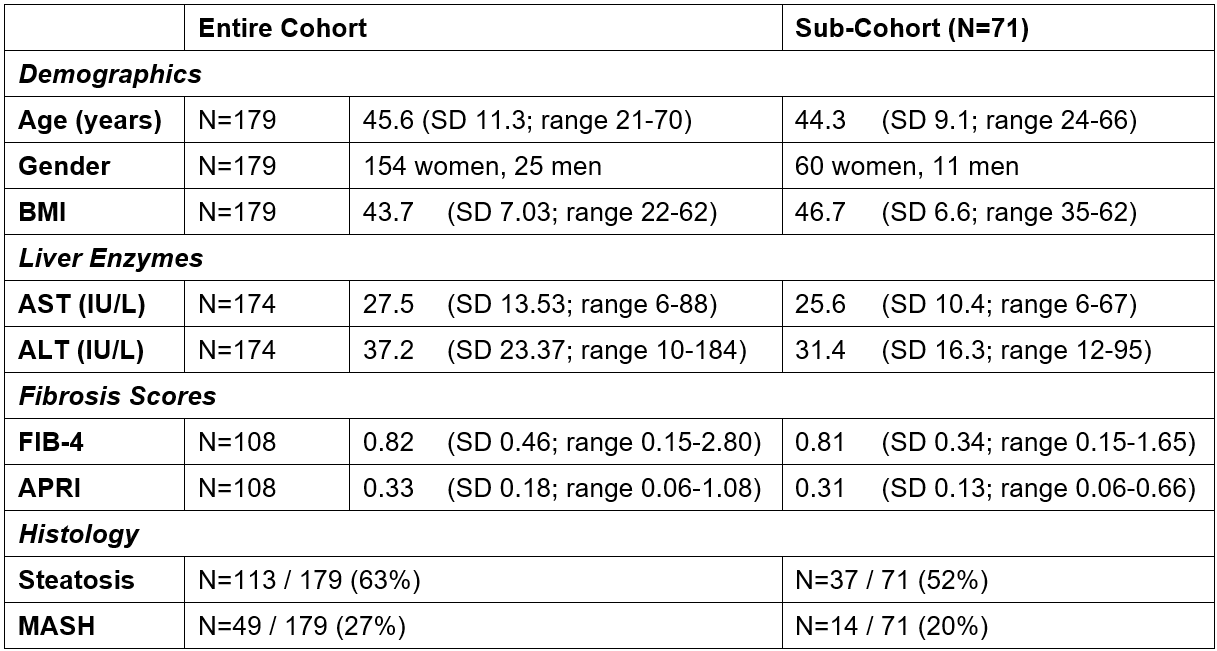
Table 1: Study cohort characteristics. The entire cohort contains all study participants with PDFF and histology data (cycles 1 and 2). The sub-cohort encompasses all study participants with complete sets of all investigated predictors including PDFF and cT1 (cycle 2). Out of all participants, 5 had no aminotransferase values and 71 had no platelet count for the calculation of fibrosis scores.
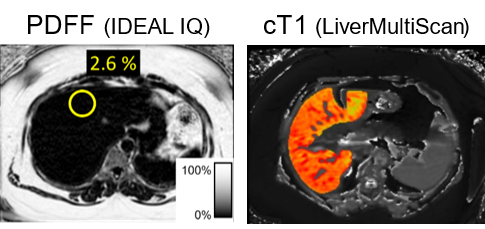
Figure 1: Representative chemical-shift encoded MRI (CSE-MRI) acquisitions at 3.0T. Shown is an example ROI in segment 4a of the liver. The largest possible ROI that avoids vessels, ducts, imaging artifacts, and the liver edges are placed in each liver segment. PDFF: MRI-based proton density fat fraction. cT1: corrected T1.
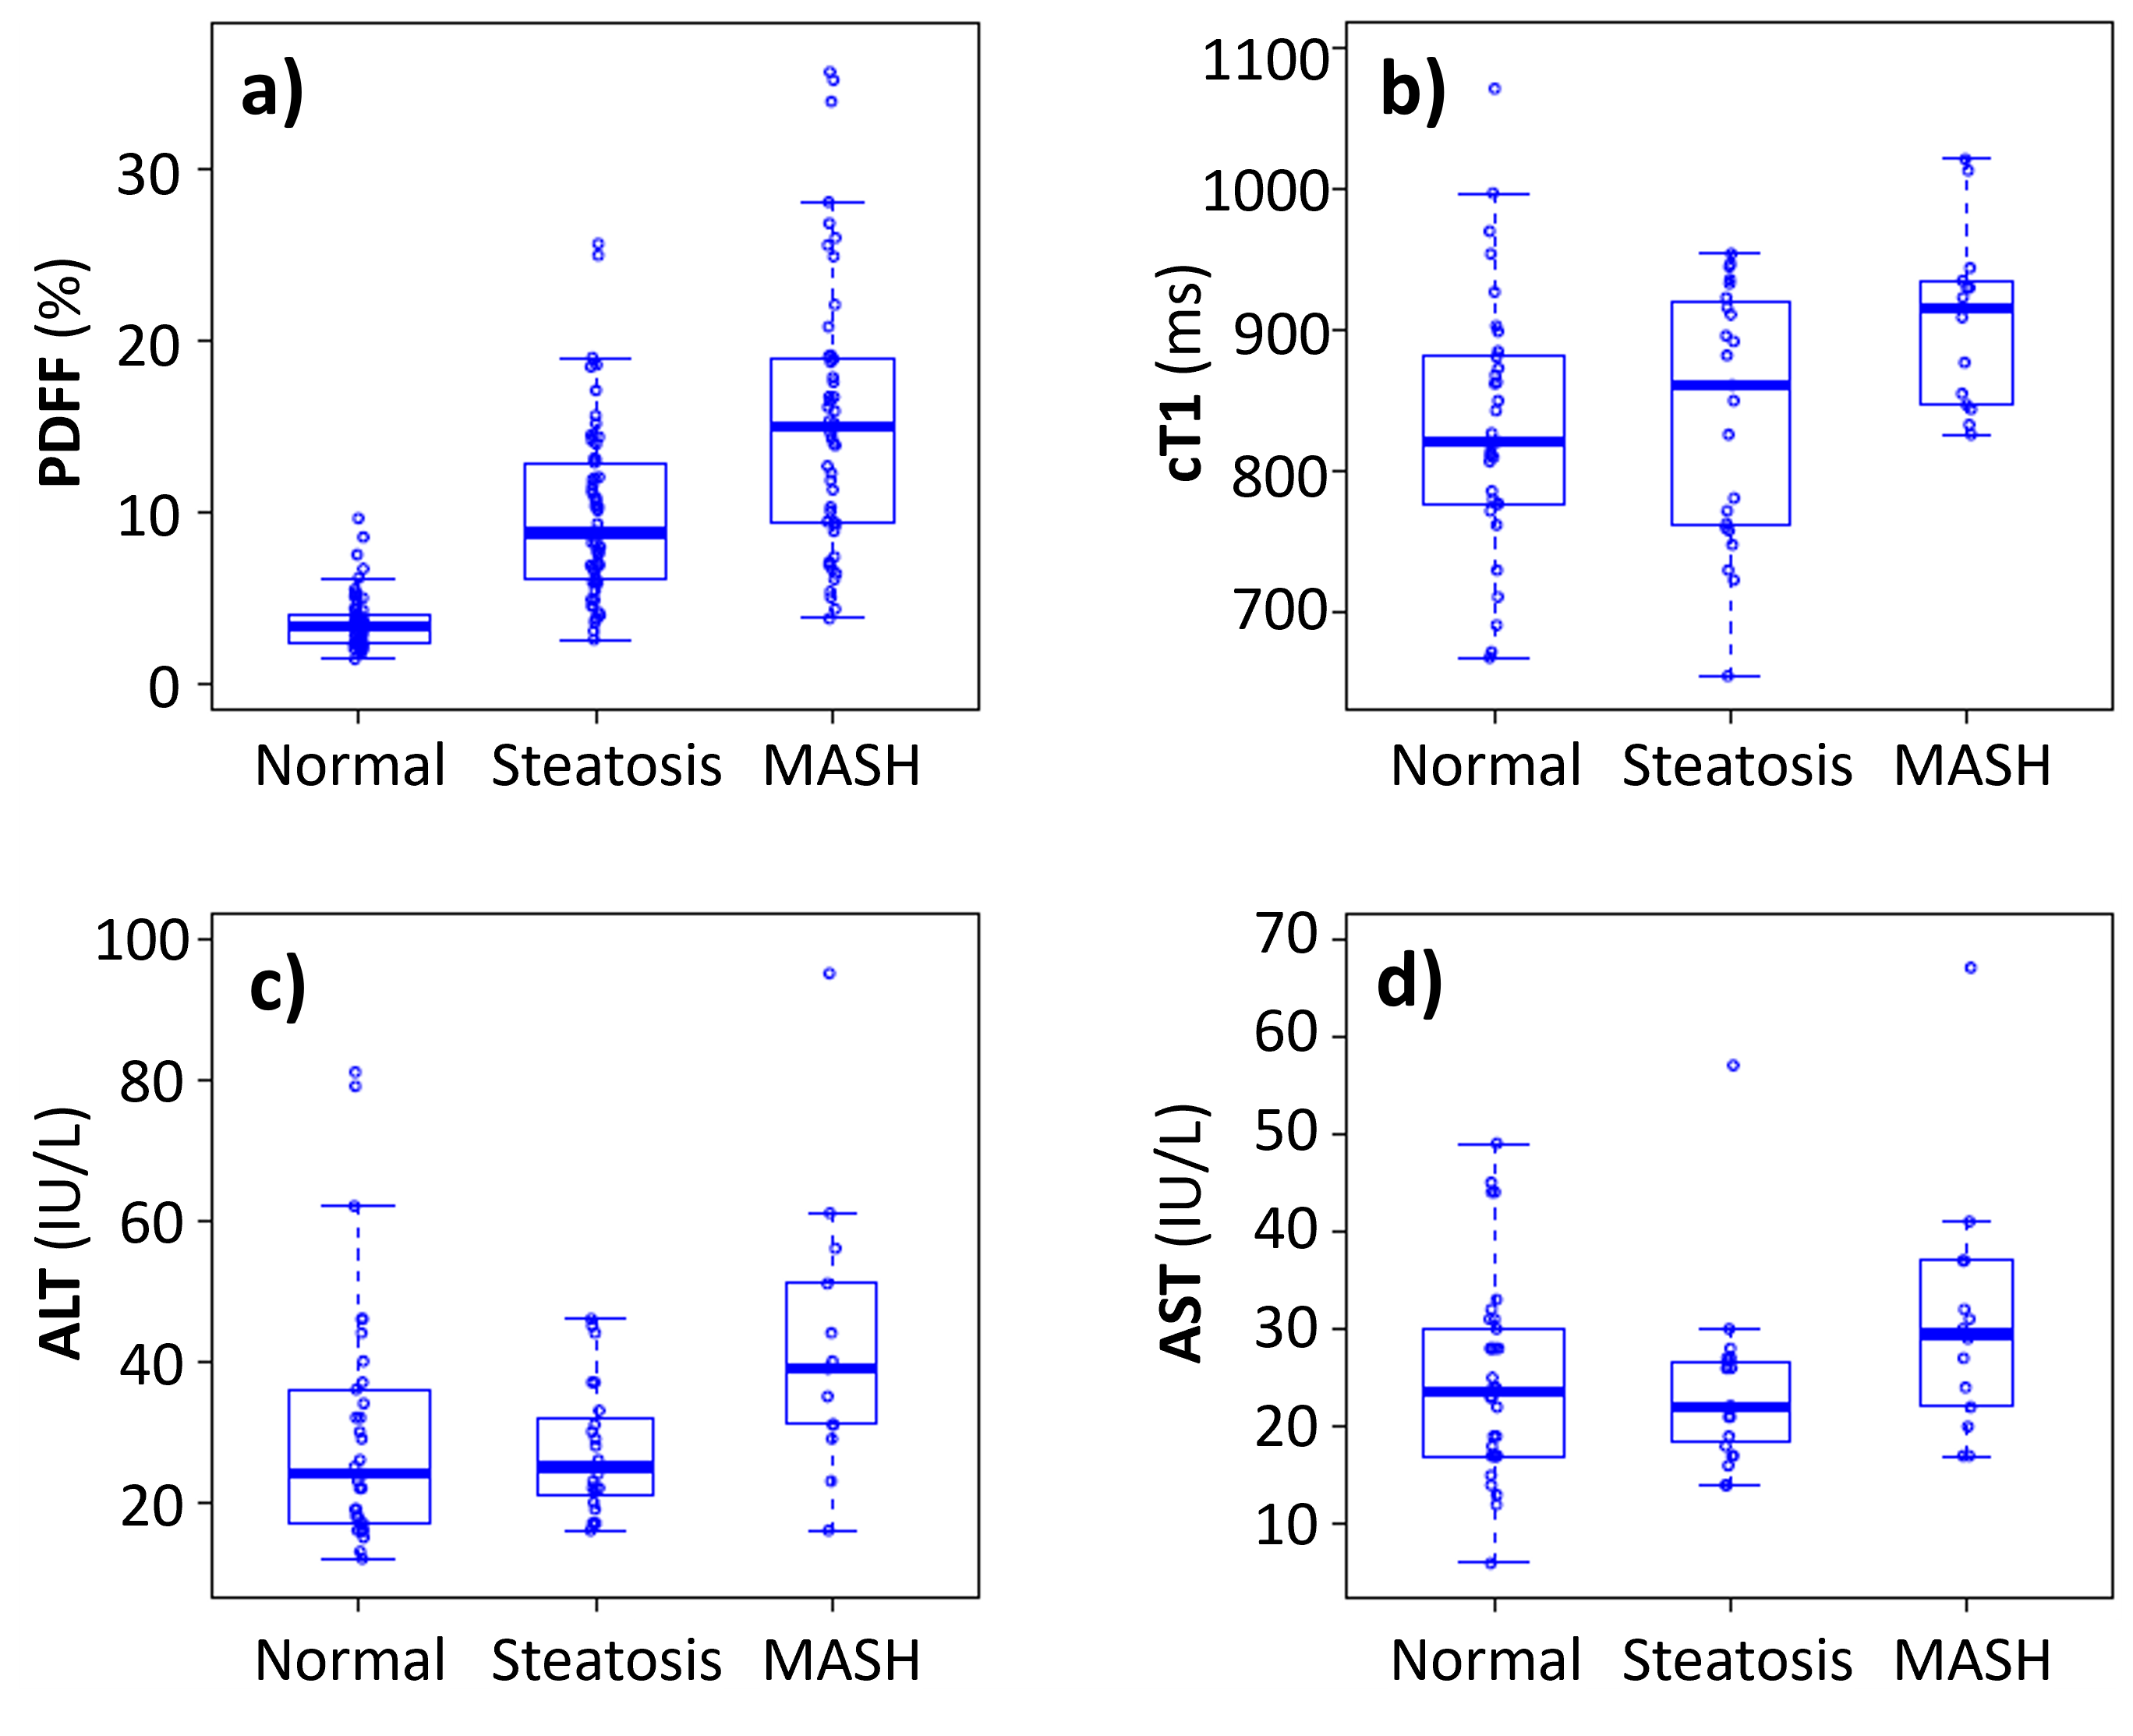
PDFF: MRI-based proton density fat fraction. cT1: corrected T1. Normal: no liver disease. Steatosis: isolated steatosis. MASH: metabolic dysfunction-associated steatohepatitis.
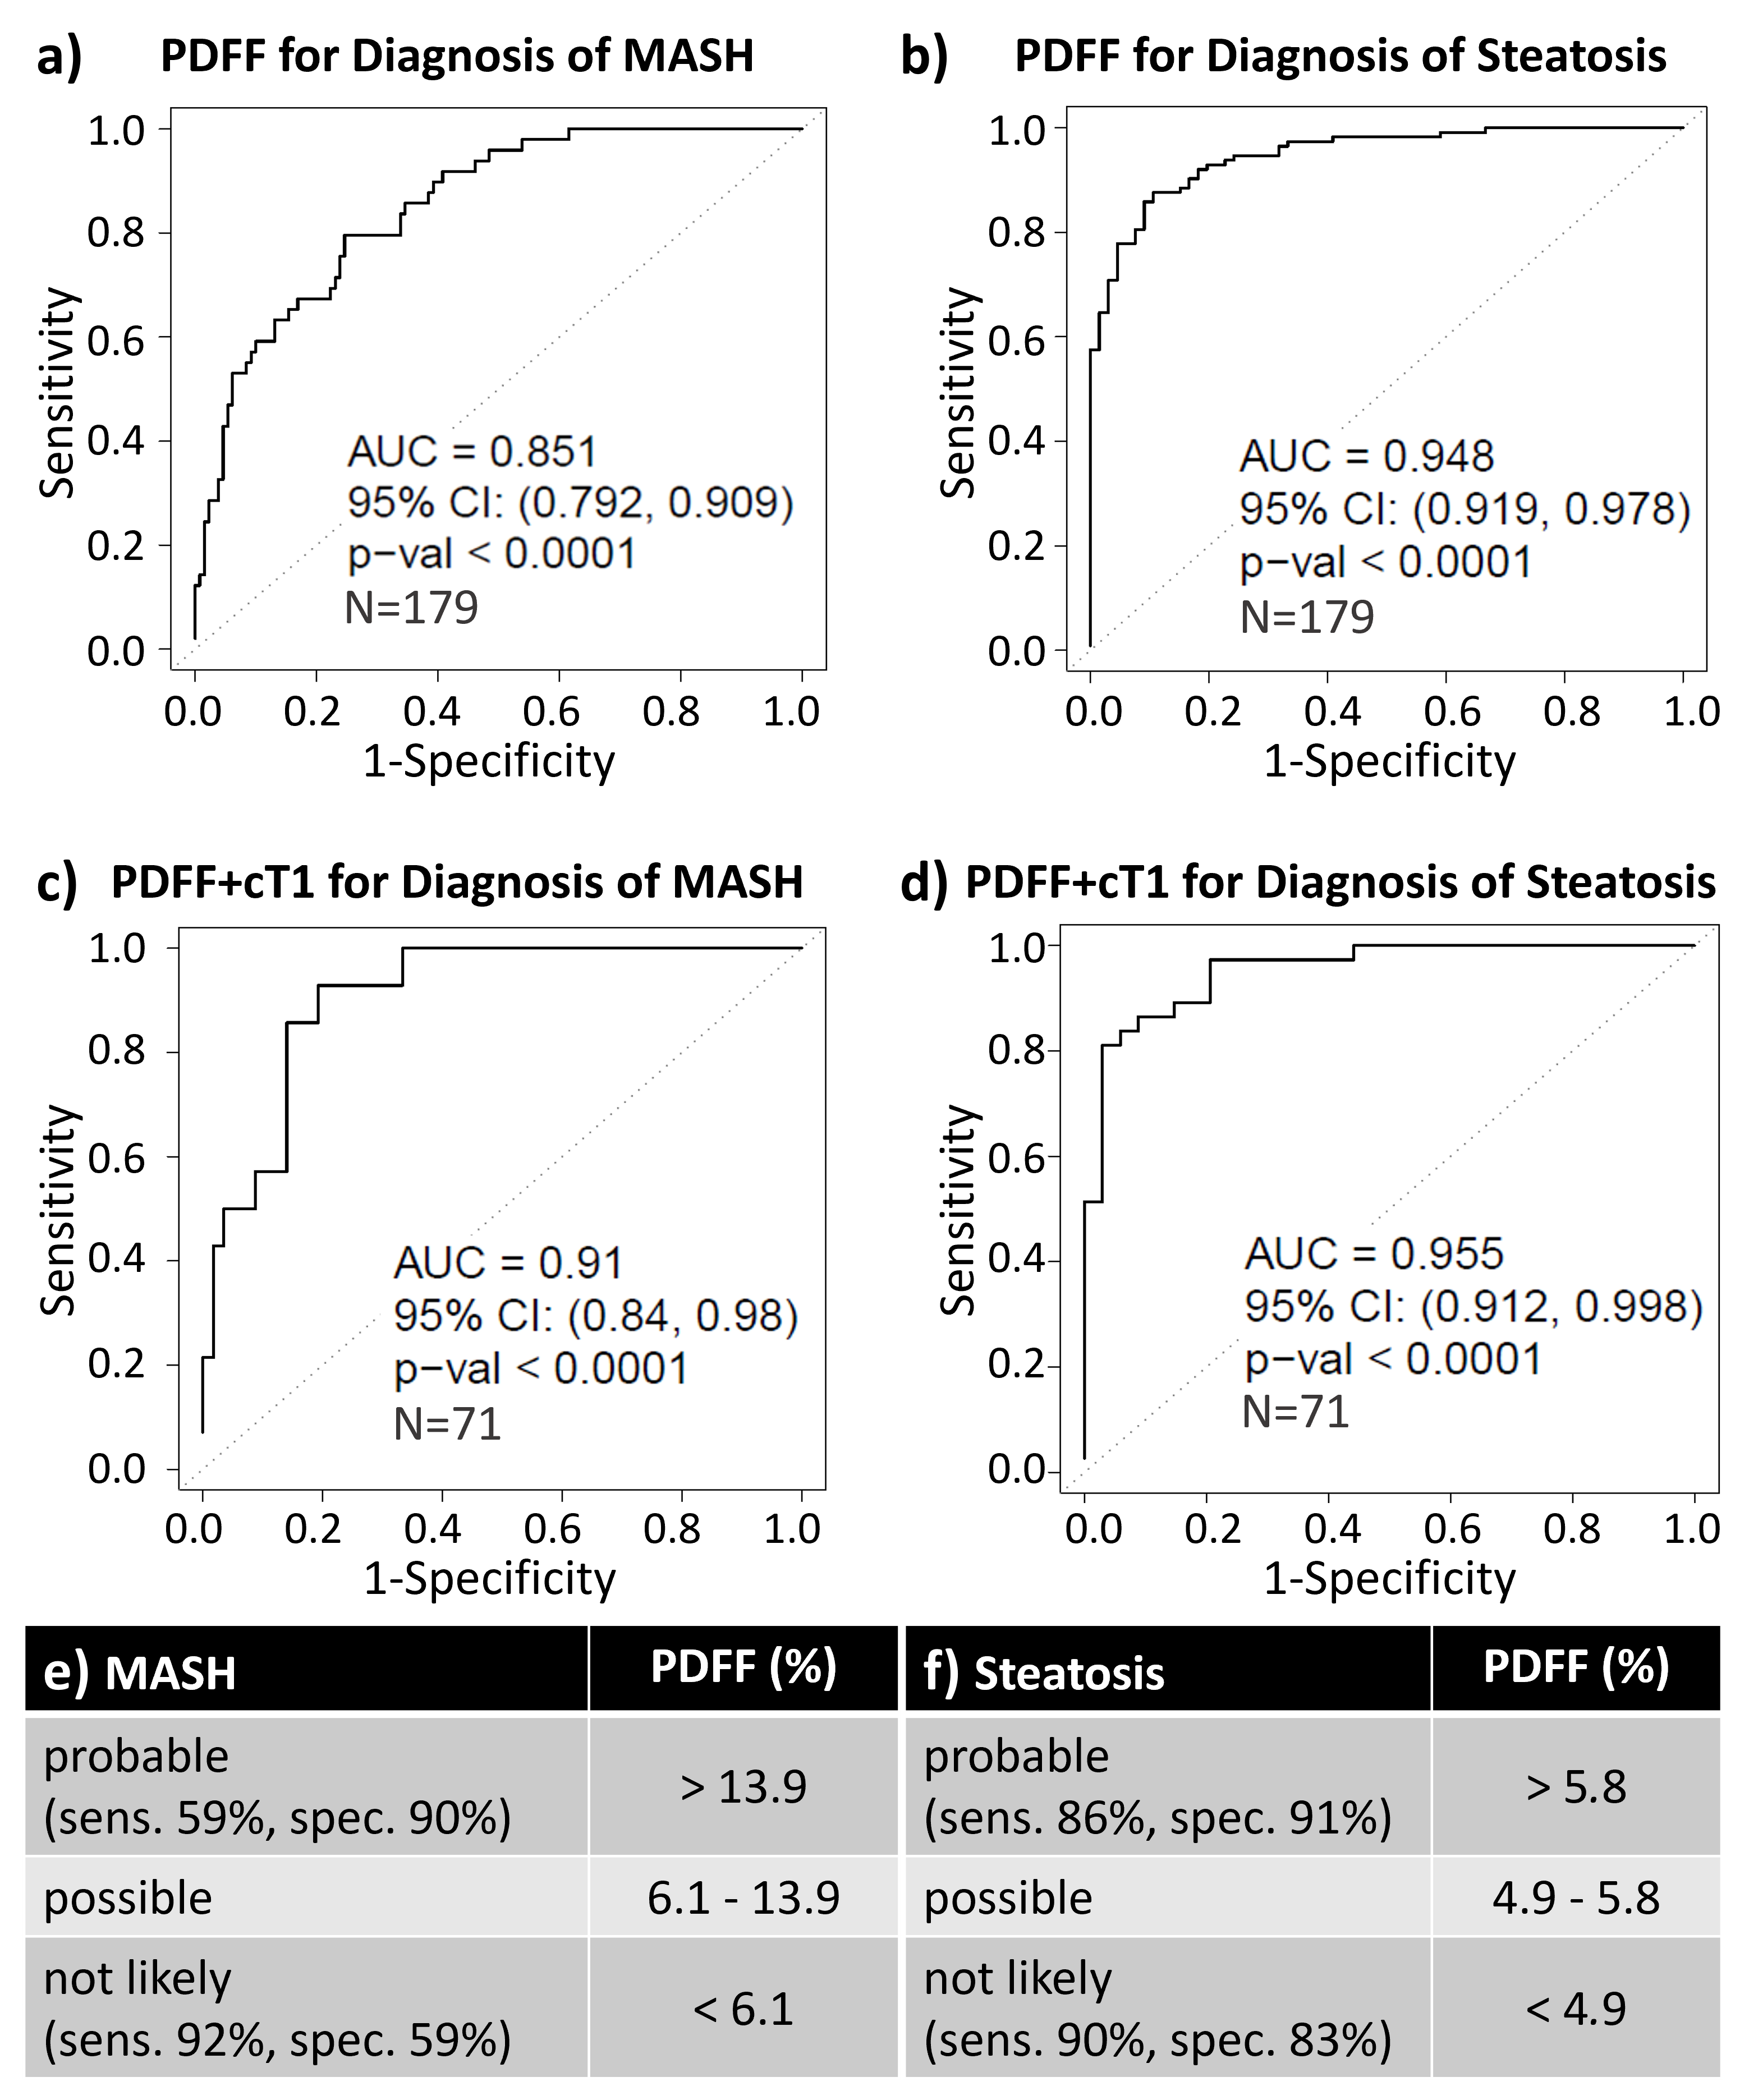
Figure 3: ROC-analysis showed excellent diagnostic performance of PDFF in discriminating a) MASH vs. non-MASH and b) steatosis vs. no steatosis in 179 study participants. c) & d) In the sub-cohort of 71 study participants with both PDFF and cT1 data, adding cT1 did not significantly improve performance for detection (see Table 2). Based on data from the entire cohort (N=179), we propose the following cutoffs for ‘probable’, ‘possible’, and ‘not likely’ diagnosis of e) MASH and f) hepatic steatosis.
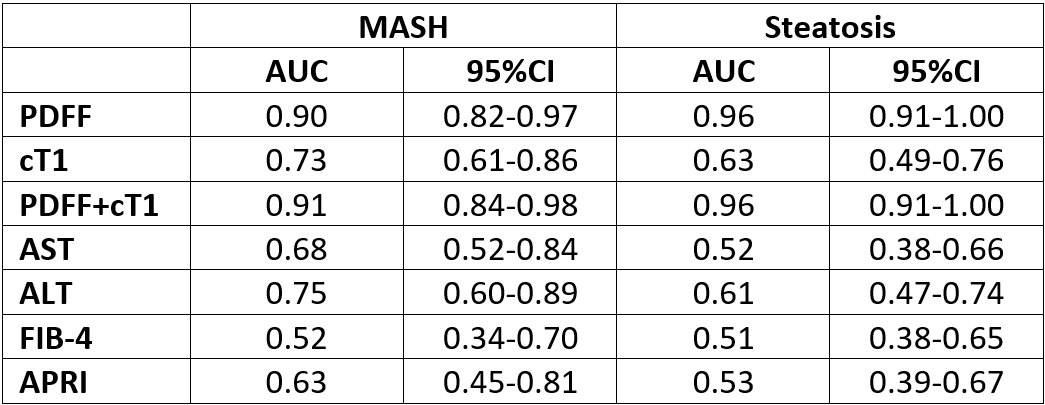
Table 2: Area under the curve (AUC) results for 71 cases with complete sets of predictors for the outcome of MASH and steatosis, demonstrated that PDFF had the best performance for both the diagnosis of MASH and detection of steatosis. Combining PDFF and cT1 did not significantly increase the AUC compared to PDFF alone. 95%CI: 95% confidence interval.