4745
3D Hepatic MR Elastography at 0.55T1School of Biomedical Engineering and Imaging Sciences, King's College London, London, United Kingdom, 2Siemens Healthineers AG, Erlangen, Germany
Synopsis
Keywords: Liver, Liver
Motivation: Expanding hepatic 3D MRE to wide-bore low field MR systems (B0 ≤ 1.0T) can serve as a means of accommodating liver patients with high BMI and/or claustrophobia such as metabolic dysfunction-associated fatty liver disease (MAFLD) patients.
Goal(s): Demonstrate the feasibility of 3D MRE at 0.55T in healthy volunteers.
Approach: 5 healthy volunteers were scanned at 60Hz mechanical excitation with a Hadamard-encoded 3D MRE sequence at 0.55T and were also scanned with a reference 3D MRE sequence at 3T for comparison.
Results: Bland-Altman analysis demonstrated good agreement between the biomechanical parameters retrieved at 0.55T and 3T.
Impact: We demonstrated the feasibility of hepatic 3D MRE at 0.55T in healthy volunteers, which paves the pathway for an MRE clinical study in MAFLD patients to evaluate clinical added value.
Introduction
Hepatic 3D MRE has shown promises for gauging liver fibrosis and inflammation using shear wave speed(Cs [m/s]) and loss modulus(G’’ [kPa]) respectively(1). However, to our knowledge, hepatic 3D MRE has been limited to high field MR systems(B0 ≥ 1.5T). Nonetheless, expanding hepatic 3D MRE to wide-bore low field MR systems(B0 ≤ 1.0T) can serve as a means of accommodating liver patients with high BMI and/or claustrophobia such as metabolic dysfunction-associated fatty liver disease(MAFLD) patients. MAFLD is a growing global healthy crisis and enabling access to 3D MRE for MAFLD patients is becoming of importance in the clinic(1,2).However, low field MR systems come with a penalty in signal-to-noise ratio(APPARENT-SNR) which is directly proportional to a penalty in phase-to-noise ratio(PNR) in 3D MRE(3). A Hadamard motion encoding scheme may be used for its inherent averaging property(4), thereby mitigating the decrease in PNR.
The aim of the present work is to demonstrate the feasibility of hepatic 3D MRE at 0.55T in healthy volunteer experiments.
Methods
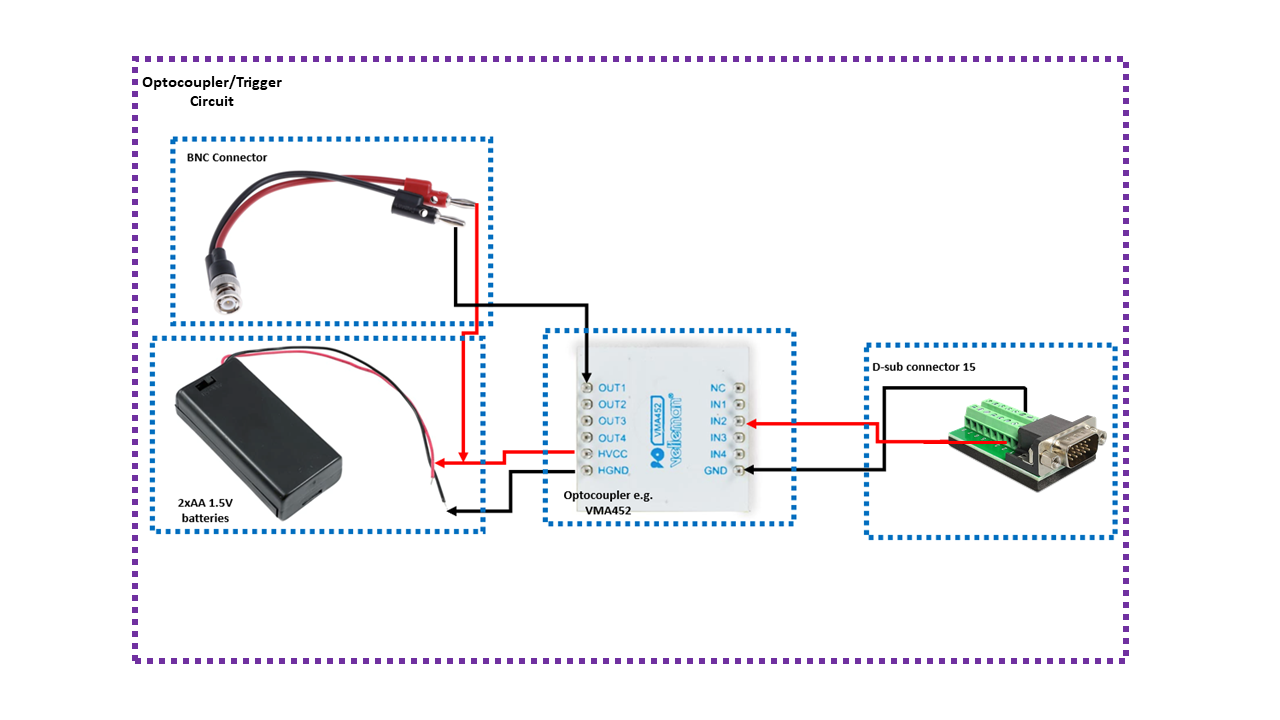
5 healthy volunteers were enrolled after signing informed consent and were scanned at 60Hz mechanical excitation using the gravitational transducer(5) with a 3D Ristretto MRE sequence(6) implemented on a 0.55T system(MAGNETOM Free.Max, Siemens Healthineers AG, Erlangen, Germany). The synchronization of the gravitational transducer with the 3D MRE sequence was achieved using transistor-transistor logic (TTL) signals sent by the 0.55T system where an optocoupler was used to maintain electrical isolation(Figure1).The imaging parameters of the multiple breath-hold hepatic 3D MRE sequence were as follows: 8 slices, 4mm isotropic resolution, a 96X64 acquisition matrix, flip angle=25°, in-plane GRAPPA acceleration factor of 2 resulting in a FOV of 386X256X32 mm3, TR=18.24ms, TE=12.90ms(in-phase condition at 0.55T), receiver bandwidth = 180 Hz/px. The motion encoding gradients followed a Hadamard encoding scheme(4) and had a duration of 6.7ms, an amplitude of 20 mT/m, and an encoding efficiency of 17.2 rad/mm. The total acquisition time was 84 seconds preformed in 4 breath-holds of 21 seconds each.
In addition, the 5 healthy volunteers underwent a hepatic 3D MRE scan on a 3T system(Biograph mMR, Siemens Healthineers AG, Erlangen, Germany) using a reference 3D MRE sequence(7) to compare the retrieved viscoelastic parameters on 0.55T with those retrieved on 3T. The imaging parameters at 3T were similar to those used at 0.55T, with the exception of TE(7.38 ms), TR(16.67ms), receiver bandwidth(700 Hz/px), and an unbalanced four-point motion encoding scheme.
Hadamard decoding was applied to the acquired MRE phase images prior to coil combination, and the obtained phase images were unwrapped. Afterwards, pixel-wise temporal Fourier transform was applied to extract the 3D displacement field and the magnitude of the shear modulus(|G*| [kPa]), Cs, G’’ were retrieved using the curl-operator method(8) and calculated by averaging the central 4 slices. Finally, apparent-SNR was estimated at 0.55T and 3T for one encoding step and one wave offset as the ratio of the mean value of the pixels in a region of interest in the liver and the standard deviation of the pixels in a region of interest in the background of the magnitude image.
Results
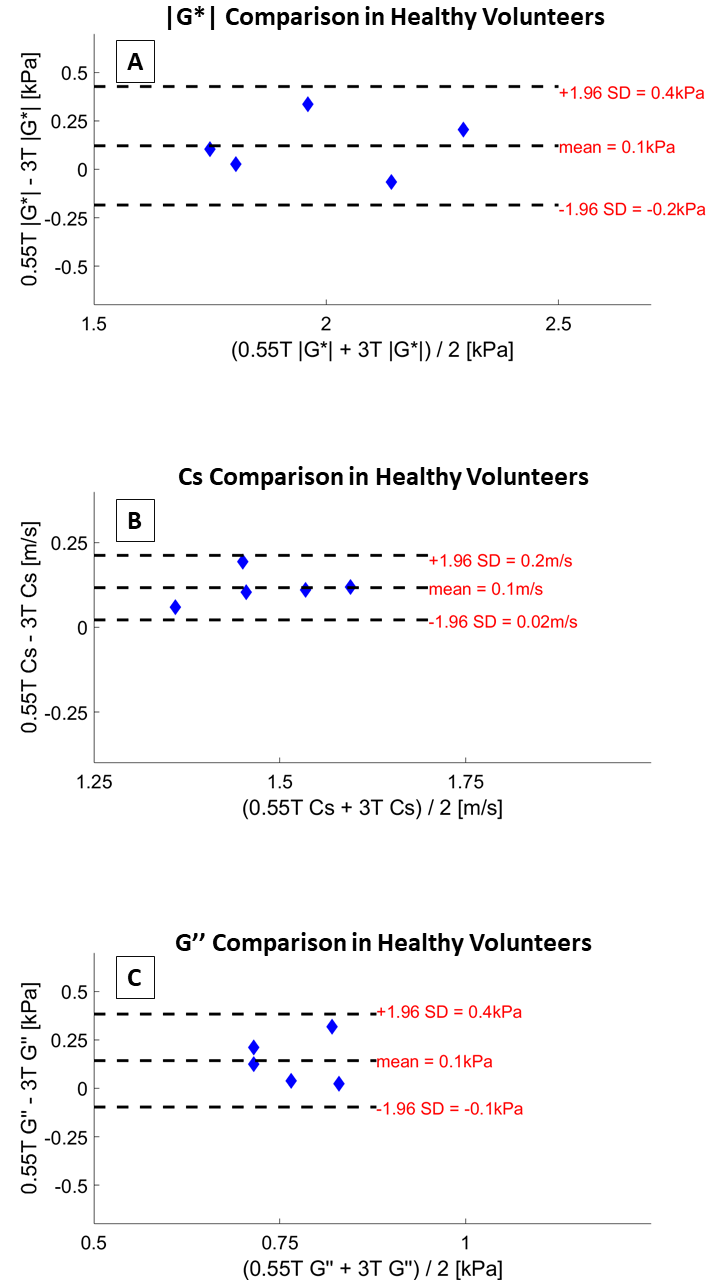
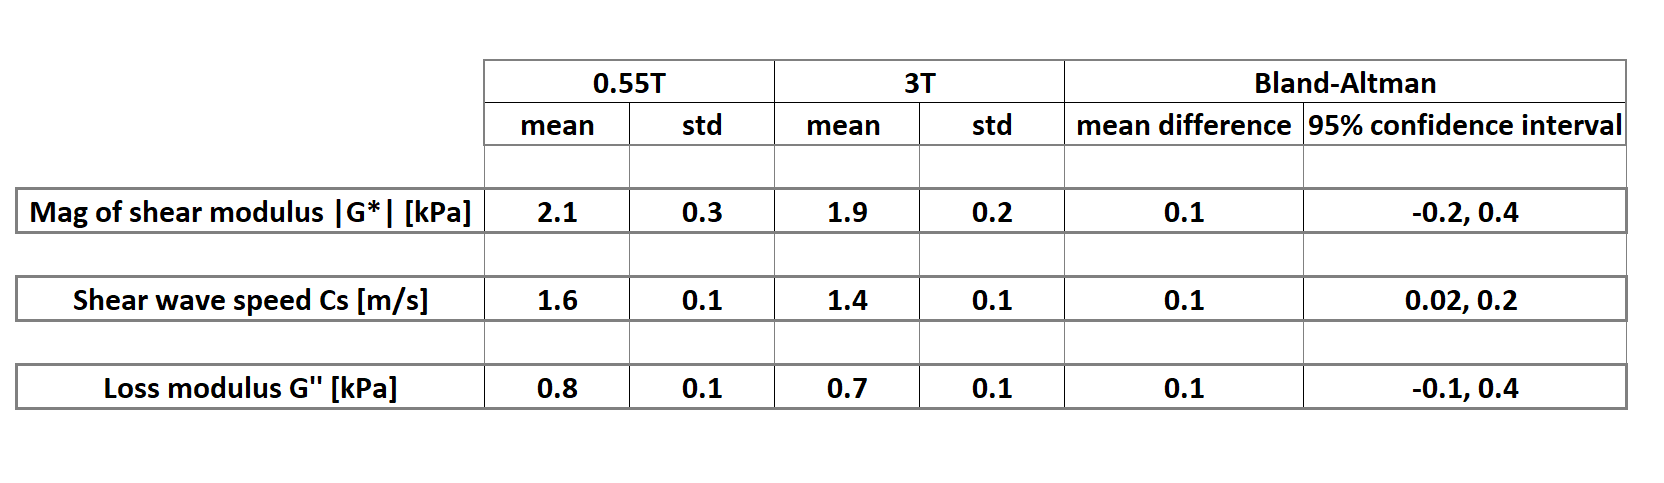
All 5 healthy volunteers underwent successful MR imaging, 3 females, and the mean age and BMI were 30.0±5.3 years, and 22.4±2.1 kg/m2 respectively.Bland-Altman plots of the agreement between 3D MRE at 0.55T and 3D MRE at 3T for the measurement of |G*|, Cs, and G’’ are shown in Figure2(A-C), suggesting good agreement between 3D MRE viscoelastic parameters at 0.55T and 3T. The mean values at 0.55T were 2.1±0.3kPa (|G*|), 1.6±0.1m/s (Cs), 0.8±0.1(G’’), and at 3T were 1.9±0.2kPa (|G*|), 1.6±0.1m/s (Cs), 0.7±0.1kPa(G’’) (Table1).
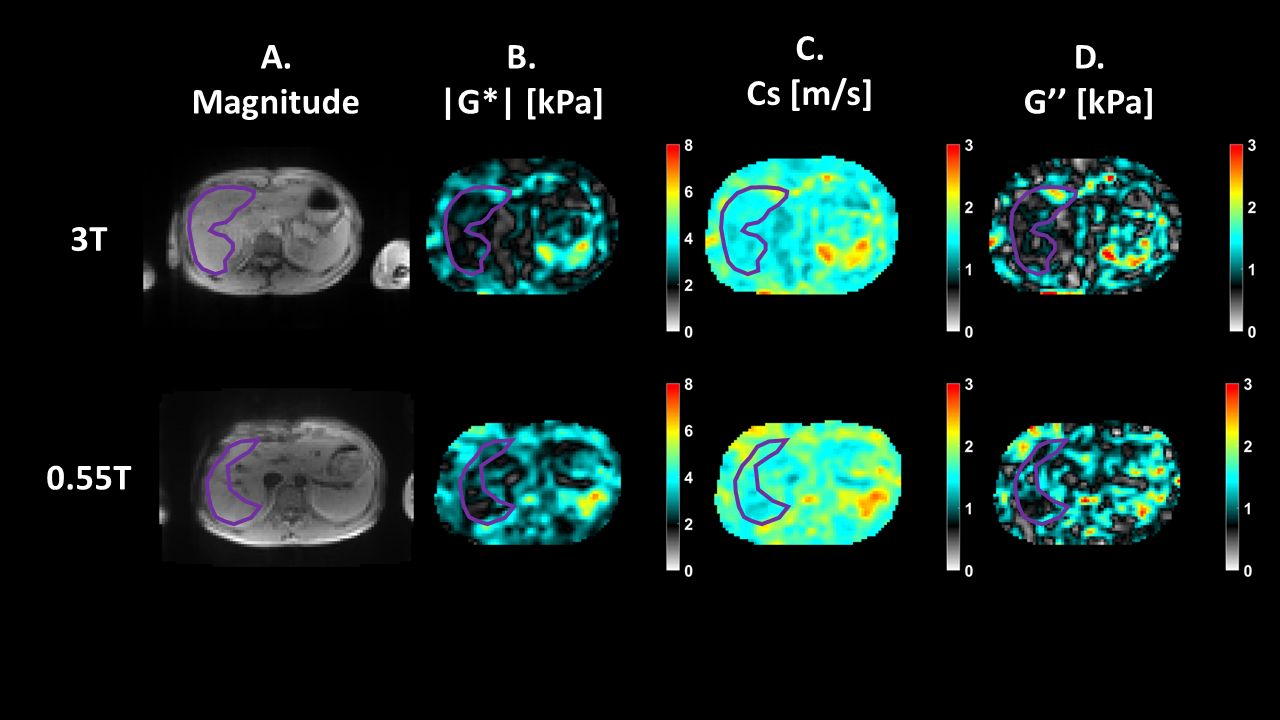
The MRE images obtained from a representative healthy volunteer at 0.55T and 3T are shown in Figure3.
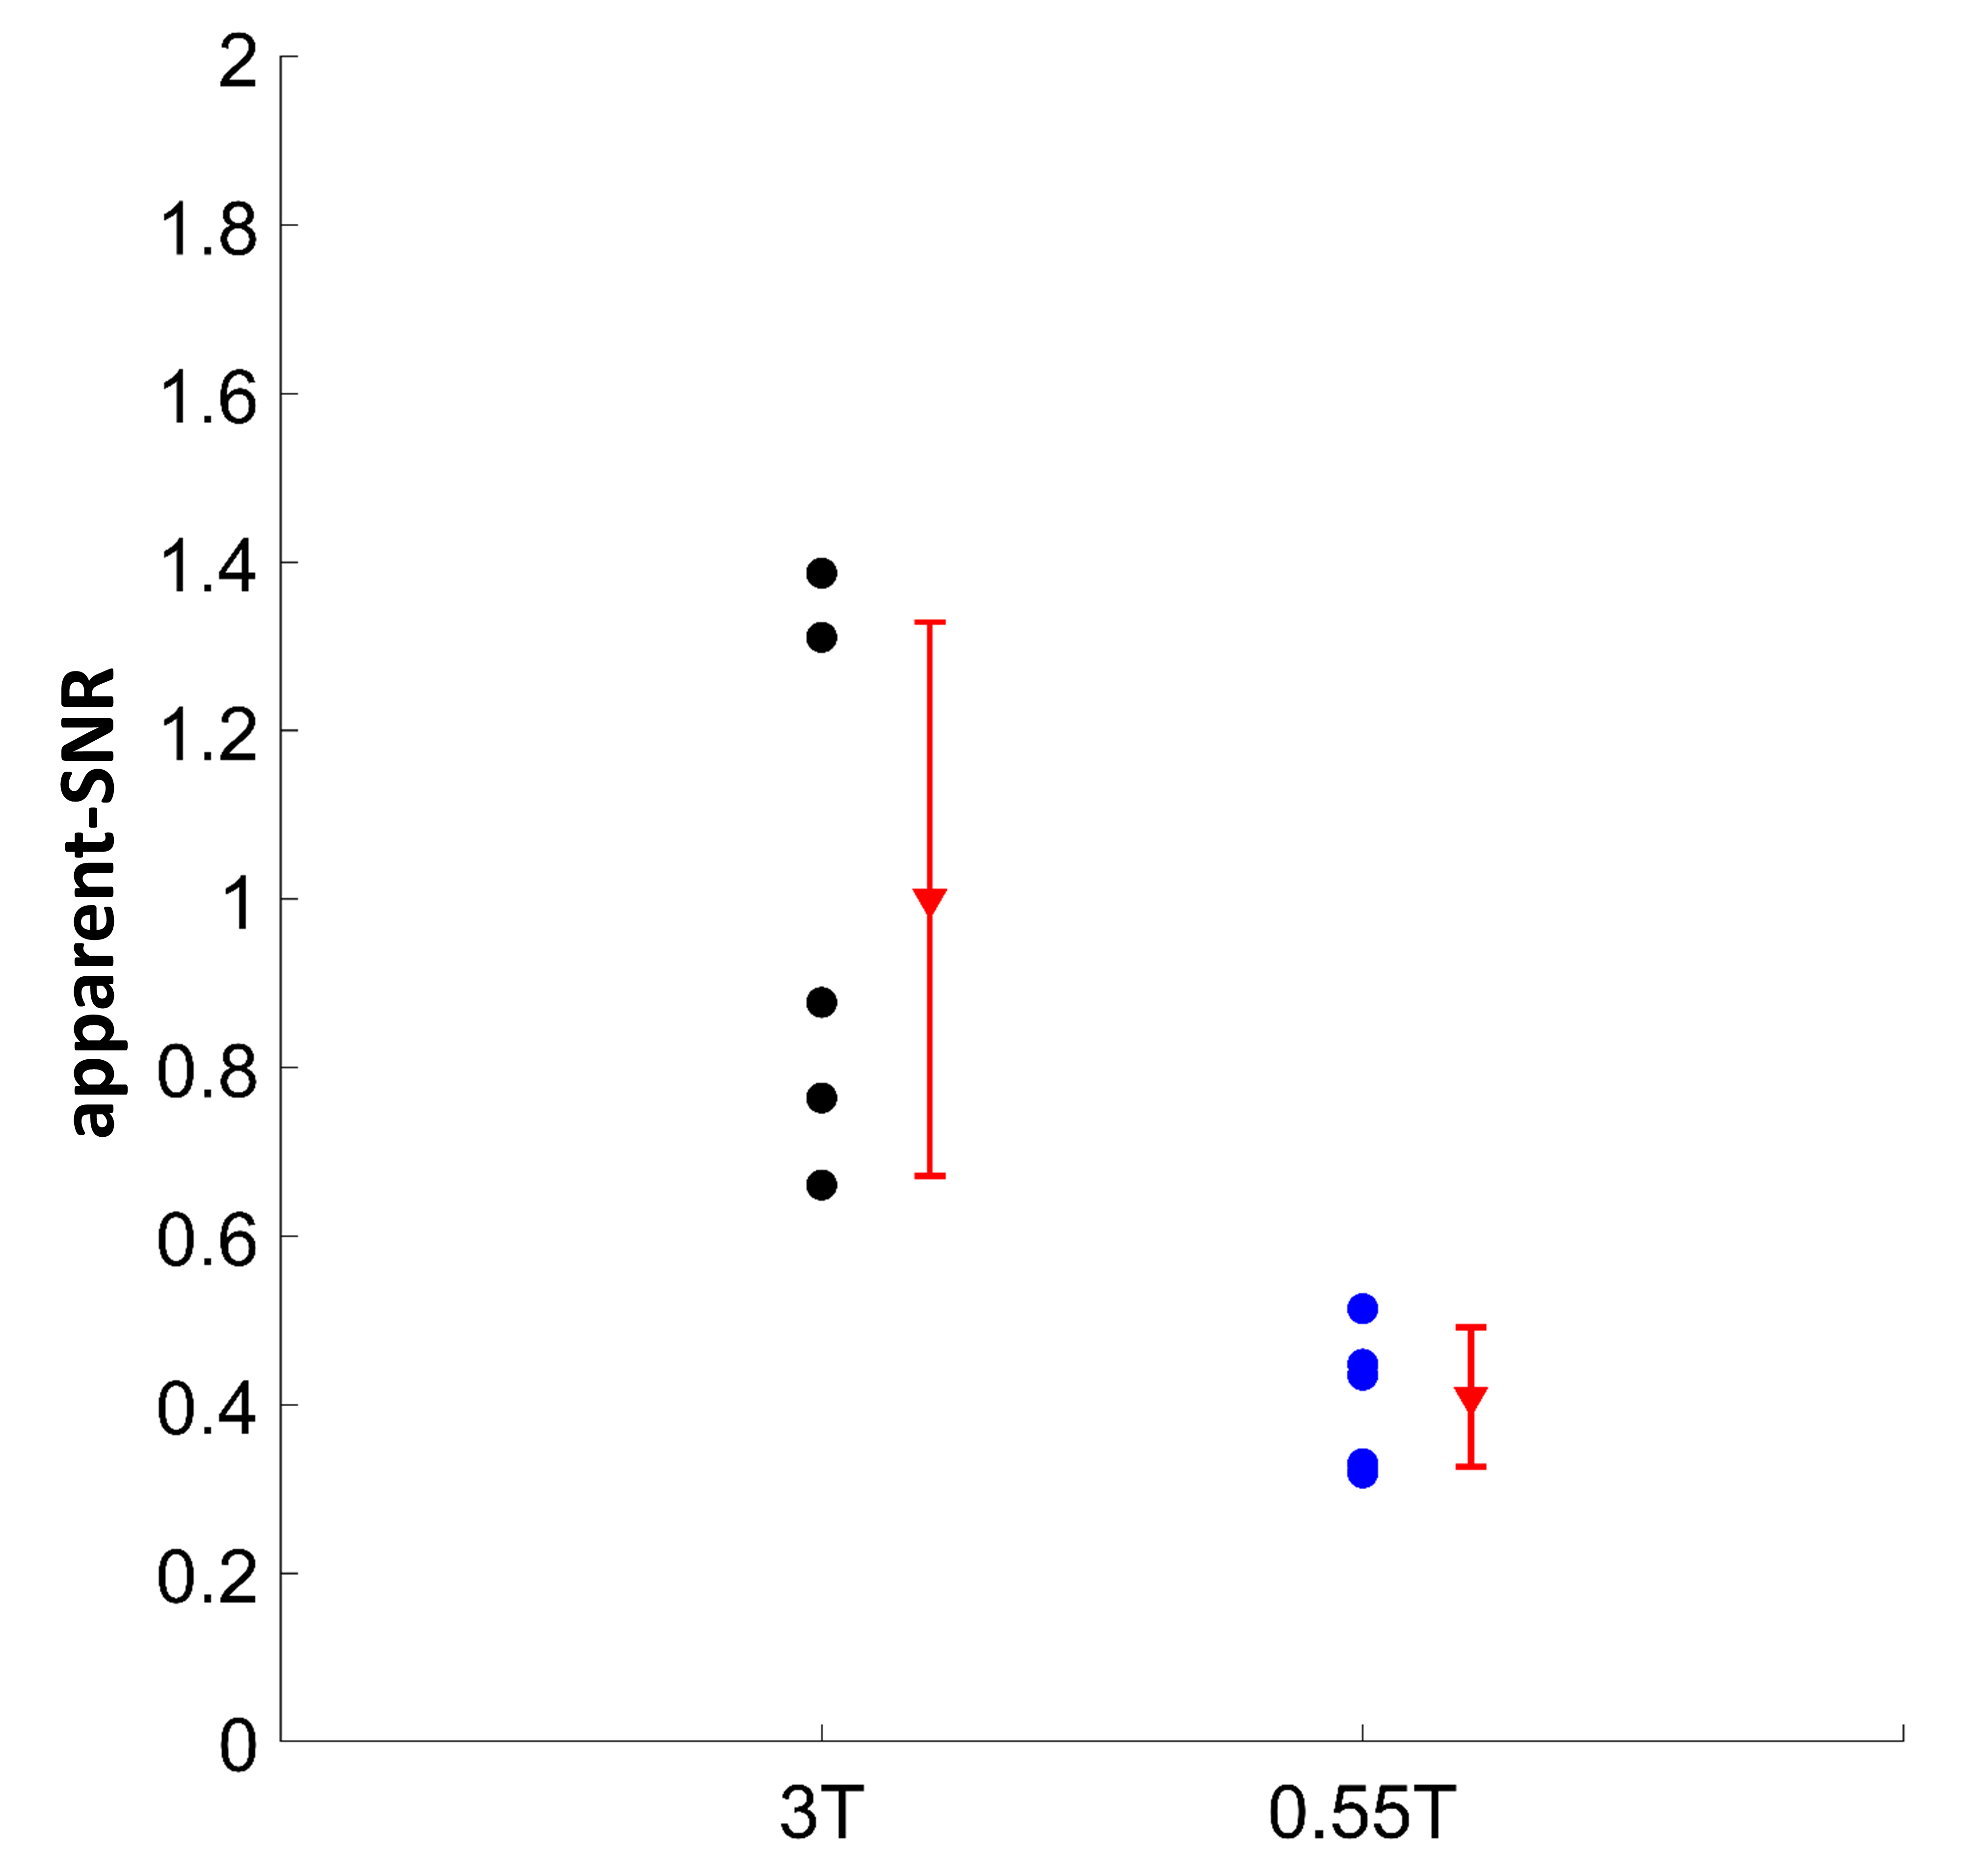
There was a 2.4-fold decrease in the apparent-SNR at 0.55T in comparison with 3T (mean relative apparent-SNR = 0.41 ± 0.08); and this decrease was statistically significant (t (8) = 3.9, P<0.005)(Figure4).
Discussion and conclusions
Despite the anticipated decrease in SNR at 0.55T in comparison with 3T, and therefore its impact on PNR(3), we used the inherent averaging of the Hadamard motion encoding scheme(4) to compensate the decrease in PNR at 0.55T, which did not compromise the quality of the retrieved biomechanical parameters. In addition, T1 relaxation times in the liver are shorter at 0.55T than at 3T(9) and we used a lower receiver bandwidth at 0.55T compared to 3T which may have mitigated the lower APPARENT-SNR and PNR associated with the lower static magnetic field.In conclusion, we have shown initial promising results of 3D hepatic MRE at 0.55T. A clinical study is warranted.
Acknowledgements
No acknowledgement found.References
1. Darwish OI, Gharib AM, Jeljeli S, et al. Single Breath-Hold 3-Dimensional Magnetic Resonance Elastography Depicts Liver Fibrosis and Inflammation in Obese Patients. Invest Radiol. Jun 1 2023;58(6):413-419. doi:10.1097/rli.0000000000000952
2. Lazarus JV, Colombo M, Cortez-Pinto H, et al. NAFLD — sounding the alarm on a silent epidemic. Nature Reviews Gastroenterology & Hepatology. 2020/07/01 2020;17(7):377-379. doi:10.1038/s41575-020-0315-7
3. Guenthner C, Kozerke S. Encoding and readout strategies in magnetic resonance elastography. NMR in Biomedicine. 2018;31(10):e3919. doi:https://doi.org/10.1002/nbm.3919
4. Guenthner C, Runge JH, Sinkus R, Kozerke S. Analysis and improvement of motion encoding in magnetic resonance elastography. NMR Biomed. May 2018;31(5):e3908. doi:10.1002/nbm.3908
5. Runge JH, Hoelzl SH, Sudakova J, et al. A novel magnetic resonance elastography transducer concept based on a rotational eccentric mass: preliminary experiences with the gravitational transducer. Phys Med Biol. Feb 6 2019;64(4):045007. doi:10.1088/1361-6560/aaf9f8
6. Guenthner C, Sethi S, Troelstra M, Dokumaci AS, Sinkus R, Kozerke S. Ristretto MRE: A generalized multi-shot GRE-MRE sequence. NMR Biomed. May 2019;32(5):e4049. doi:10.1002/nbm.4049
7. Garteiser P, Sahebjavaher RS, Ter Beek LC, et al. Rapid acquisition of multifrequency, multislice and multidirectional MR elastography data with a fractionally encoded gradient echo sequence. NMR Biomed. Oct 2013;26(10):1326-35. doi:10.1002/nbm.2958
8. Sinkus R, Tanter M, Xydeas T, Catheline S, Bercoff J, Fink M. Viscoelastic shear properties of in vivo breast lesions measured by MR elastography. Magn Reson Imaging. Feb 2005;23(2):159-65. doi:10.1016/j.mri.2004.11.060
9. Brown RW, Cheng YCN, Haacke EM, Thompson MR, Venkatesan R. Magnetic Resonance Imaging: Physical Principles and Sequence Design. Wiley; 2014.
Figures