4744
Assessment of Hepatic Fat Content and Prediction of Myocardial Fibrosis in Athletes by using Proton Density Fat Fraction Sequence1The Affiliated Hospital of Southwest Medical University, Luzhou, China, 2Department of Radiology,, The Affiliated Hospital of Southwest Medical University, Luzhou, China, 3Chongqing Cancer Hospital, Chongqing, China, 4Department of Clinical Science, Philips Healthcare, Chengdu, China
Synopsis
Keywords: Liver, Liver
Motivation: Exploring changes in liver fat content in athletes and its role in predicting late gadolinium enhancement (LGE) of myocardium
Goal(s): To use magnetic resonance imaging-proton density fat fraction(MRI-PDFF) for the quantization of the liver fat content and prediction of LGE in athletes.
Approach: Recruitment of athletes and controls for cardiac magnetic resonance(CMR) examination, analysis of liver fat content using MRI-PDFF, and application of logistic regression to construct predictive models for LGE.
Results: The liver fat content and mean liver fat fraction were altered in athletes compared with controls. Hepatic fat content can effectively predict LGE after excessive exercise.
Impact: The study advanced sports cardiology by identifying hepatic fat content as emerging indicators for predicting LGE in athletes, enhancing training strategies and early detection of myocardial fibrosis.
Introduction
Excessive exercise could lead to cardiac damage such as myocardial fibrosis, which presents as a “U” shape in the correlation between exercise and cardiovascular health[1]. As the heart and liver are closely connected with each other[2], change in liver fat content is an early indicator of some liver diseases and is also important for body metabolism.How the liver fat content responds to exercise in terms of body health or cardiovascular events remains unclear. Whether the reduction in liver fat content is beneficial or not, similar to what occurs in the cardiovascular system by exercise, is uncertain. So we need to assess the characteristics of liver fat content in athletes.magnetic resonance imaging-proton density fat fraction(MRI-PDFF) can accurately and repeatably quantitatively evaluate the liver fat for the whole liver.This study aimed to explore the benefits and risks to the liver and heart based on the reduced liver fat content caused by exercise. Moreover, the model to predict late gadolinium enhancement (LGE) is constructed based on the liver fat content. Determining the cutoff time of exercises and predicting the future occurrence of LGE may provide useful suggestions for subsequent exercise programs.Methods
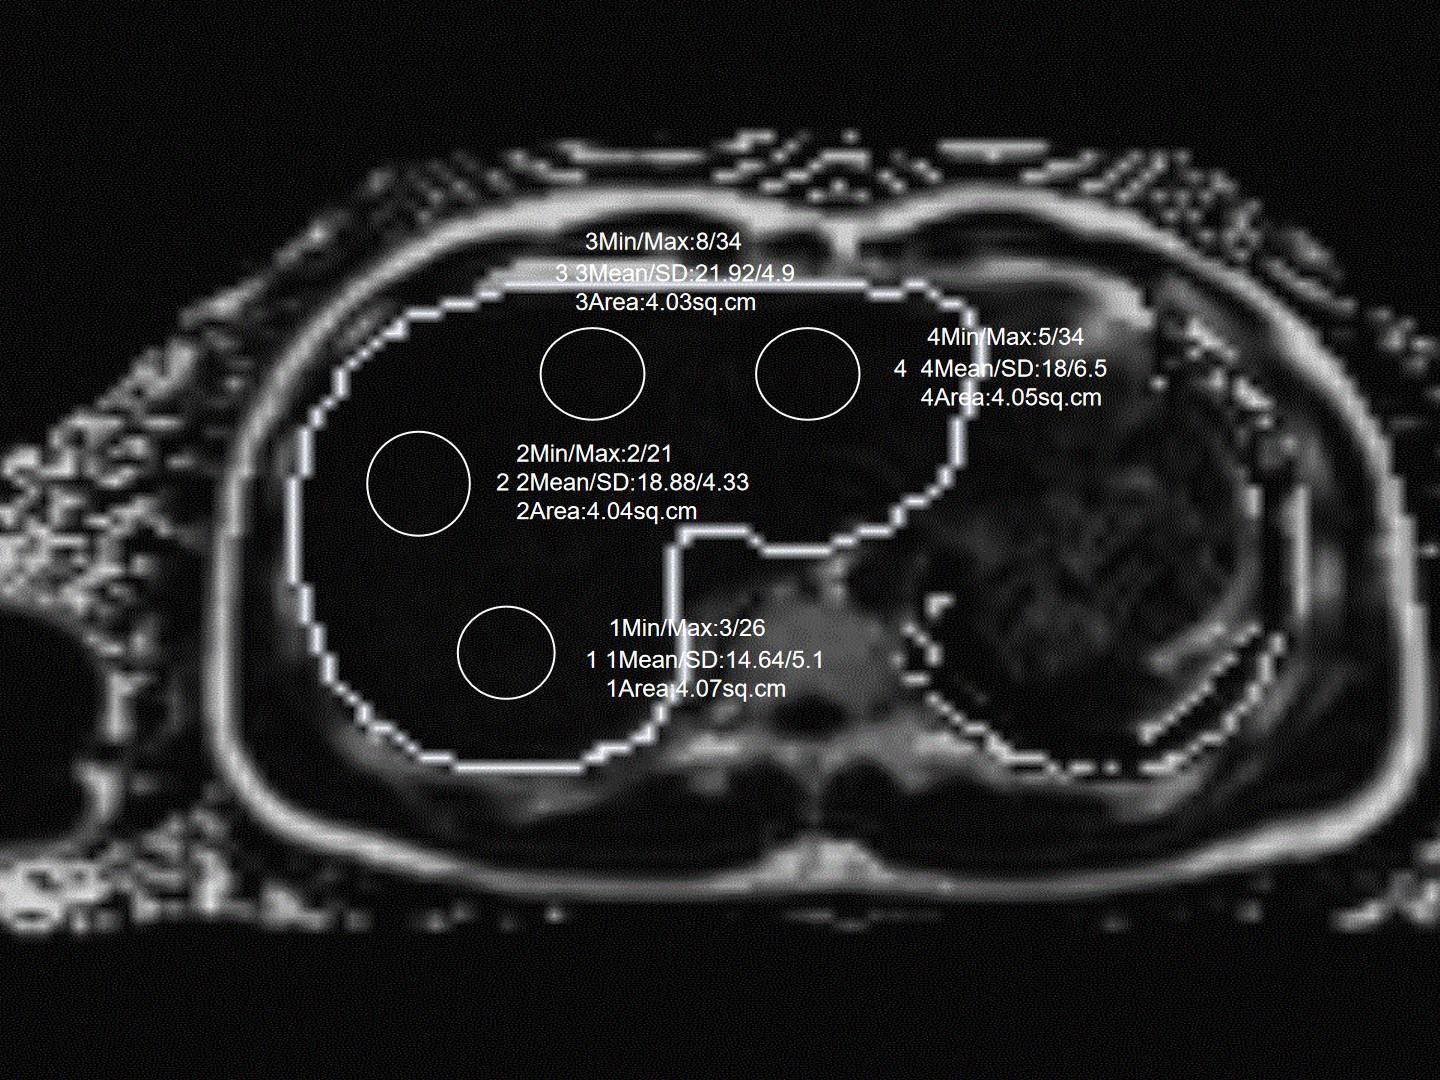
193 exercisers and 18 healthy sedentary volunteers were collected as the control group in this study. All the participants underwent 3.0 T MRI scan (Siemens Healthineers, Prisma, Eriangen, Germany) with a body coil of 18 channels. The sequence and parameters of MRI-PDFF liver scanning were as follows: True fast imaging with steady precession (true-FISP) was used to prospectively conduct conventional positioning images in transverse, sagittal, and coronal positions. The imaging parameters were Fov =450 mm × 393 mm, resolution=160 × 112, TR=9.00 ms, TE=1.05 ms, flip angle=4.0°, average=1, slice thickness=3.0 mm, slice spacing=0.6 mm, and bandwidth=1040.The scanning parameters of cardiac cine scanning were as follows: TR=66.2 ms, TE=1.46 ms, layer thickness=6 mm, layer spacing=1 mm, and vision 340×270 mm2 .Cardiac delayed-enhanced scanning was voluntarily performed 10 min after intravenous injection of 0.1 mmol/kg and 3 ml/s gadolinium. The scanning parameters were TR=929.4 ms, TE=1.24 ms, layer thickness=6 mm, layer spacing=1.2 mm, field of vision 340×270 mm2 , and a 256×186 matrix.All liver fat content maps of amateur athletes were transmitted and determined in the post-processing workstation (SyngoVia, Siemens Healthineers, Erlangen, Germany). The use of the ROI 4 (≥4 cm2 ) paradigm (anterior, posterior, medial, and lateral) was preferred in this study to provide the ROI’s liver fat content(Figure 1). The relationship among the liver fat content, cardiac function, blood index and basic clinical parameters,the prediction model for LGE were analyzed by the statistical software R (R 4.1.2 Core Team 2020, Vienna, Austria).Results
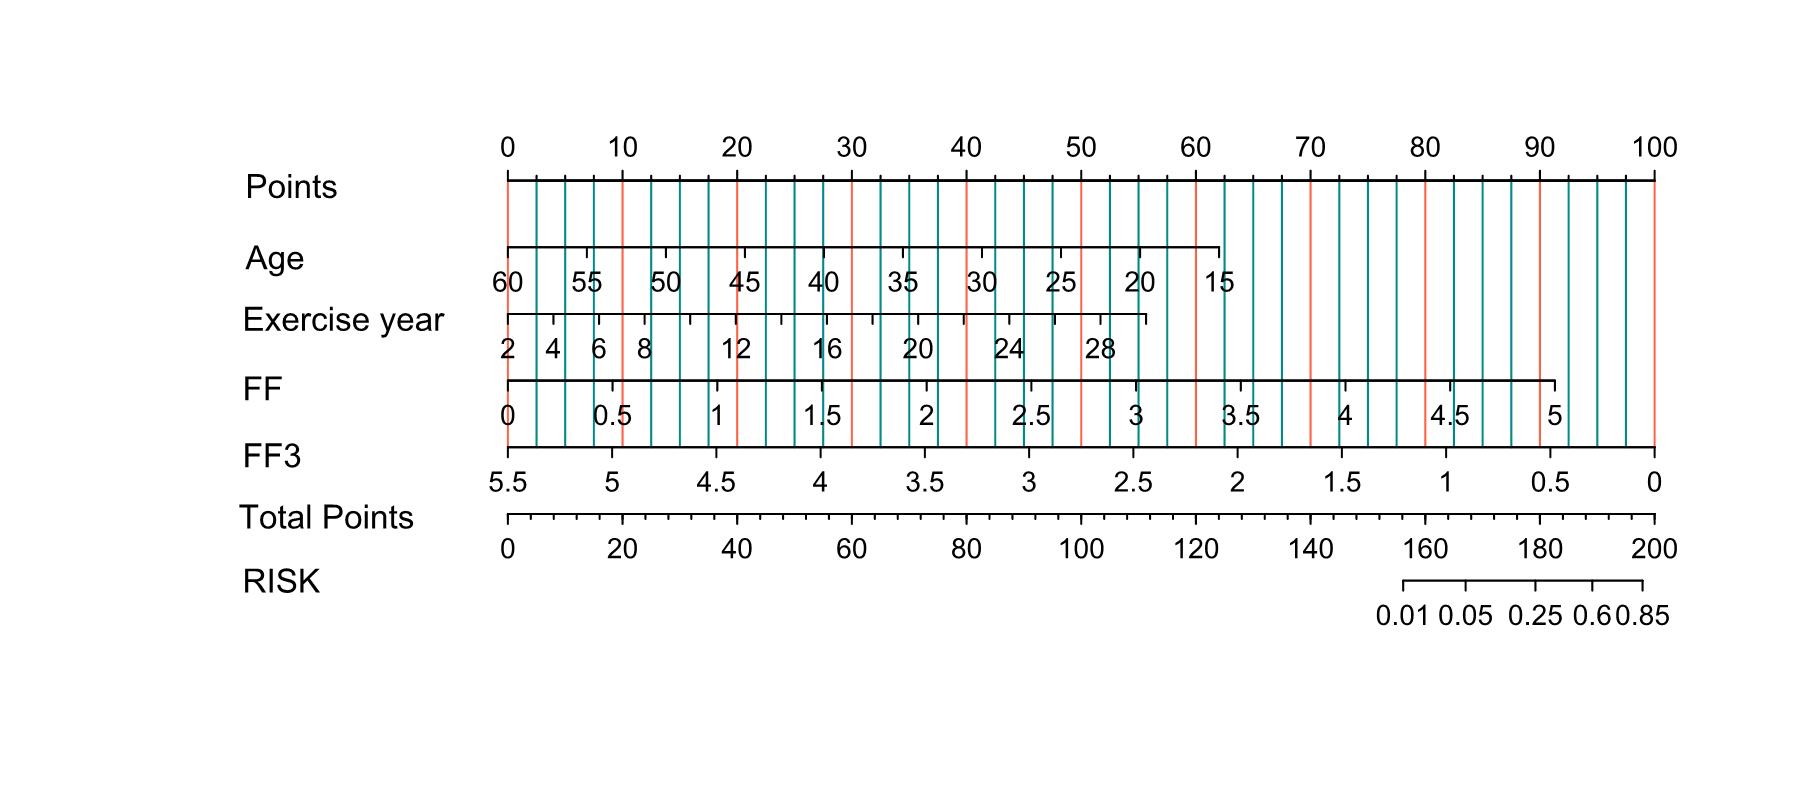
There were significant differences for the values of ROI 1, ROI 3, ROI 4, and FF between athletes and controls. The cutoff total exercise time for inducing a change in the liver fat content was 1680 h. Blood indexes, cardiac function, and basic clinical parameters were related to liver fat content . Age, years of exercise, FF value, and ROI 3 were four risk factors for predicting LGE in athlete.Discussion
Our results support the role of exercise as an independent intervention factor in fat content.Excessive triglyceride deposition, lipid peroxidation, and peroxide formation in the liver cause liver inflammation. The increase of inflammatory factors is an important pathophysiological mechanism of hepatocyte injury and destruction, which leads to changes in the serum liver enzyme level[3]. FF is one predictor for LGE. The reason for this is that excessive deposition of liver fat content can promote the production of procoagulant factors, pro-inflammatory factors, pro-oxidant molecules and regulatory factors of promoting fibrogenesis, so as to accelerate the formation process of cardiac fibrosis and even heart disease[4, 5]. Regarding the predictive ability of ROI 3, the lower the fat content is in the liver, the more likely is the development of cardiac fibrosis. This is contrary to the FF, because the liver fat content of ROI 3 is mainly representative of the left medial lobe of the liver, which may be the most sensitive region to assess changes in fat content compared with other ROIs, as there are Sappey veins with extra blood supply in this region in addition to the other normal liver blood supply[6, 7].Conclusion
Exercise could lead to a decrease in liver fat content, which was found to occur with exercise over a specific amount of time and may be related to the myocardium LGE. MRI-PDFF could successfully assess liver fat content and predict myocardial LGE in athletes,which assist with risk stratification and suggestion of the frequency of followup for exercisers.Acknowledgements
None.References
[1] Merghani A, Malhotra A, Sharma S. The U-shaped relationship between exercise and cardiac morbidity. Trends Cardiovasc Med. 2016. 26(3): 232-40.
[2] Lee YH, Kim KJ, Yoo ME, et al. Association of non-alcoholic steatohepatitis with subclinical myocardial dysfunction in non-cirrhotic patients. J Hepatol. 2018. 68(4): 764-772.
[3] Maximos M, Bril F, Portillo Sanchez P, et al. The role of liver fat and insulin resistance as determinants of plasma aminotransferase elevation in nonalcoholic fatty liver disease. Hepatology. 2015. 61(1): 153-60.
[4] Lauridsen BK, Stender S, Kristensen TS, et al. Liver fat content, non-alcoholic fatty liver disease, and ischaemic heart disease: Mendelian randomization and meta-analysis of 279 013 individuals. Eur Heart J. 2018. 39(5): 385-393.
[5] Ma J, Hwang SJ, Pedley A, et al. Bi-directional analysis between fatty liver and cardiovascular disease risk factors. J Hepatol. 2017. 66(2): 390-397.
[6] Gordionok DM, Denisov SD. Caval-portal anastomosis via Sappey superior veins with pseudolesion in segment IV a of the liver: a case report. Surg Radiol Anat. 2020. 42(12): 1421-1423.
[7] Wang D, Meng LP, Li WB, Li YH. Pseudolesions on clinical imaging caused by Sappey veins: a dynamic contrast magnetic resonance and Doppler study. J Comput Assist Tomogr. 2013. 37(2): 149-53.
Figures