4742
Repeatability and Reproducibility of Pancreatic Proton Density Fat Fraction Measurements Using Manually Drawn Regions of Interest1Departments of 1Radiology and Biomedical Imaging, UCSF, SF, CA, United States, 2Medicine, UCSF, SF, CA, United States
Synopsis
Keywords: Pancreas, Pancreas, Reproducibility, Repeatibility
Motivation: Determination of repeatability and reproducibility is vital to interpreting and determining measurable change of intra organ fat, specifically in small organs like the pancreas.
Goal(s): The goal of this study is to determine if intra-user repeatability and inter-user reproducibility coefficients of manually drawn ROIs on pancreatic fat.
Approach: The approach of this study was to compare manually drawn ROIs within the pancreas between two users and within a single user.
Results: Results indicate that repeatability and inter-user reproducibility of manually drawn ROIs to determine the MRI measured pancreatic fat fraction were consistent within and across users.
Impact: The repeatability and inter-user reproducibility of manually drawn ROIs to determine the MRI measured pancreatic fat fraction yielded consistent measures both within and across users.
Introduction
Intrapancreatic fat, also known as fatty pancreas, is associated with high insulin-resistance, type 2 diabetes and development of metabolic syndrome. Liver steatosis can be a risk factor for the development of intrapancreatic fat[1]. MRI has been shown to be a reliable modality for detecting fat within various organs, including the liver and pancreas. Recent literature has suggested that MRI can also help detect fat within pancreas as well, typically via manually drawn regions of interest (ROIs) on proton density fat fraction images. However, manual drawn ROIs may vary, both across measurements from an individual and across individuals, causing inconsistent and inaccurate fat content measurements. Understanding the variability between users is vital to interpreting measures and determining if a measured change is due to an intervention. The aim of this study is to determine the intra-user repeatability and inter-user reproducibility of manually generated pancreatic MRI fat fractions measures.Methods
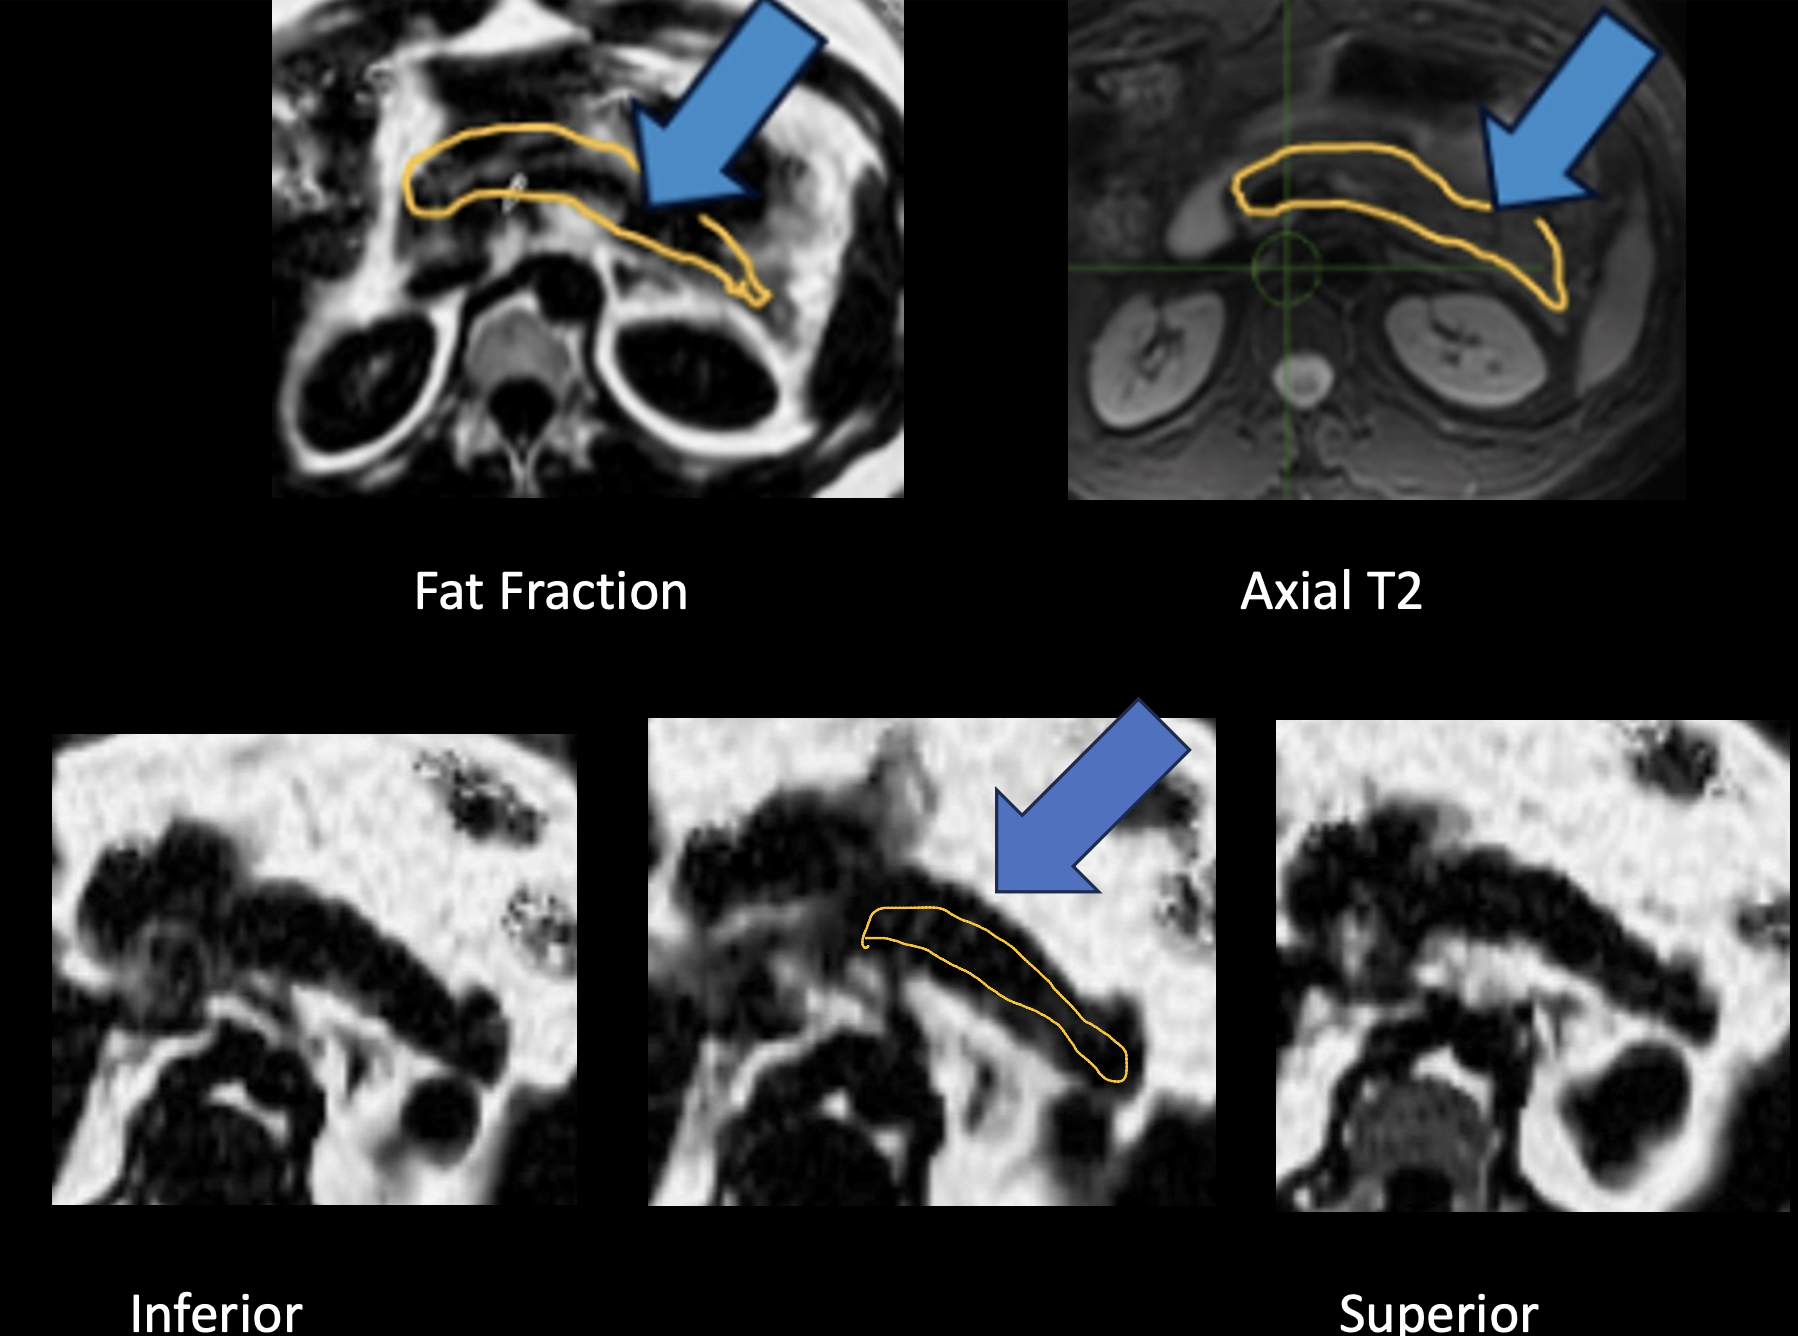
The study cohort comprised 53 individuals. MR imaging was acquired using a 3T scanner (GE Healthcare), including an Iterative Decomposition of water and fat with Echo Asymmetry and Least-squares estimation (IDEAL) sequence with 5mm thick axial slices over the abdomen. From the six acquired images in this sequence, the scanner software generated maps of water, fat, R2*, and fat fraction (FF) (in %). We generated a proton density fat fraction map in units of 10-times % (FF10) to capture the low levels of fat typically found in the pancreas using the formula: FF10 = (fat × 1000) / (fat + water). Regions of interest (ROIs) were drawn manually by two users (User 1 and User 2) within the pancreas on the FF10 maps using in-house software written in IDL (Interactive Data Language, NV5 Geospatial, Broomfield, CO). ROIs were generated by 1) selecting a middle slice superior/inferior, 2) drawing an ROI on the FF10 image, using a corresponding axial T2-weighted image for additional guidance, and 3) encompassing as much of the pancreas as possible, while remaining at least 1 pixel away from the edges of the pancreas in all three dimensions. The users’ mean FF, median FF, location of slice and volume of the ROI were compared, and statistical analyses performed using JMP 17 Pro. To test repeatability of the measures for an individual, User 1 redrew the pancreatic FF ROIs for 23 cases, following the same procedures as above.Results
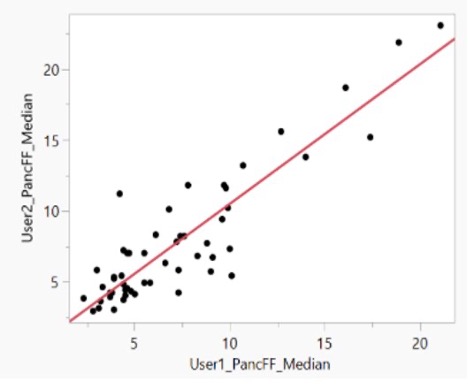
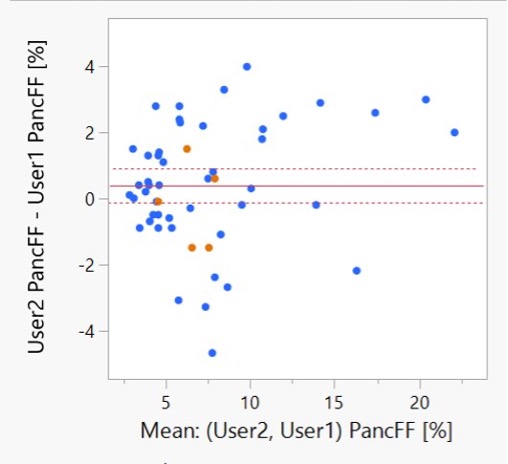
Comparison of the median pancreatic FF between User 1 and User 2 indicated a close correspondence. A linear fit yielded: User2 = 0.99 x User1+0.63) with an R2=0.80. A Bland Altman plot indicated a slight bias (p=0.064) of User 2 over User 1 (0.4%). The reproducibility coefficient between User 1 and User 2 was 2.9%. In 5 cases, the users selected a different middle slice, which did not result in any significant difference in FF. User 1 drew larger ROIs than User 2 (p<0.0001), but this resulted in no significant differences in FF. For the intra-user repeatability evaluation, there was no significant difference between the 2 measures. The coefficient of repeatability was 2.29%. There was one outlier, in which the 2 median FF were 10.7% and 16.1%. With this outlier excluded, the coefficient of repeatability was only 1.71%.Discussion
Previous results suggest that 5% pancreatic fat indicates insulin resistance and 8% is suggestive of diabetes [2]. The reproducibility coefficient of 2.9% in this study suggests we can be confident of reaching these cutoffs with measurements of FF>7.9% for insulin resistance and >10.9% for suggestion of diabetes. Within intervention studies, it can be understood that a change of >2.9% is needed to be measured for determination of real change due to the intervention (with 95% confidence). In terms of the methodology of the drawn ROIs, the middle slice selection did not significantly impact FF measures. Also, the ROI volume had no significant impact on FF measures even though our users drew ROIs with different volumes.Conclusion
The repeatability and inter-user reproducibility of manually drawn ROIs to determine the MRI measured FF of pancreatic fat yielded consistent pancreatic FF both within and across users.Acknowledgements
NIH R01 DK112304References
1) Paul, Jayanta & Hussain, Shihaz. (2020). Pancreatic steatosis: A new diagnosis and therapeutic challenge in gastroenterology. Arquivos de Gastroenterologia. 57. 10.1590/s0004-2803.202000000-27.
2) Lidia S. Szczepaniak, PHD1⇓, Ronald G. Victor, MD1, Ruchi Mathur, MD1, Michael D. Nelson, PHD1, Edward W. Szczepaniak, PHD1, Nicole Tyer, MD1, Ida Chen, PHD1, Roger H. Unger, MD2, Richard N. Bergman, PHD1 and Ildiko Lingvay, MD2 Pancreatic Steatosis and Its Relationship to β-Cell Dysfunction in Humans. Diabetes Care 2012 Nov; 35(11): 2377-2383.
Figures