4740
Evaluating Glucose Dysfunction using Hepatic Quantitative Susceptibility Mapping in Patients with Type 2 Diabetes Mellitus1Department of Medical Imaging, Nanfang Hospital, Guangzhou, China, 2GE Healthcare, MR Research China, Beijing, China
Synopsis
Keywords: Liver, Quantitative Susceptibility mapping, Type 2 Diabetes Mellitus, Hepatic iron deposition
Motivation: The hepatic iron deposition in Type 2 Diabetes Mellitus (T2DM) patients could affect insulin resistance and glucose production. The R2*-based method for measuring iron content can be affected by factors like fat tissue and background magnetic fields.
Goal(s): the study employed QSM method, which is insensitivity to the above confounder, to evaluate glucose dysfunction in T2DM.
Approach: Hepatic R2* and QSM values were measured in 11 T2DM patients, and were correlated with glucose tolerance.
Results: A negative correlation between QSM values and the insulin β-cells dysfunction was found, whereas R2* values did not show any significant correlation.
Impact: Hepatic Quantitative Susceptibility Mapping may serve as a predictor of glucose metabolism dysfunction in patients with Type 2 Diabetes Mellitus and has shown to be more effective than hepatic R2* for this purpose.
Introduction
Type 2 Diabetes Mellitus (T2DM) is a metabolic disorder that leads to severe chronic complications, such as cardiovascular and cerebrovascular diseases, as well as neuropathy. A prevalent issue in T2DM patients is hepatic iron deposition, which can worsen insulin resistance, augment hepatic gluconeogenesis, and disrupt the daily rhythm of liver glucose production¹. Hepatic R2* has proven effective in evaluating liver iron overload. However, previous study found no significant correlation between hepatic R2* and glucose dysregulation2. This may be attributed to the fact that hepatic R2* values are influenced not only by iron content but also by factors like fat tissue and background magnetic fields. In contrast, quantitative susceptibility mapping (QSM) offers a robust, reproducible alternative for assessing iron content and is insensitivity to such confounders. Therefore, the current study aims to evaluate the feasibility of using hepatic QSM technique to predict glucose disturbances in patients with T2DM.Methods
Eleven patients with prediabetes and T2DM were recruited from Nanfang Hospital between September and October 2023(Table 1). All patients were subjected to standard glucose tolerance tests. Insulin resistance (IR) was assessed using the Homeostasis Model Assessment of Insulin Resistance (HOMA-IR), which was calculated with the formula: (fasting blood glucose [FBG, in mmol/L] × fasting plasma insulin [FPI, in mU/L]) / 22.5. The function of β-cells was evaluated using the Homeostasis Model Assessment of Insulin Secretion (HOMA-β), calculated as: (20 × FPI) / (FBG - 3.5). This study received approval from the local ethics committee, and all participants signed informed consent forms prior to the commencement of the study.MRI data were acquired using a 3.0T SIGNA Architect scanner (GE Healthcare, WI, USA). For each patient, a 3D multi-echo gradient-recalled echo (me-GRE) sequence captured QSM raw phase and magnitude images, with parameters set to: a repetition time of 6.6 ms, six echoes with an initial echo time of 0.7 ms and subsequent intervals of 0.7 ms, a flip angle of 3°, an in-plane resolution of 2.5 mm, and a slice thickness of 5 mm without interslice gaps.
Hepatic QSM images were processed with a custom script in MATLAB Software, following these major steps: (1) Implementing the Variable Layer Graph-Cut algorithm (VLGCA)3 on QSM phase data to obtain fat-free total magnetic field maps and R2* maps. (2) Removing the background field from the total field using the Projection-Onto-Dipole Fields (PDF) 4 method. (3) Processing the remaining tissue field to create a susceptibility map through the Morphology Enabled Dipole Inversion algorithm (MEDI) 5. An experienced radiologist delineated the Regions of Interest (ROIs) on the largest cross-sectional slice of the liver, carefully avoiding any conspicuous blood vessels. The mean values of QSM and R2* within these ROIs were then used for subsequent analysis. The Pearson correlation analysis was performed to assess the correlation of hepatic QSM and R2* and GRE-R2* with HOMA-β and HOMA-IR.
Results
Fig. 1 shows examples, including magnitude images, R2* mapping images and QSM images, from two example patients with T2DM. Fig. 2 displays the results of correlation analysis. Neither hepatic QSM values nor hepatic R2* values showed a significant correlation with HOMA-IR (r = 0.39, p = 0.24; r = -0.40, p = 0.22). Notably, hepatic QSM values demonstrated a significant negative correlation with HOMA-β (r = -0.66, p = 0.026), while hepatic R2* values did not (r = -0.41, p = 0.20).Discussion
The present study reconstructed hepatic R2* and QSM images and found a negative correlation between QSM values and the HOMA-β, whereas R2* values did not demonstrate any significant correlation. Hepatic iron metabolism is essential for iron homeostasis and its dysregulation, resulting in iron overload, can lead to iron accumulation in multiple organs, including the pancreas. This pancreatic iron accumulation may result in the loss of insulin β-cells¹. Thus, the dysfunction of β-cells may correlate with hepatic iron overload, which is agreement with our results. Furthermore, hepatic R2* values did not demonstrate any significant correlation with glucose dysfunction in T2DM patients. It could be attributed to the fact that R2* value depends on the microenvironment of water interactions, the spatial distribution of iron within a voxel, and sources of interference such as fat and fibrosis, making it less sensitive to iron than QSM.Conclusion
Hepatic QSM could be used to predict glucose dysfunction in patients with Type 2 Diabetes Mellitus and is more effective than hepatic R2*.Acknowledgements
No acknowledgement found.References
1. Harrison A V, Lorenzo F R, McClain D A. Iron and the Pathophysiology of Diabetes. Annual review of physiology, 2023, 85: 339-362.
2. Shur J, Kannengiesser S A R, Menezes R, et al. Glucose dysregulation in patients with iron overload: is there a relationship with quantitative pancreas and liver iron and fat content measured by MRI?. European Radiology, 2020, 30: 1616-1623.
3. Boehm C, Diefenbach M N, Makowski M R, et al. Improved body quantitative susceptibility mapping by using a variable‐layer single‐min‐cut graph‐cut for field‐mapping. Magnetic Resonance in Medicine, 2021, 85(3): 1697-1712.
4. Liu T, Khalidov I, de Rochefort L, et al. A novel background field removal method for MRI using projection onto dipole fields. NMR in Biomedicine, 2011, 24(9): 1129-1136.
5. Liu T, Liu J, De Rochefort L, et al. Morphology enabled dipole inversion (MEDI) from a single‐angle acquisition: comparison with COSMOS in human brain imaging. Magnetic resonance in medicine, 2011, 66(3): 777-783.
Figures
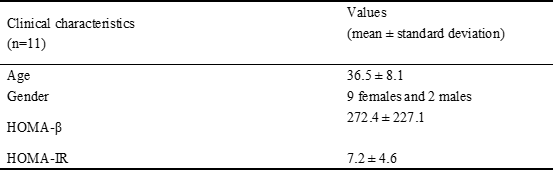
Table 1. Clinical information in the present study.HOMA-β = Homeostatic Model Assessment of Beta-cell function; HOMA-IR = Homeostatic Model Assessment of Insulin Resistance.
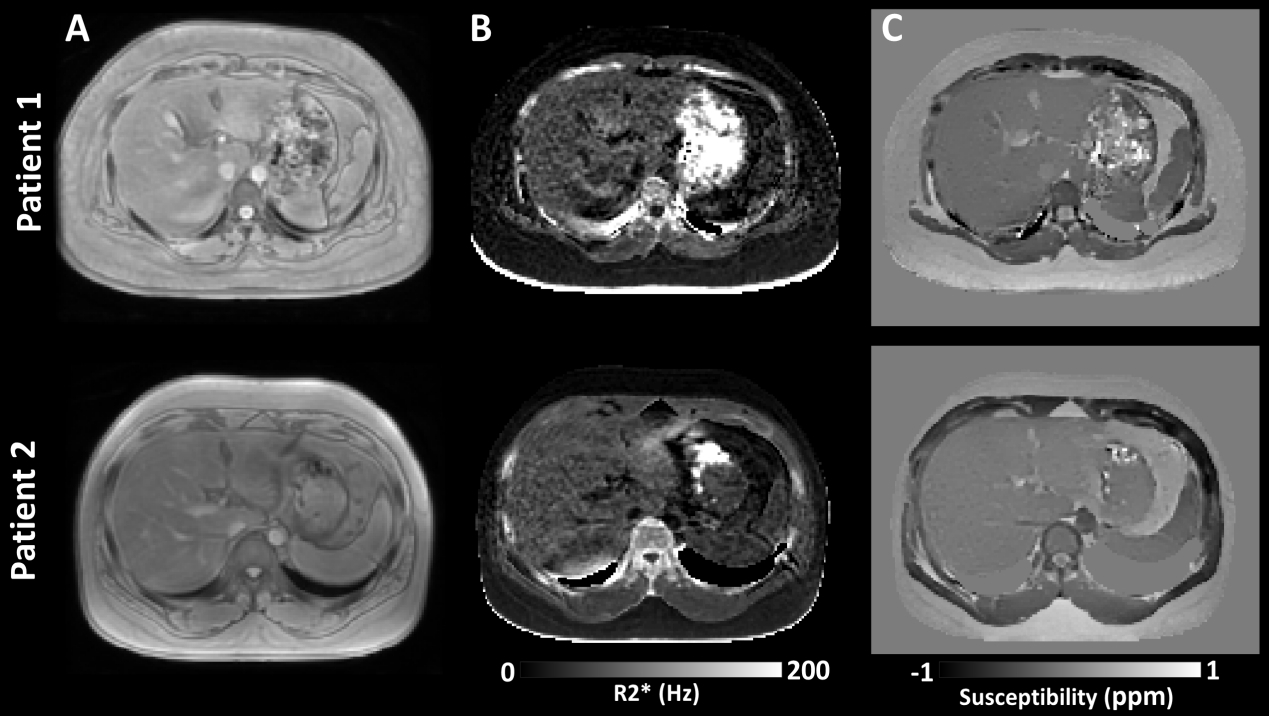
Fig. 1. Examples of magnitude images (A), R2* mapping images (B) and QSM images (C) for two patients with T2DM.
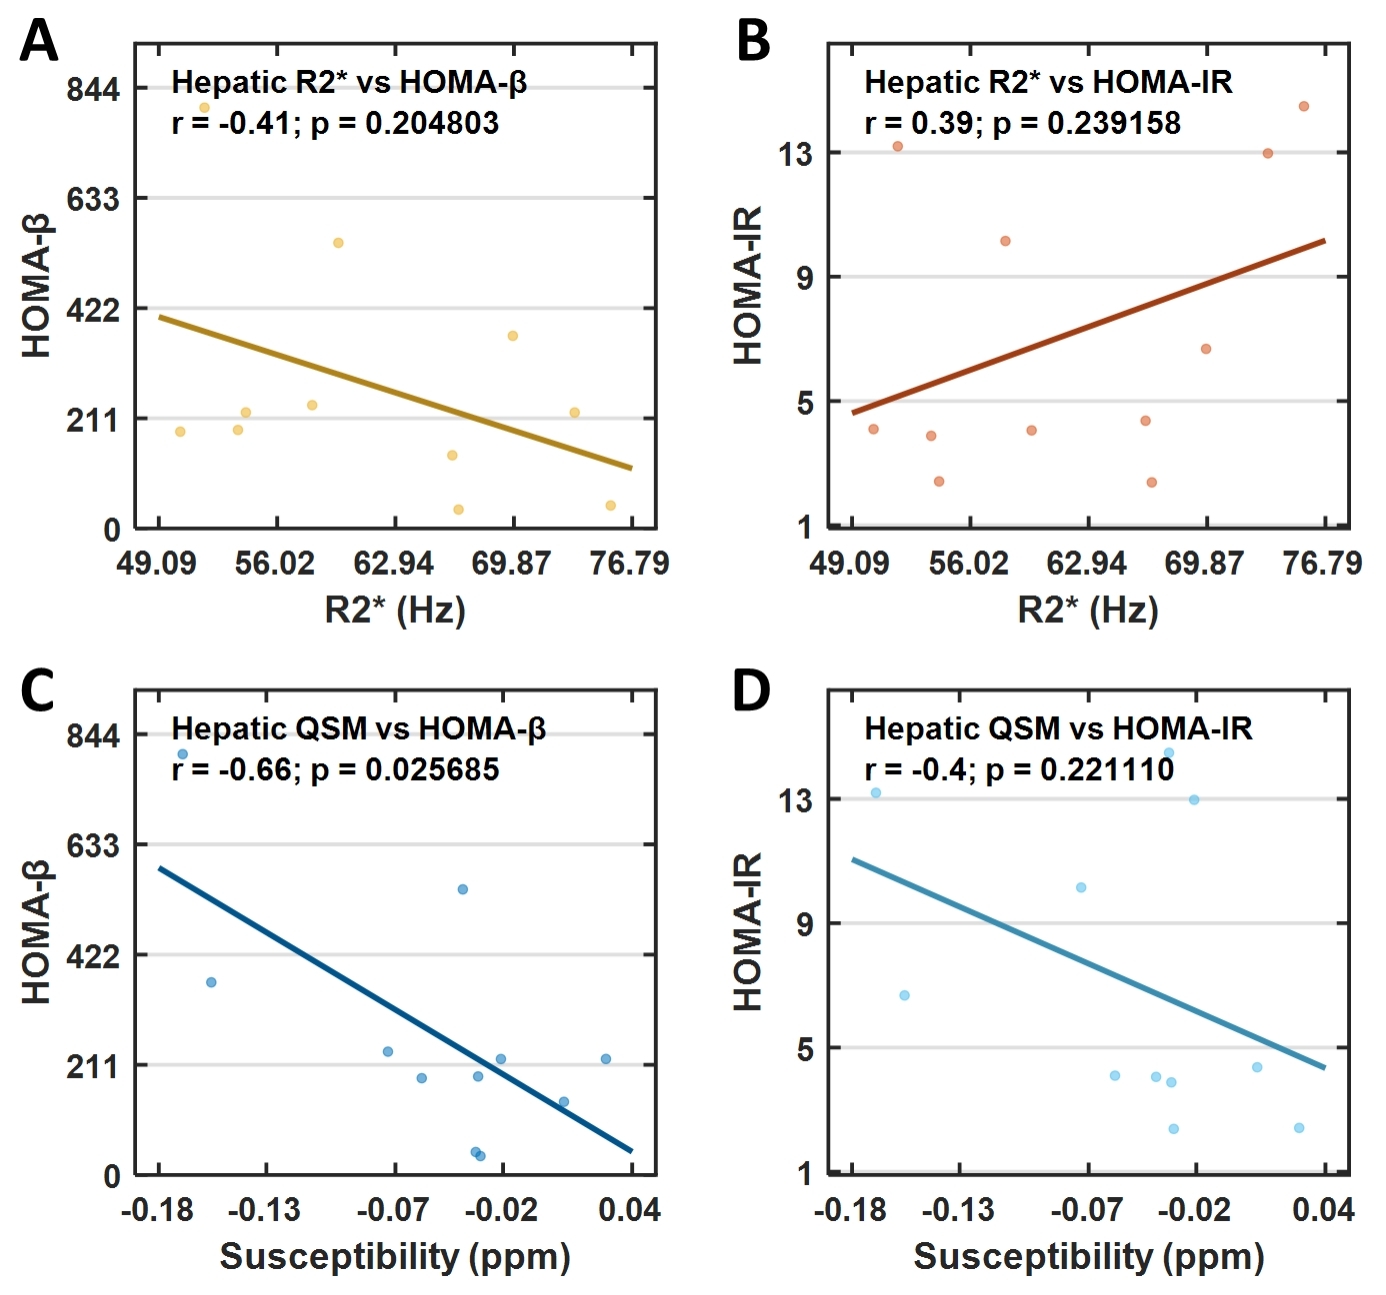
Fig. 2. Correlation analysis results. (A) The correlation between hepatic R2* and HOMA-β. (B) The correlation between hepatic R2* and HOMA-IR. (C) The correlation between hepatic QSM and HOMA-β. (D) The correlation between hepatic QSM and HOMA-IR. Only the correlation between hepatic QSM and HOMA-β is statistically significant (p < 0.05).