4737
High-resolution full pancreas water T1 mapping1Institute of Diagnostic and Interventional Radiology, TUM School of Medicine and Health, Department Clinical Medicine, Technical University of Munich, Munich, Germany, 2Philips GmbH Market DACH, Hamburg, Germany, 3Philips Research, Hamburg, Germany
Synopsis
Keywords: Pancreas, Quantitative Imaging, Acquisition & Reconstruction
Motivation: T1 mapping provides valuable insights for the assessment of pancreatic diseases which might be challenging to evaluate if only based on qualitative MRI.
Goal(s): Not only a high-resolution, fast T1 mapping method of the entire pancreas remains a challenge, but also a technique for water T1 mapping since the T1 is biased in the presence of fat.
Approach: This work proposes a high-resolution, rapid, continuous inversion-recovery Look-Locker method combining a spiral read out with Dixon and a dictionary-based processing for water T1 mapping.
Results: The entire pancreas is scanned within 24 slices, distributed in 3 breath-holds of 12s each.
Impact: The present work proposes a high-resolution water T1 mapping methodology of the whole pancreas: 24 slices (2x2x5mm3) in 3 short breath-holds of 12s. The proposed method aims to support the fast assessment of diseases in the entire pancreas.
Introduction
Quantitative MRI provides valuable parameters for the assessment of pancreatic diseases which might be challenging to evaluate if only based on qualitative MRI. For instance, T1 maps have been analyzed for pancreatitis(1-3) and pancreatic cancer(4) using the composite (water+fat) signal.The modified Look-Locker inversion-recovery (MOLLI)(5,6) method and magnetic resonance fingerprinting (MRF)(7) have been mostly used for pancreas T1 mapping. Typically, a single slice per breath-hold is acquired with MOLLI(2,4). In contrast, MRF approaches have proposed free-breathing scans(8,9). Both techniques require long acquisition times.
Despite the efforts, high-resolution, fast T1 mapping of the entire pancreas remains a challenge. Moreover, given that T1 is known to be biased in the presence of fat(10), frequently seen in lipomatous and atrophic pancreas, a technique for water T1 (wT1) mapping would be of advantage.
This work proposes a high-resolution, rapid, continuous inversion-recovery Look-Locker (CIR-LL) method combining a spiral read out with Dixon and a dictionary-based processing for wT1 mapping. The entire pancreas is scanned within 24 slices distributed in 3 breath-holds of 12s each.
Methods
Pulse sequence design: A continuous inversion recovery spoiled gradient echo sequence is employed to acquire one slice(11) (Figure 1a). An adiabatic slice selective inversion is followed by 5° RF pulses repeated every TR=15ms for 100 times. For high sampling efficiency, spiral readouts are employed. A spiral readout of 9.2ms is acquired at interleaved TE1/TE2=2.3/3.3ms and is rotated every 2 excitations for varying spatial encoding. The acquisition lasts 1.5s per slice. Multi-slice acquisition occurs in an interleaved manner repeating the sequence within a breath-hold (Figure 1b). Additionally, B0 and transmit $$$B_1^+$$$ maps are acquired.Quantification methodology: Figure 1c describes the proposed quantification methodology. The B0 map is used for deblurring. Then, the water-fat separation is performed for every spatial location using a 7-peak fat model(12). Finally, to remove under-sampling artifacts and to obtain the wT1 map, the water images are matched to a dictionary. A $$$B_1^+$$$ map can be used for $$$B_1^+$$$ correction. The dictionary contains the signal evolutions for T1=[100:5:3000]ms, T2=[40:2:80]ms and $$$B_1^+$$$=[0.55:0.01:1.5].
All experiments were performed at a clinical 3T System (Elition X, Philips Healthcare, Best, The Netherlands) with FOV=450mm, resolution=2x2x5mm3, slice gap=1mm and an under-sampling factor=14.
Phantom measurements: The proposed method was validated in a phantom of 12 vials with different wT1 and PDFF values (Calimetrix, Madison, WI, USA) (Figure 2a-b). The $$$B_1^+$$$ robustness of the method was verified with the phantom by executing the matching process with and without $$$B_1^+$$$ correction. As a reference, MR spectroscopy-based SHORTIE(13,14) measurements were performed.
In vivo measurements: The proposed method was evaluated in 5 volunteers and 2 patients (1 case of pancreatitis and 1 case of diffuse liver disease, but normal pancreas). 24 slices were acquired to cover the entire pancreas for all in vivo scans: 3 separate breath-holds of 8 slices and 12s each. An overlap of 11mm between the 8-slice-stacks was considered (Figure 1b). For all volunteers, a second measurement was performed. The entire pancreas was segmented in the obtained wT1 maps and the repeatability was assessed by comparing the mean and standard deviation of both measurements. For 3 volunteers, the processing was also performed without $$$B_1^+$$$ correction. T2-weighted images and ADC maps of the patients were compared to wT1 maps.
Results
The phantom results are in agreement with wT1-SHORTIE and, due to the small FA, present minimal variations if estimated with or without $$$B_1^+$$$ correction (Figure 2c).The proposed method covers the entire pancreas (Figure 3) and captures its complex anatomy (Figure 4a). The analysis of the volunteers’ pancreas segmentation demonstrates the in vivo robustness of the wT1 maps to $$$B_1^+$$$ inhomogeneities and their repeatability (Figure 4b).
The proposed wT1 maps depict the pancreas similarly to the clinical images (Figure 5). Furthermore, the wT1 maps present higher values for the pancreatitis case, which is in accordance with previous studies(2) and allows for a better distinction from normal pancreas in comparison to the ADC maps.
Discussion & Conclusion
The present work proposes a high-resolution wT1 mapping methodology of the whole pancreas: 24 slices (2x2x5mm3) were acquired in 3 short breath-holds of 12s each. The water-fat separation step is particularly relevant for a correct T1 estimation in the presence of fat, which is typically seen in lipomatous and atrophic pancreas. Despite the long spiral read out (9.2ms), the estimated wT1 maps were of high quality thanks to the employed deblurring. The method is robust to $$$B_1^+$$$ inhomogeneities; therefore, time can be saved by omitting the $$$B_1^+$$$ scan. In agreement with the current literature, high wT1 values were measured in a case of pancreatitis.Acknowledgements
The present research was supported by Philips.References
- Tirkes T, Lin C, Fogel EL, Sherman SS, Wang Q, Sandrasegaran K. T(1) mapping for diagnosis of mild chronic pancreatitis. J Magn Reson Imaging 2017;45(4):1171-1176.
- Wang M, Gao F, Wang X, Liu Y, Ji R, Cang L, Shi Y. Magnetic resonance elastography and T(1) mapping for early diagnosis and classification of chronic pancreatitis. J Magn Reson Imaging 2018.
- Cheng M, Gromski MA, Fogel EL, DeWitt JM, Patel AA, Tirkes T. T1 mapping for the diagnosis of early chronic pancreatitis: correlation with Cambridge classification system. Br J Radiol 2021;94(1121):20200685.
- Wang L, Gaddam S, Wang N, Xie Y, Deng Z, Zhou Z, Fan Z, Jiang T, Christodoulou AG, Han F, Lo SK, Wachsman AM, Hendifar AE, Pandol SJ, Li D. Multiparametric Mapping Magnetic Resonance Imaging of Pancreatic Disease. Front Physiol 2020;11:8.
- Look DC, Locker DR. Time Saving in Measurement of NMR and EPR Relaxation Times. The Review of Scientific Instruments 1970;41(2):250-251.
- Messroghli DR, Radjenovic A, Kozerke S, Higgins DM, Sivananthan MU, Ridgway JP. Modified Look-Locker inversion recovery (MOLLI) for high-resolution T1 mapping of the heart. Magn Reson Med 2004;52(1):141-146.
- Ma D, Gulani V, Seiberlich N, Liu K, Sunshine JL, Duerk JL, Griswold MA. Magnetic resonance fingerprinting. Nature 2013;495(7440):187-192.
- Serrao EM, Kessler DA, Carmo B, Beer L, Brindle KM, Buonincontri G, Gallagher FA, Gilbert FJ, Godfrey E, Graves MJ, McLean MA, Sala E, Schulte RF, Kaggie JD. Magnetic resonance fingerprinting of the pancreas at 1.5 T and 3.0 T. Sci Rep 2020;10(1):17563.
- Lee YJ, Koken P, Sonnabend K, Bratke G, Heuvelink-Marck A, Doneva M. Abdominal MR Fingerprinting with In-bore Breathing Guidance. Proc Intl Soc Mag Reson Med 31 2023;2178.
- Higashi M, Tanabe M, Okada M, Furukawa M, Iida E, Ito K. Influence of fat deposition on T1 mapping of the pancreas: evaluation by dual-flip-angle MR imaging with and without fat suppression. Radiol Med 2020;125(1):1-6.
- Huaroc E, Weiss K, Lee YJ, Stelter J, Amthor T, Koken P, Makowski MR, Braren R, Doneva M, Karampinos DC. Fast multi-slice liver water T1 mapping using single-shot continuous inversion recovery spiral imaging. Proc Intl Soc Mag Reson Med 31 2023;1840.
- Ren J, Dimitrov I, Sherry AD, Malloy CR. Composition of adipose tissue and marrow fat in humans by 1H NMR at 7 Tesla. J Lipid Res 2008;49(9):2055-2062.
- Ruschke S, Karampinos DC. ALFONSO: A versatiLe Formulation fOr N-dimensional Signal mOdel fitting of MR spectroscopy data and its application in MRS of body lipids. Proc Intl Soc Mag Reson Med 30 2022;2776.
- Ruschke S, Karampinos DC. Single-voxel short-TR multi-TI multi-TE STEAM MRS for water-fat relaxometry. Magn Reson Med 2022;87(6):2587-2599.
Figures
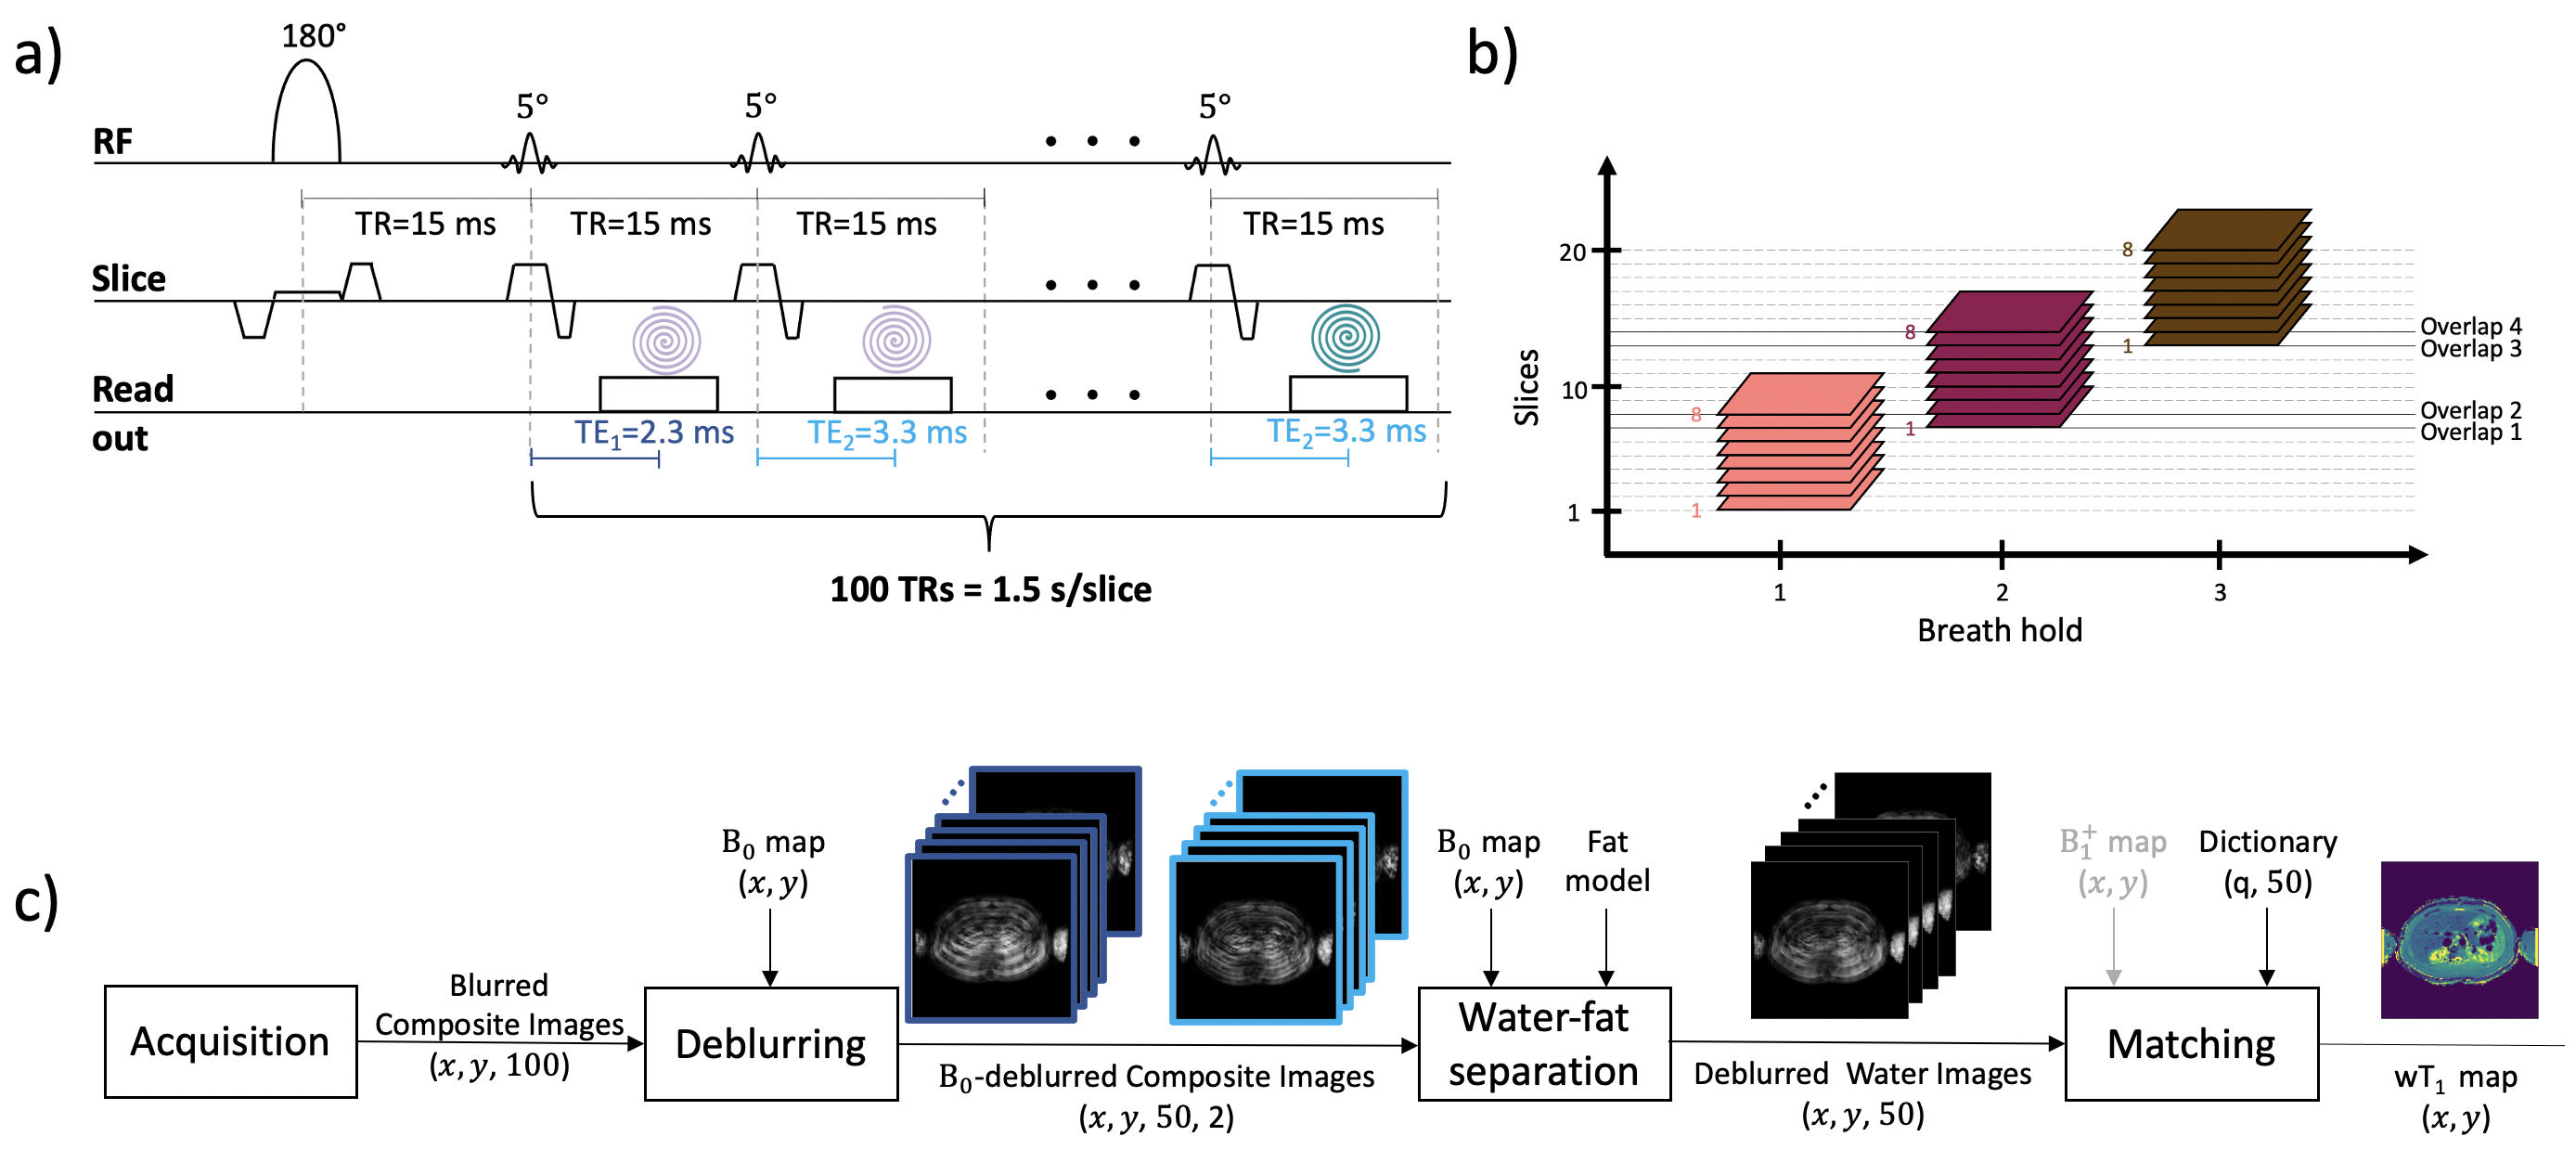
Figure 1. a) Proposed single-shot continuous inversion recovery spiral sequence. b) 8 slices can be acquired in a breath-hold of 12s. For more slices, separate breath-holds and an overlap of 2 slices between the stacks is suggested. c) Block diagram to obtain the wT1 map of one slice. (x, y) represent the image dimensions and 100 is the number of excitations (50 repetitions x 2 TEs). Despite the high under-sampling, the wT1 map presents good quality as displayed by the miniature images.
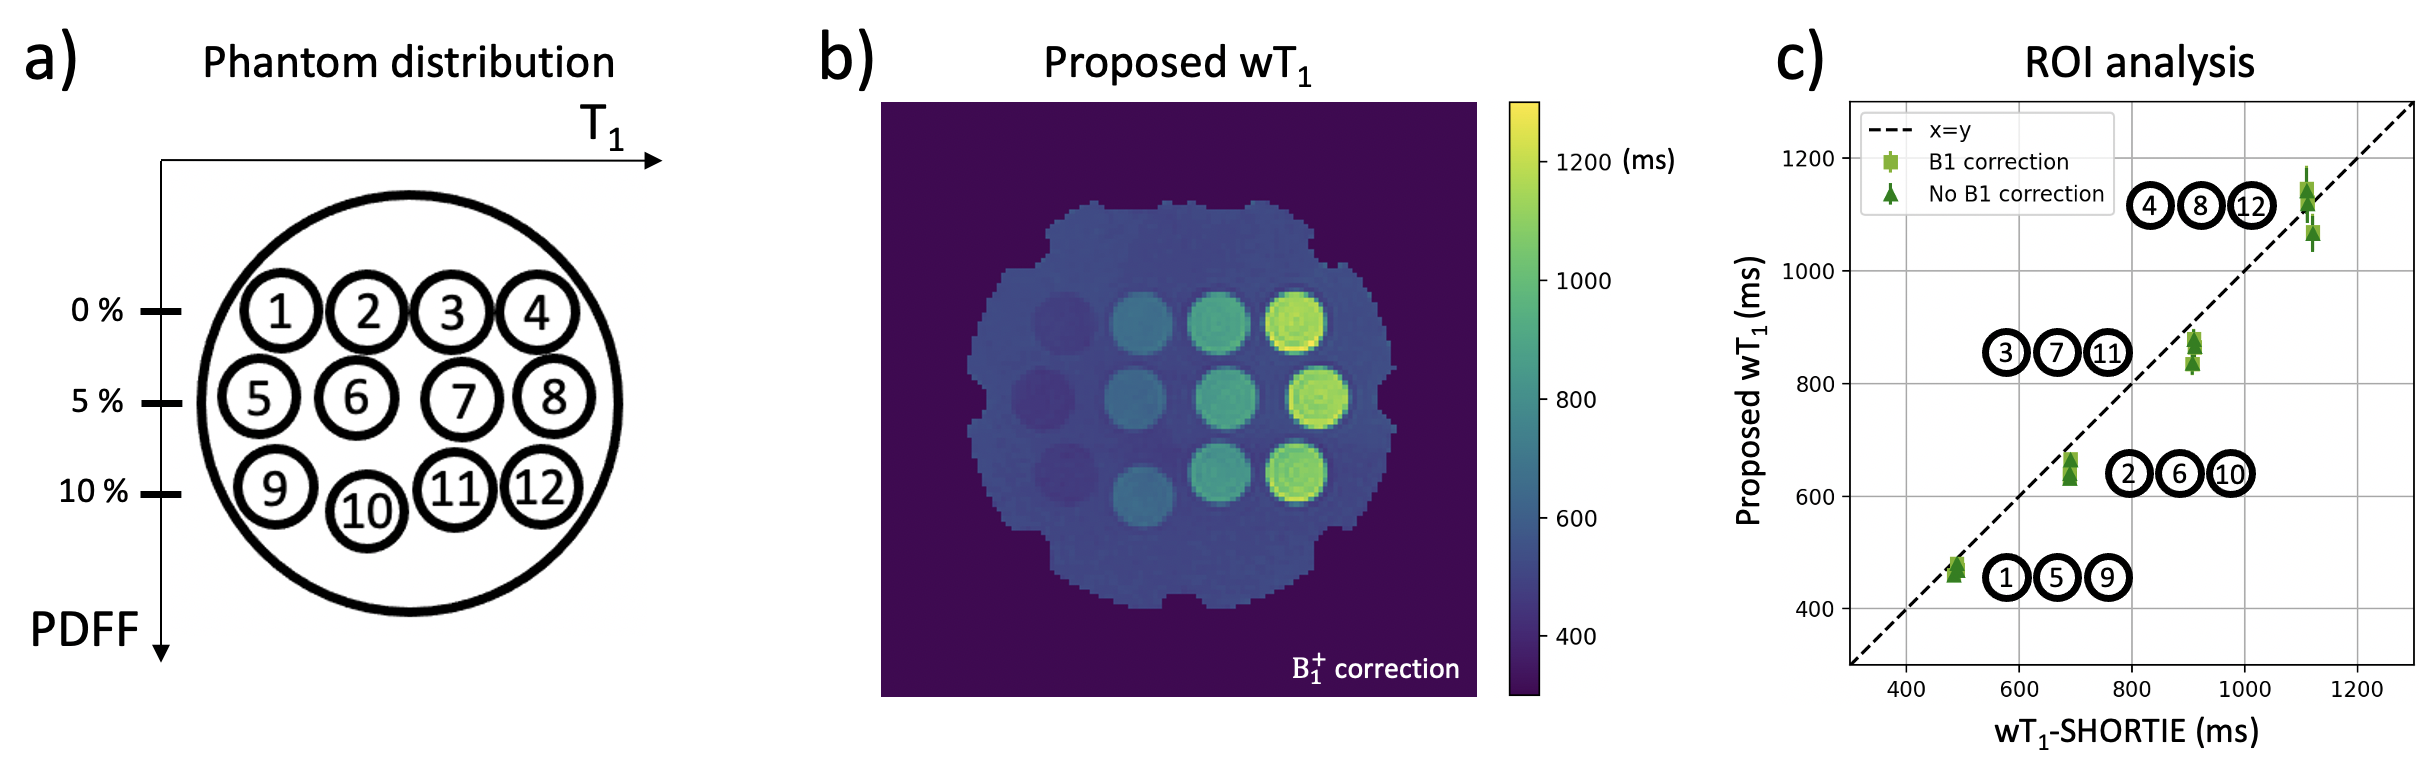
Figure 2. a) Distribution of the phantom vials. The vials are organized in rows which vary in T1 from left to right and in PDFF from top to bottom. b) wT1 map with $$$B_1^+$$$ correction as result of the proposed acquisition and processing pipeline. c) Results of the ROI analysis comparing the proposed wT1 with and without $$$B_1^+$$$ correction to the wT1-SHORTIE.
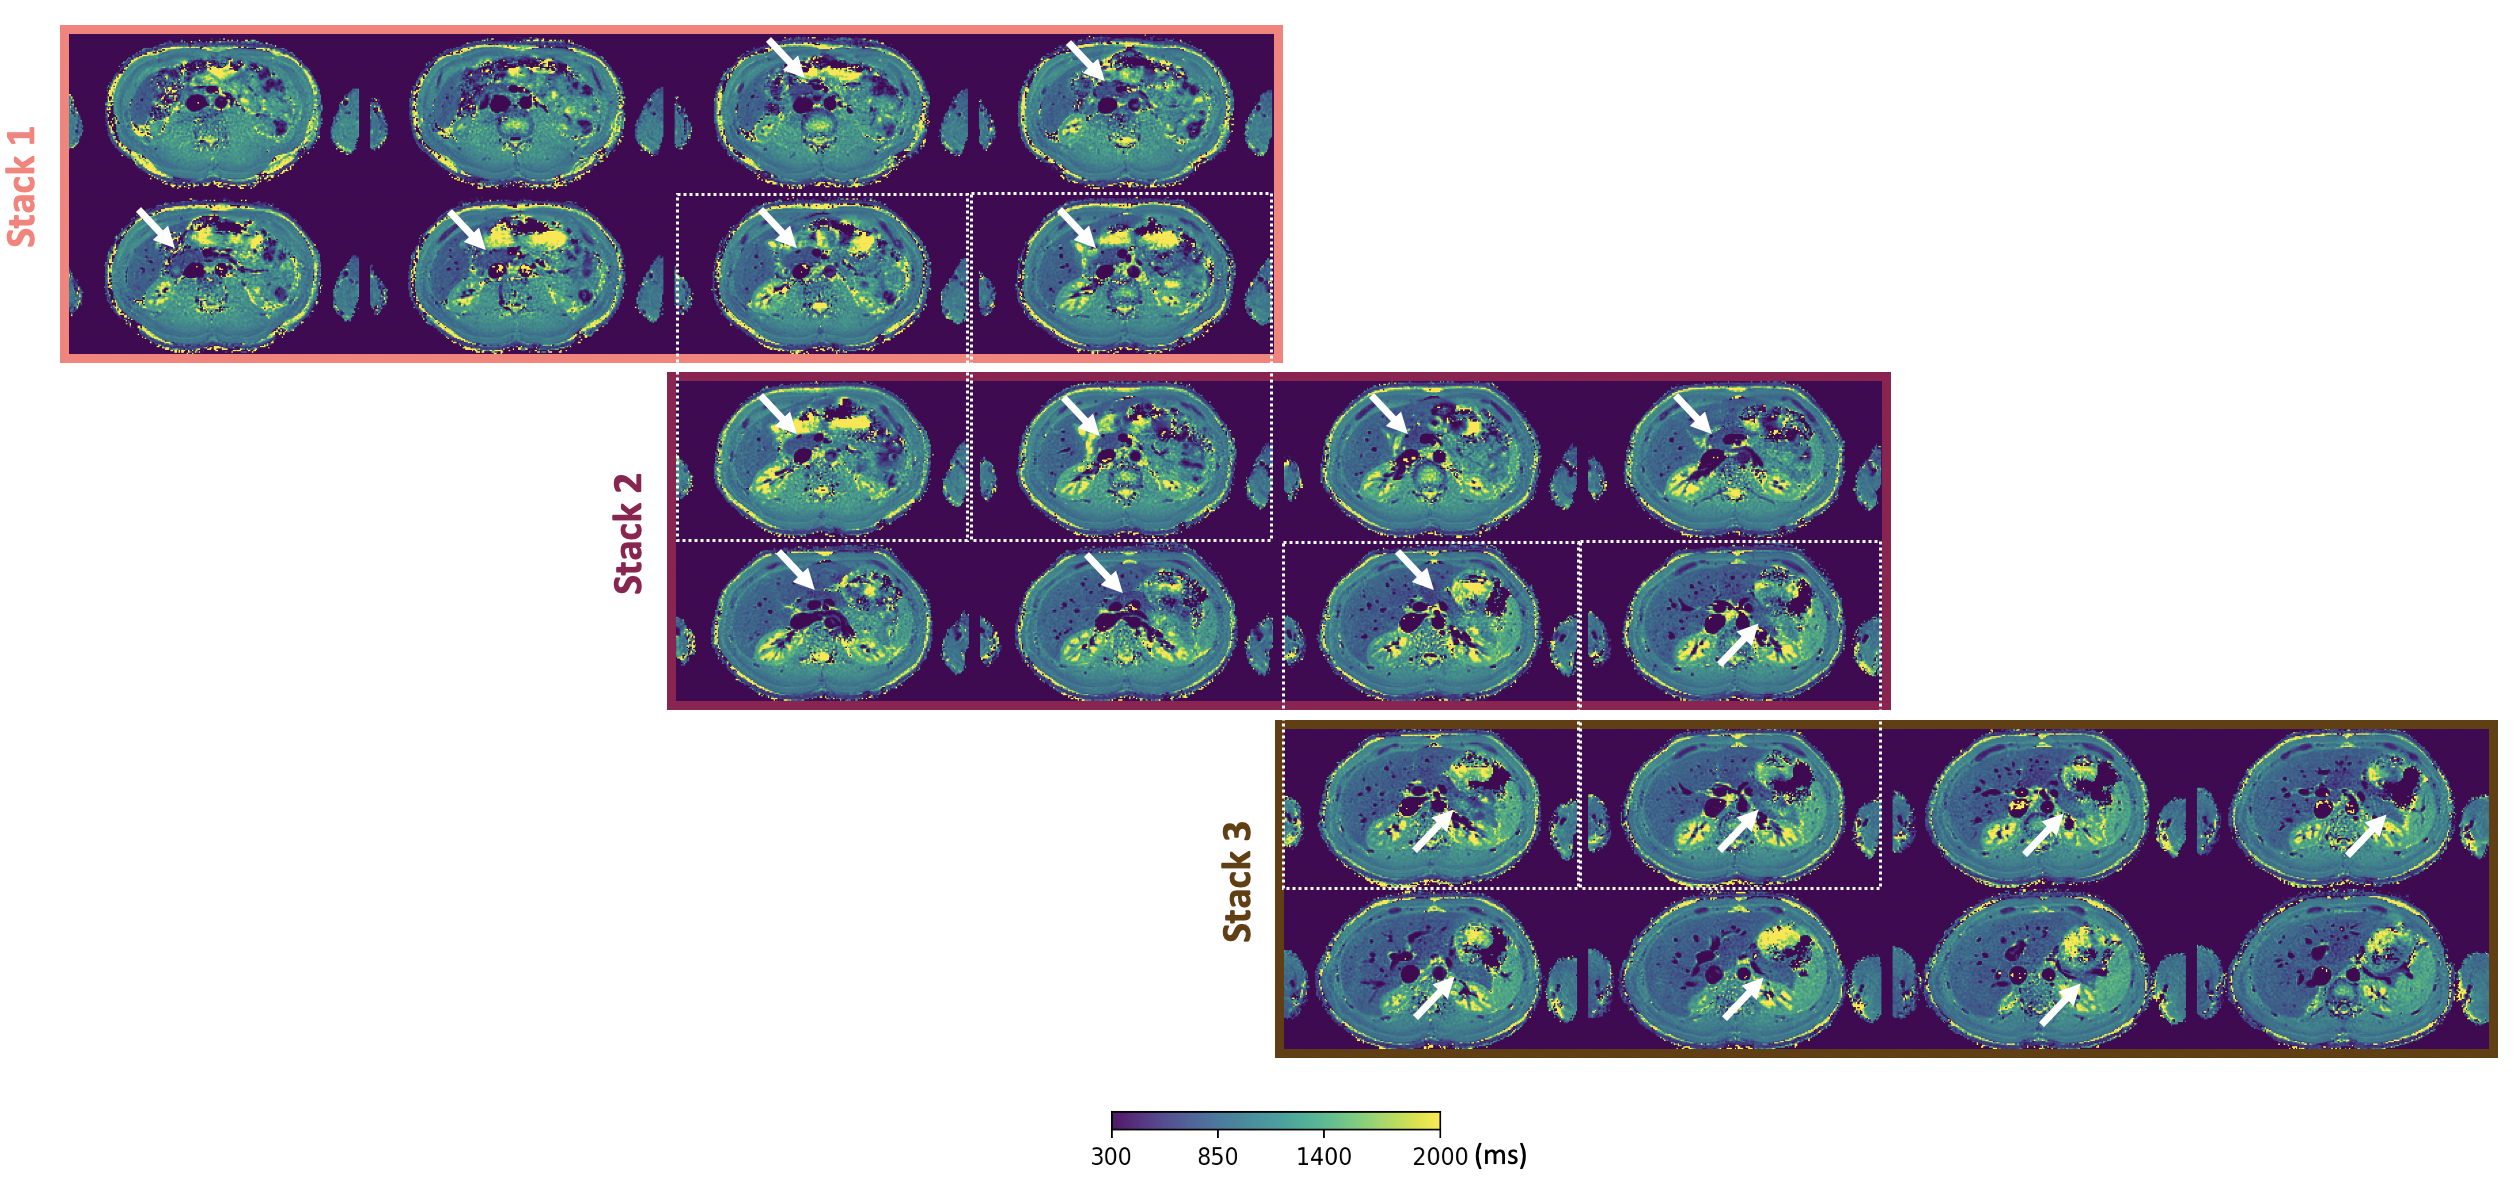
Figure 3. In vivo measurements in one volunteer. 3 stacks of 8 slices were acquired for a full pancreas coverage. The stacks were acquired in consecutive scans and in different breath-holds. An overlap of 11mm (2 slices of 5mm thickness + a slice gap of 1mm) was set between stacks. Dotted white boxes group vertically the corresponding slices in an overlap. The white arrows point to the pancreas location.
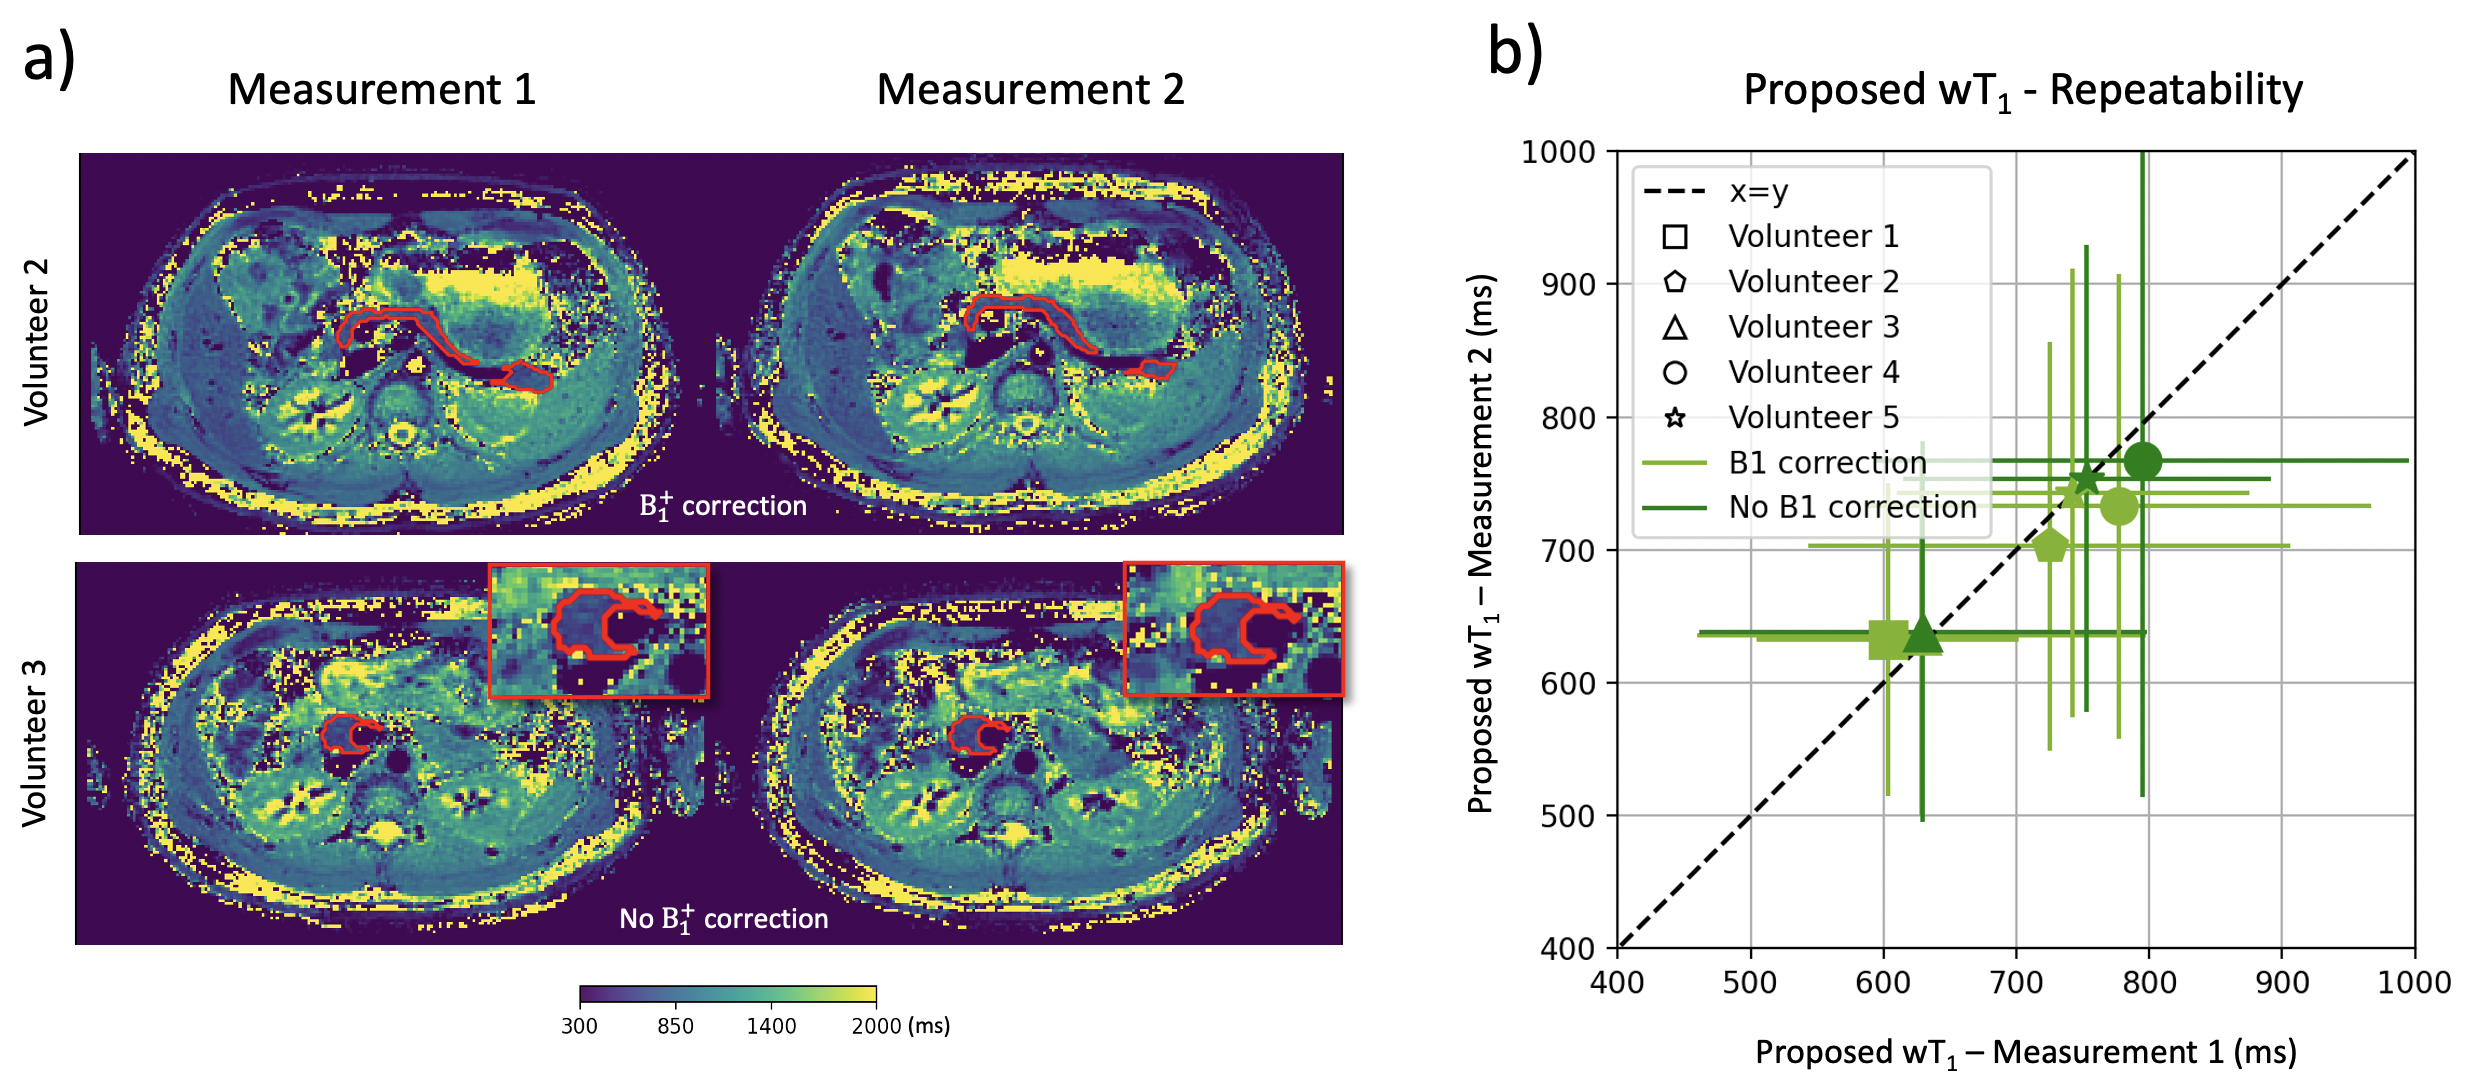
Figure 4. a) wT1 maps from 2 volunteers showing the body, tail and head of the pancreas for two consecutive measurements. The entire pancreas was segmented on the wT1 maps as shown in red for these slices. b) The mean and standard deviation of the whole pancreas were calculated and compared between measurements for all volunteers. Values without $$$B_1^+$$$ correction are shown for 3 volunteers.
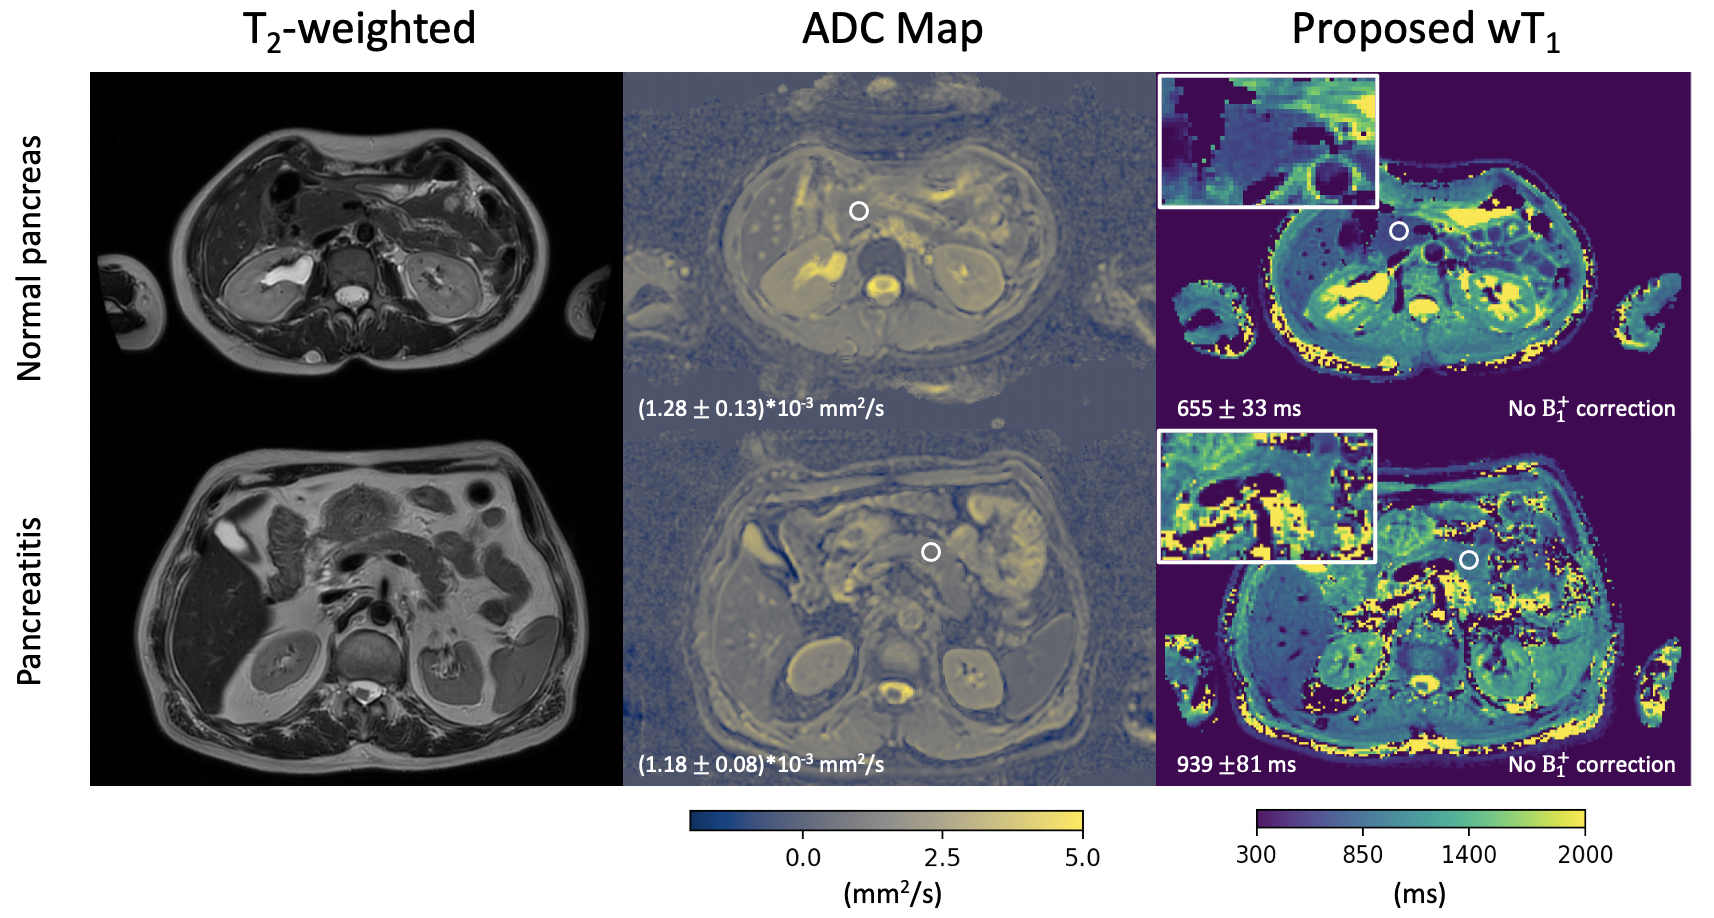
Figure 5. T2-weighted images and ADC maps from clinical scans were compared to the proposed wT1 maps for a patient with normal pancreas and a patient with pancreatitis. ROIs shown in white suggest better differentiation between the wT1 values of both cases compared to the ADC values.