4736
Multiparametric magnetic resonance imaging findings of the pancreas: Comparison in patients with type 1 and type 2 diabetes1Department of Radiology, Yamaguchi University Graduate School of Medicine, Ube, Japan, 2Division of Endocrinology, Metabolism, Hematological Sciences and Therapeutics, Yamaguchi University Graduate School of Medicine, Ube, Japan, 3Health Administration center, Organization for Education and Student Affairs, Yamaguchi University, Ube, Japan
Synopsis
Keywords: Pancreas, Diabetes
Motivation: The diabetes-related pancreatic changes on MRI remain to be fully elucidated.
Goal(s): Our goal was to determine characteristic imaging findings of the pancreas on MRI in patients with type 1 diabetes (T1D) and type 2 diabetes (T2D).
Approach: Seven T1D patients and fifty-four T2D patients were imaged using multiparametric pancreatic MRI including T1 map, PDFF map, ADC map and cine-dynamic MRCP, and were compared to control patients.
Results: T1D patients had reduced pancreatic size, increased pancreatic T1 and ADC values, and decreased pancreatic juice flow on cine-dynamic MRCP. T2D patients had increased pancreatic PDFF.
Impact: Multiparametric MRI provided valuable information on pancreatic changes in both T1 and T2 diabetes and may be useful for assessing pancreatic endocrine and exocrine insufficiency and pancreatic pathological changes in patients with diabetes.
Introduction
Magnetic resonance imaging (MRI) has been increasingly investigated for detecting pancreatic changes on images reflecting pancreatic histological and pathophysiological changes in patients with diabetes. For example, previous studies have shown that pancreatic volume measured by MRI is reduced in patients with both type 1 diabetes (T1D) and type 2 diabetes (T2D) 1. In studies of individuals with T2D, the T1 value of the pancreas on T1 map images, suggested as a marker of fibrosis, has positively correlated with HbA1c 2. A recent study demonstrated that secretory flow of the pancreatic juice on cine-dynamic MR cholangiopancreatography (MRCP) with a spatially selective inversion-recovery (IR) pulse was decreased in patients with diabetes 3, suggesting the pancreatic exocrine insufficiency in patients with diabetes. However, the diabetes-related pancreatic changes on MRI, especially those in T1D, remain to be fully elucidated. In addition, most of previous studies evaluated the pancreatic images with only one or two MRI parameters or included few clinical data. Therefore, the purpose of this study was to evaluate the pancreatic changes in patients with both T1D and T2D using multiparametric MRI to elucidate the differences between them in an association with clinical data.Methods
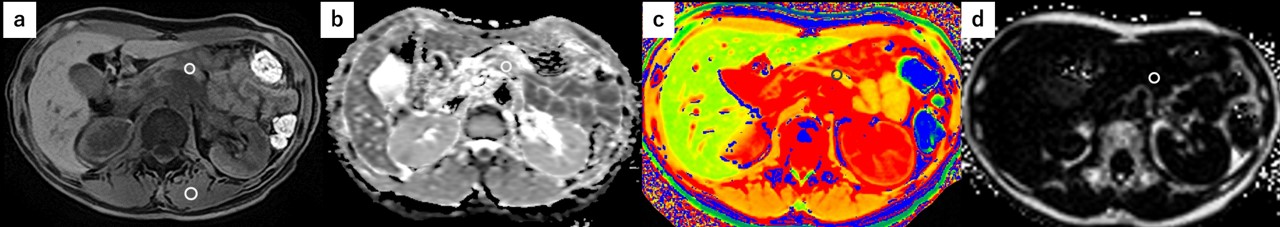
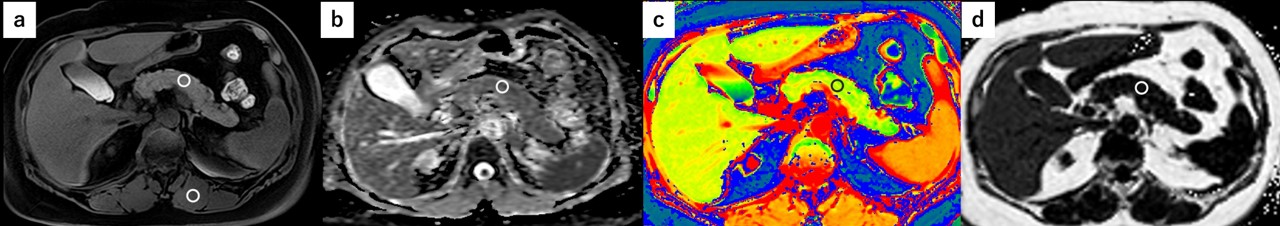
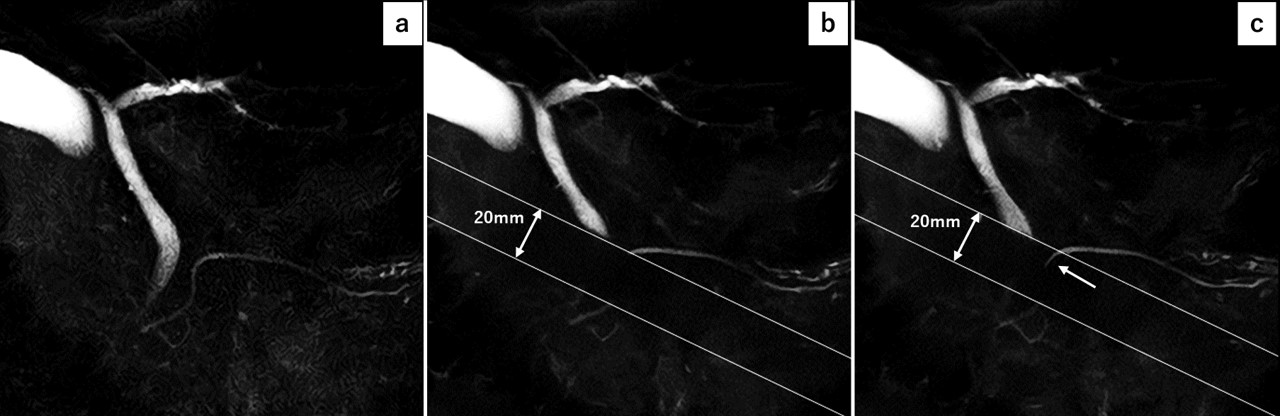
This prospective study involved 61 patients with T1D (n=7) and T2D (n=54) between January 2021 and January 2023. All patients underwent multiparametric pancreatic MRI at 3T. The imaging data examined included the pancreatic anteroposterior (AP) diameter, pancreas-to-muscle signal intensity ratio (SIR) on fat suppressed T1-weighted image (FS-T1WI), apparent diffusion coefficient (ADC) value, T1 value on T1 map using a modified Look-Locker sequence, proton density fat fraction (PDFF), and pancreatic secretion grade on cine-dynamic MRCP calculated from the frequency and moving distance of the pancreatic juice flow. Laboratory tests for diabetes management were also conducted on the same day of the imaging. As a control group, we retrospectively included 21 patients without impaired glucose metabolism and pancreatic diseases excluding pancreatic cyst. The MRI measurements and clinical data were compared using one-way analysis of variance and Kruskal-Wallis test.Results
MRI measurements in T1D showed that the pancreatic AP diameters in T1D was significantly reduced compared with those in T2D and controls (p<0.05), and that the averaged SIR on FS-T1WI in T1D was significantly lower than that in controls (p<0.001). The averaged ADC value and T1 value of the pancreas in T1D were significantly higher than those in T2D (p<0.001 and p=0.001, respectively) and controls (p=0.015 and p=0.010, respectively), while no significant difference was observed in the PDFF of the pancreas between T1D and both T2D and controls. The frequency and mean secretion grade of the pancreatic juice flow were significantly lower in T1D than in controls (p=0.016 and p=0.019, respectively). In clinical data, the values of C-peptide and pancreatic enzymes in T1D were significantly lower than those in T2D. Regarding MRI measurements in T2D, the averaged SIR on FS-T1WI was significantly lower (p=0.006) and the averaged PDFF of the pancreas was significantly higher (p=0.029) than those in controls. However, no significant differences were found in the pancreatic AP diameters, the averaged ADC value and T1 value of the pancreas, and both the frequency and mean secretion grade of the pancreatic juice flow between T2D and controls.Discussion
Our findings showed that the pancreatic size was reduced in T1D patients as compared to T2D and controls. This result may be explained by deficiency of insulin, a potent growth hormone, and decreased number of acinar cells in T1D pancreas, supported by clinical data of decreased C-peptide and pancreatic enzymes in T1D patients. Also, reduced pancreatic juice flow associated with pancreatic exocrine insufficiency was inevitably observed in T1D patients. These findings were not found in T2D patients with preserved secretion of the insulin and pancreatic enzymes in this study. The SIR of the pancreas on T1WI associated with pancreatic fibrosis 4 were significantly reduced in T1D and T2D patients than controls. In addition, the T1 value and ADC value were significantly increased in T1D patients in comparison with T2D patients and controls, while differences were not found between T2D patients and controls. These results suggest a marked decrease in pancreatic cellular density and markedly increased pancreatic fibrosis in T1D patients and mild changes of these in T2D patients. Pancreatic fat content was increased only in T2D patients, which might reflect a paracrine effect of insulin that can induce fat deposition in pancreas.Conclusion
Patients with T1D had reduced pancreatic size, increased pancreatic T1 and ADC values, and decreased pancreatic juice flow on cine-dynamic MRCP. Patients with T2D had increased pancreatic fat content.Acknowledgements
No acknowledgement found.References
1. Garcia TS, Rech TH, Leitão CB. Pancreatic size and fat content in diabetes: A systematic review and meta-analysis of imaging studies. PLoS One. 2017;12(7):e0180911.
2. Noda Y, Goshima S, Tsuji Y, et al. Correlation of quantitative pancreatic T1 value and HbA1c value in subjects with normal and impaired glucose tolerance. J Magn Reson Imaging. 2019;49(3):711-8.
3. Higashi M, Tanabe M, Yonezawa T, et al. The pancreatic exocrine function in patients with pancreatic endocrine insufficiency: the evaluation with cine-dynamic magnetic resonance cholangiopancreatography using a spatially selective inversion-recovery pulse and T1 mapping. 2022;40(7):696-702.
4. Noda Y, Goshima S, Tanaka K, et al. Findings in pancreatic MRI associated with pancreatic fibrosis and HbA1c values. J Magn Reson Imaging. 2016 Mar;43(3):680-7.
Figures