4734
Lipid Biosynthesis as a Biomarker of Metformin Treatment in Renal Tumor Cells Using Stable Isotope Resolved Metabolomics and High Field NMR1Clinical Cancer Metabolism Facility, National Cancer Institute, Washington, DC, United States, 2National Cancer Institute, Bethesda, MD, United States, 3University of Kentucky, Lexington, KY, United States
Synopsis
Keywords: Biology, Models, Methods, Metabolism
Motivation: NMR-based analyses of lipids can reveal the sources and pathways contributing to lipid biosynthesis in cells grown in the presence of 13C-labeled tracers.
Goal(s): Our goal was to determine whether treatment of FLCN-deficient renal cell carcinoma (RCC) cells with the Complex I inhibitor metformin modulated cellular biosynthesis of lipids.
Approach: We utilized 1H-13C HSQC NMR analysis of cellular lipids in FLCN-deficient tumor cells to assess incorporation of acetyl groups derived 13C6-glucose or 13C515N2-L-glutamine into cellular lipids during treatment with metformin.
Results: We observed a sharp decrease in incorporation of 13C-glucose-derived carbon into lipid acyl chains and cholesterol methyl groups following metformin treatment.
Impact: We found that metformin decreased synthesis of lipids from glucose while enhancing lipid synthesis from glutamine in renal tumor cells. These findings demonstrate that targeting Complex I may be a promising therapeutic avenue for treatment and prevention of FLCN-deficient RCC.
Introduction
Germline mutations in the FLCN gene cause Birt-Hogg-Dubé syndrome (BHD), an autosomal dominant inherited syndrome in which patients are at risk of developing dermal fibrofolliculomas, pulmonary cysts, and multifocal renal tumors [1]. While multiple signaling pathways including AKT-mTOR, AMPK, and TFE3/TFEB transcriptional activation have been implicated in the pathogenesis of BHD tumors [2], few studies have investigated the activity of central metabolite pathways and lipid biosynthesis in FLCN-deficient tumors. We utilized NMR-based metabolomics approaches to investigate lipid biosynthesis in the FLCN-deficient renal tumor cell line UOK257, which was derived from a BHD patient.Methods
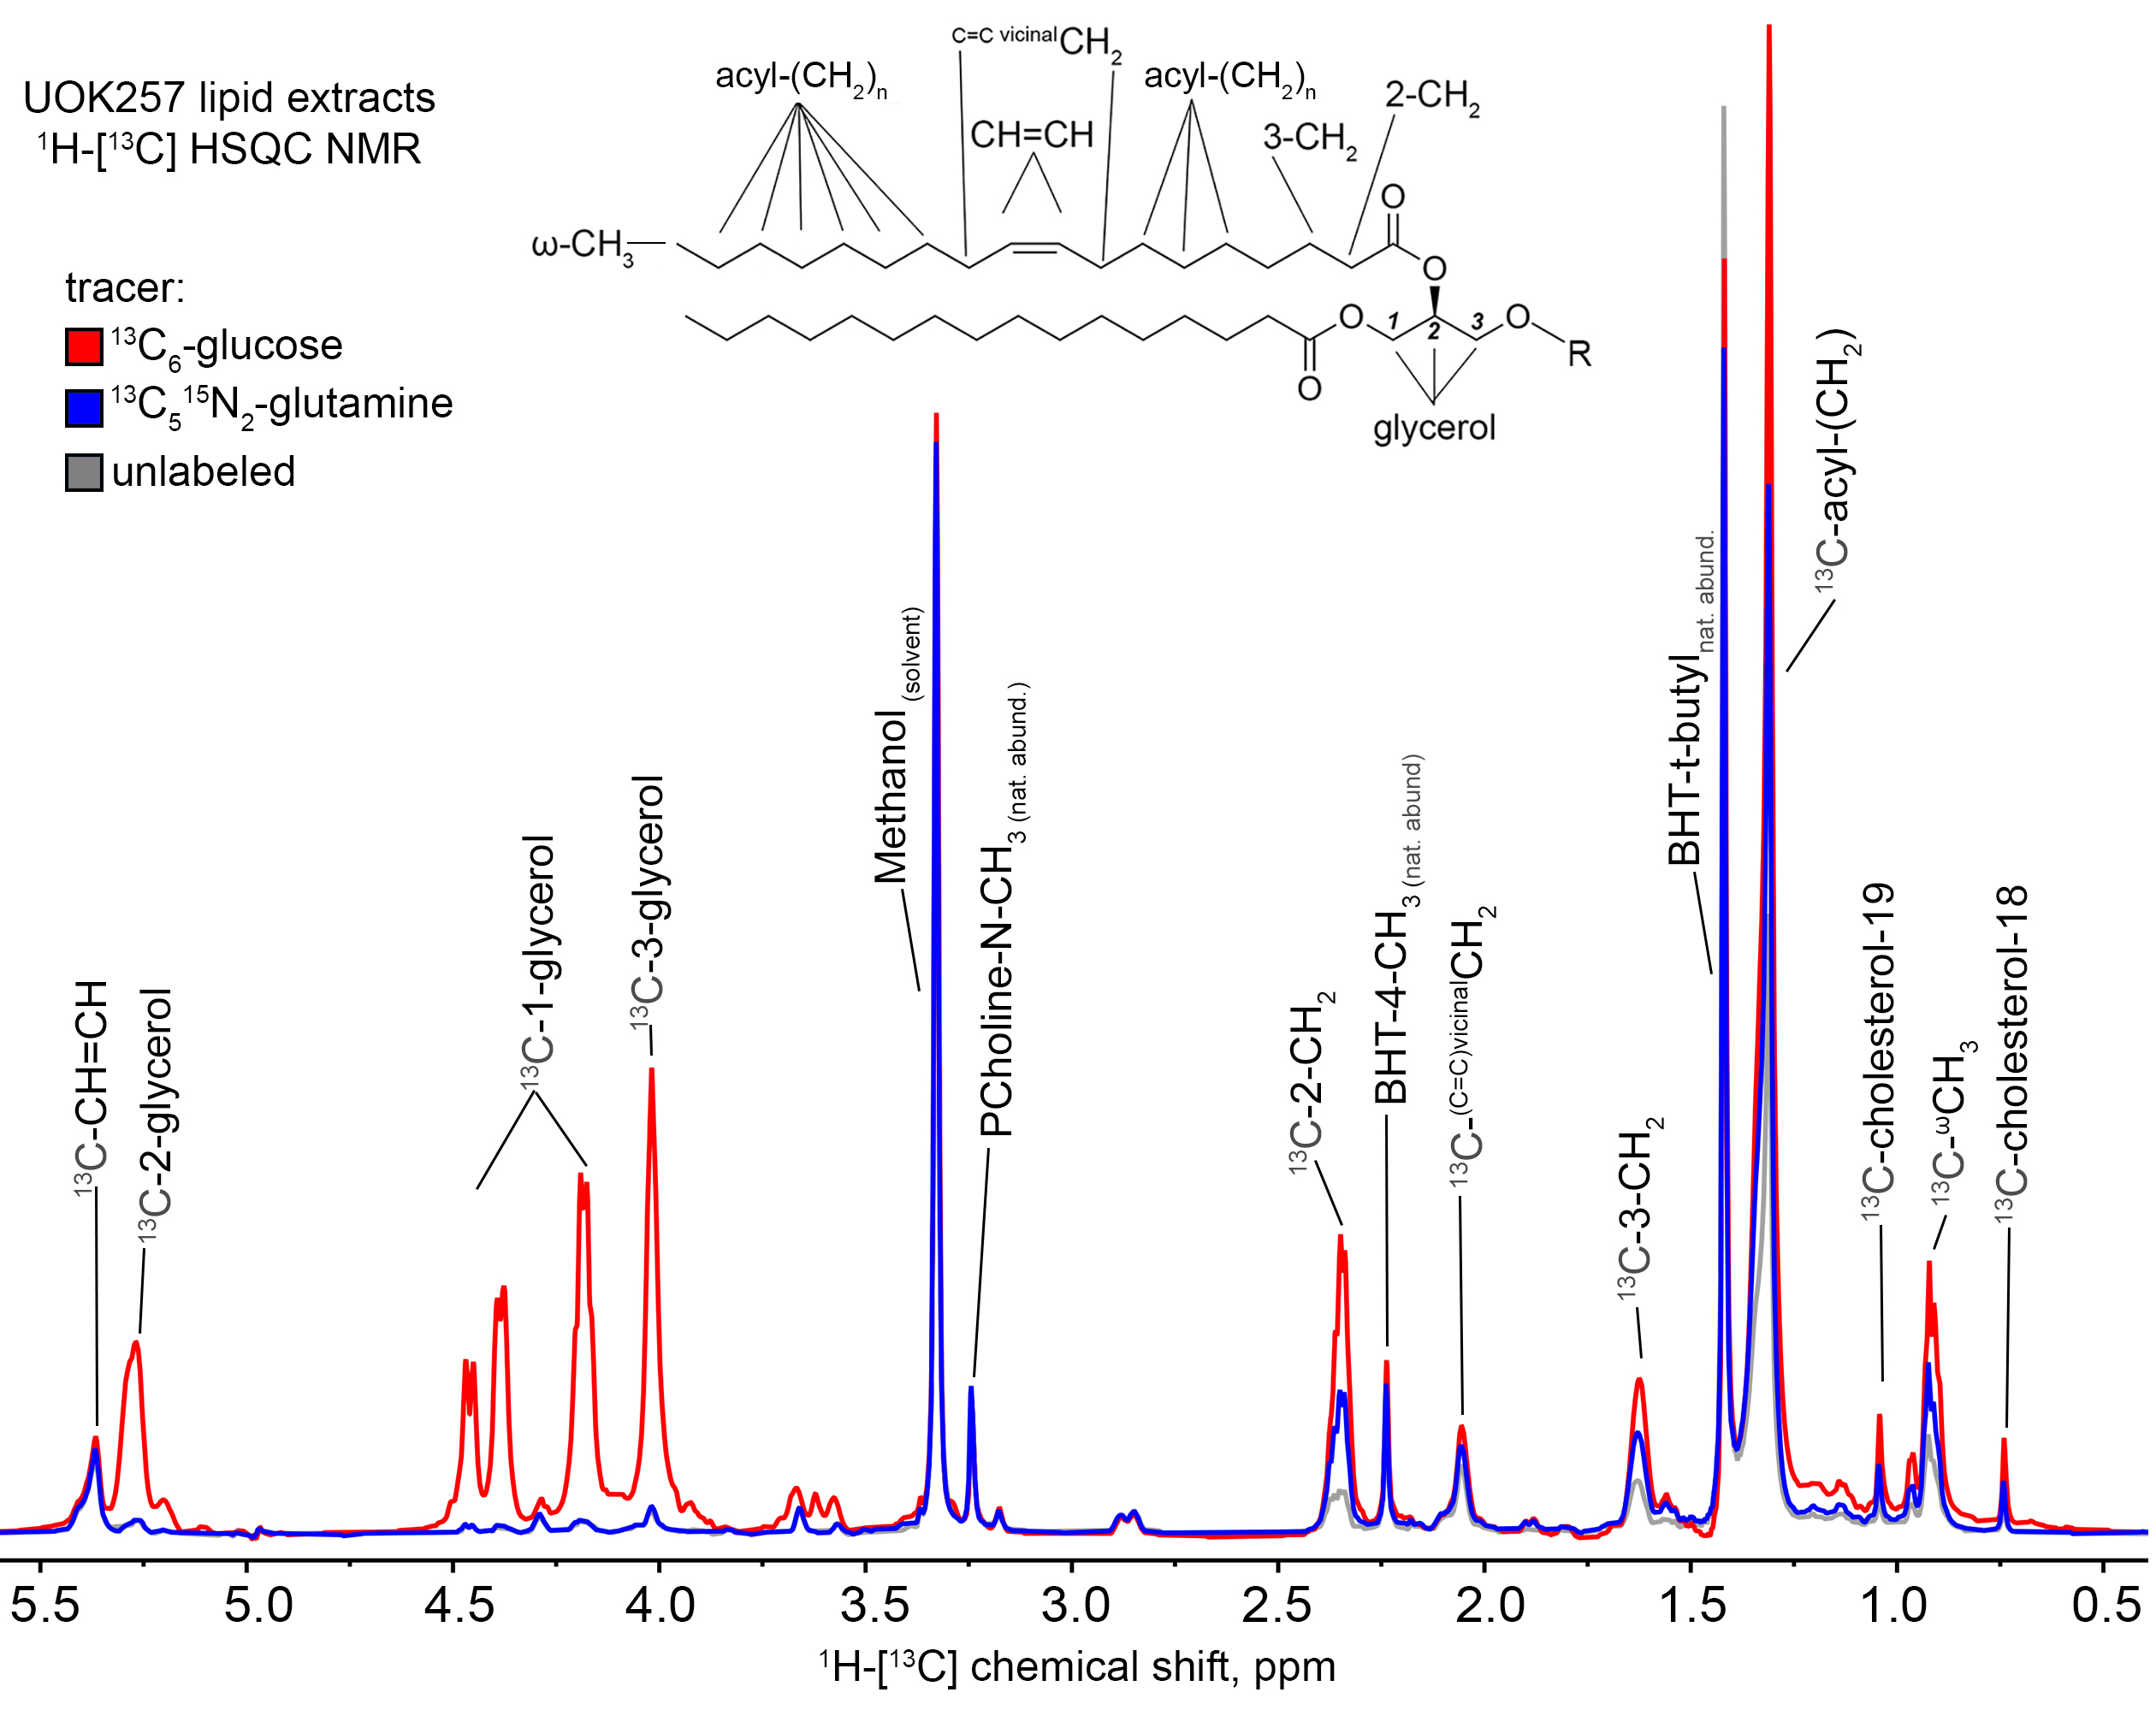
Tracer experiments were carried out with either 10 mM 13C6-glucose or 2mM 13C515N2-L-glutamine. Following 24h incubation, the cells were quenched and extracted in acetonitrile:water:chloroform (2:1.5:1) [3]. A 1:1 mixture of chloroform and methanol containing 1 mM butylated hydroxytoluene (BHT) was added to the non-polar fraction obtained from the extracts which were then evaporated to dryness. The resulting residues were dissolved in d4-methanol and transferred to disposable 3 mm Bruker SampleJet glass NMR tubes. 1H{13C}-HSQC spectra were recorded at 16.45T with an acquisition time of 0.2 s and a relaxation delay of 1.8 s, with adiabatic decoupling. The relative 13C content of different lipid functional group positions in the extracts were quantified where indicated and normalized to the methanol resonance, as well as to the natural abundance N-methyl phosphocholine resonance (3.23ppm) as a proxy of total lipid content in each sample [4].Results
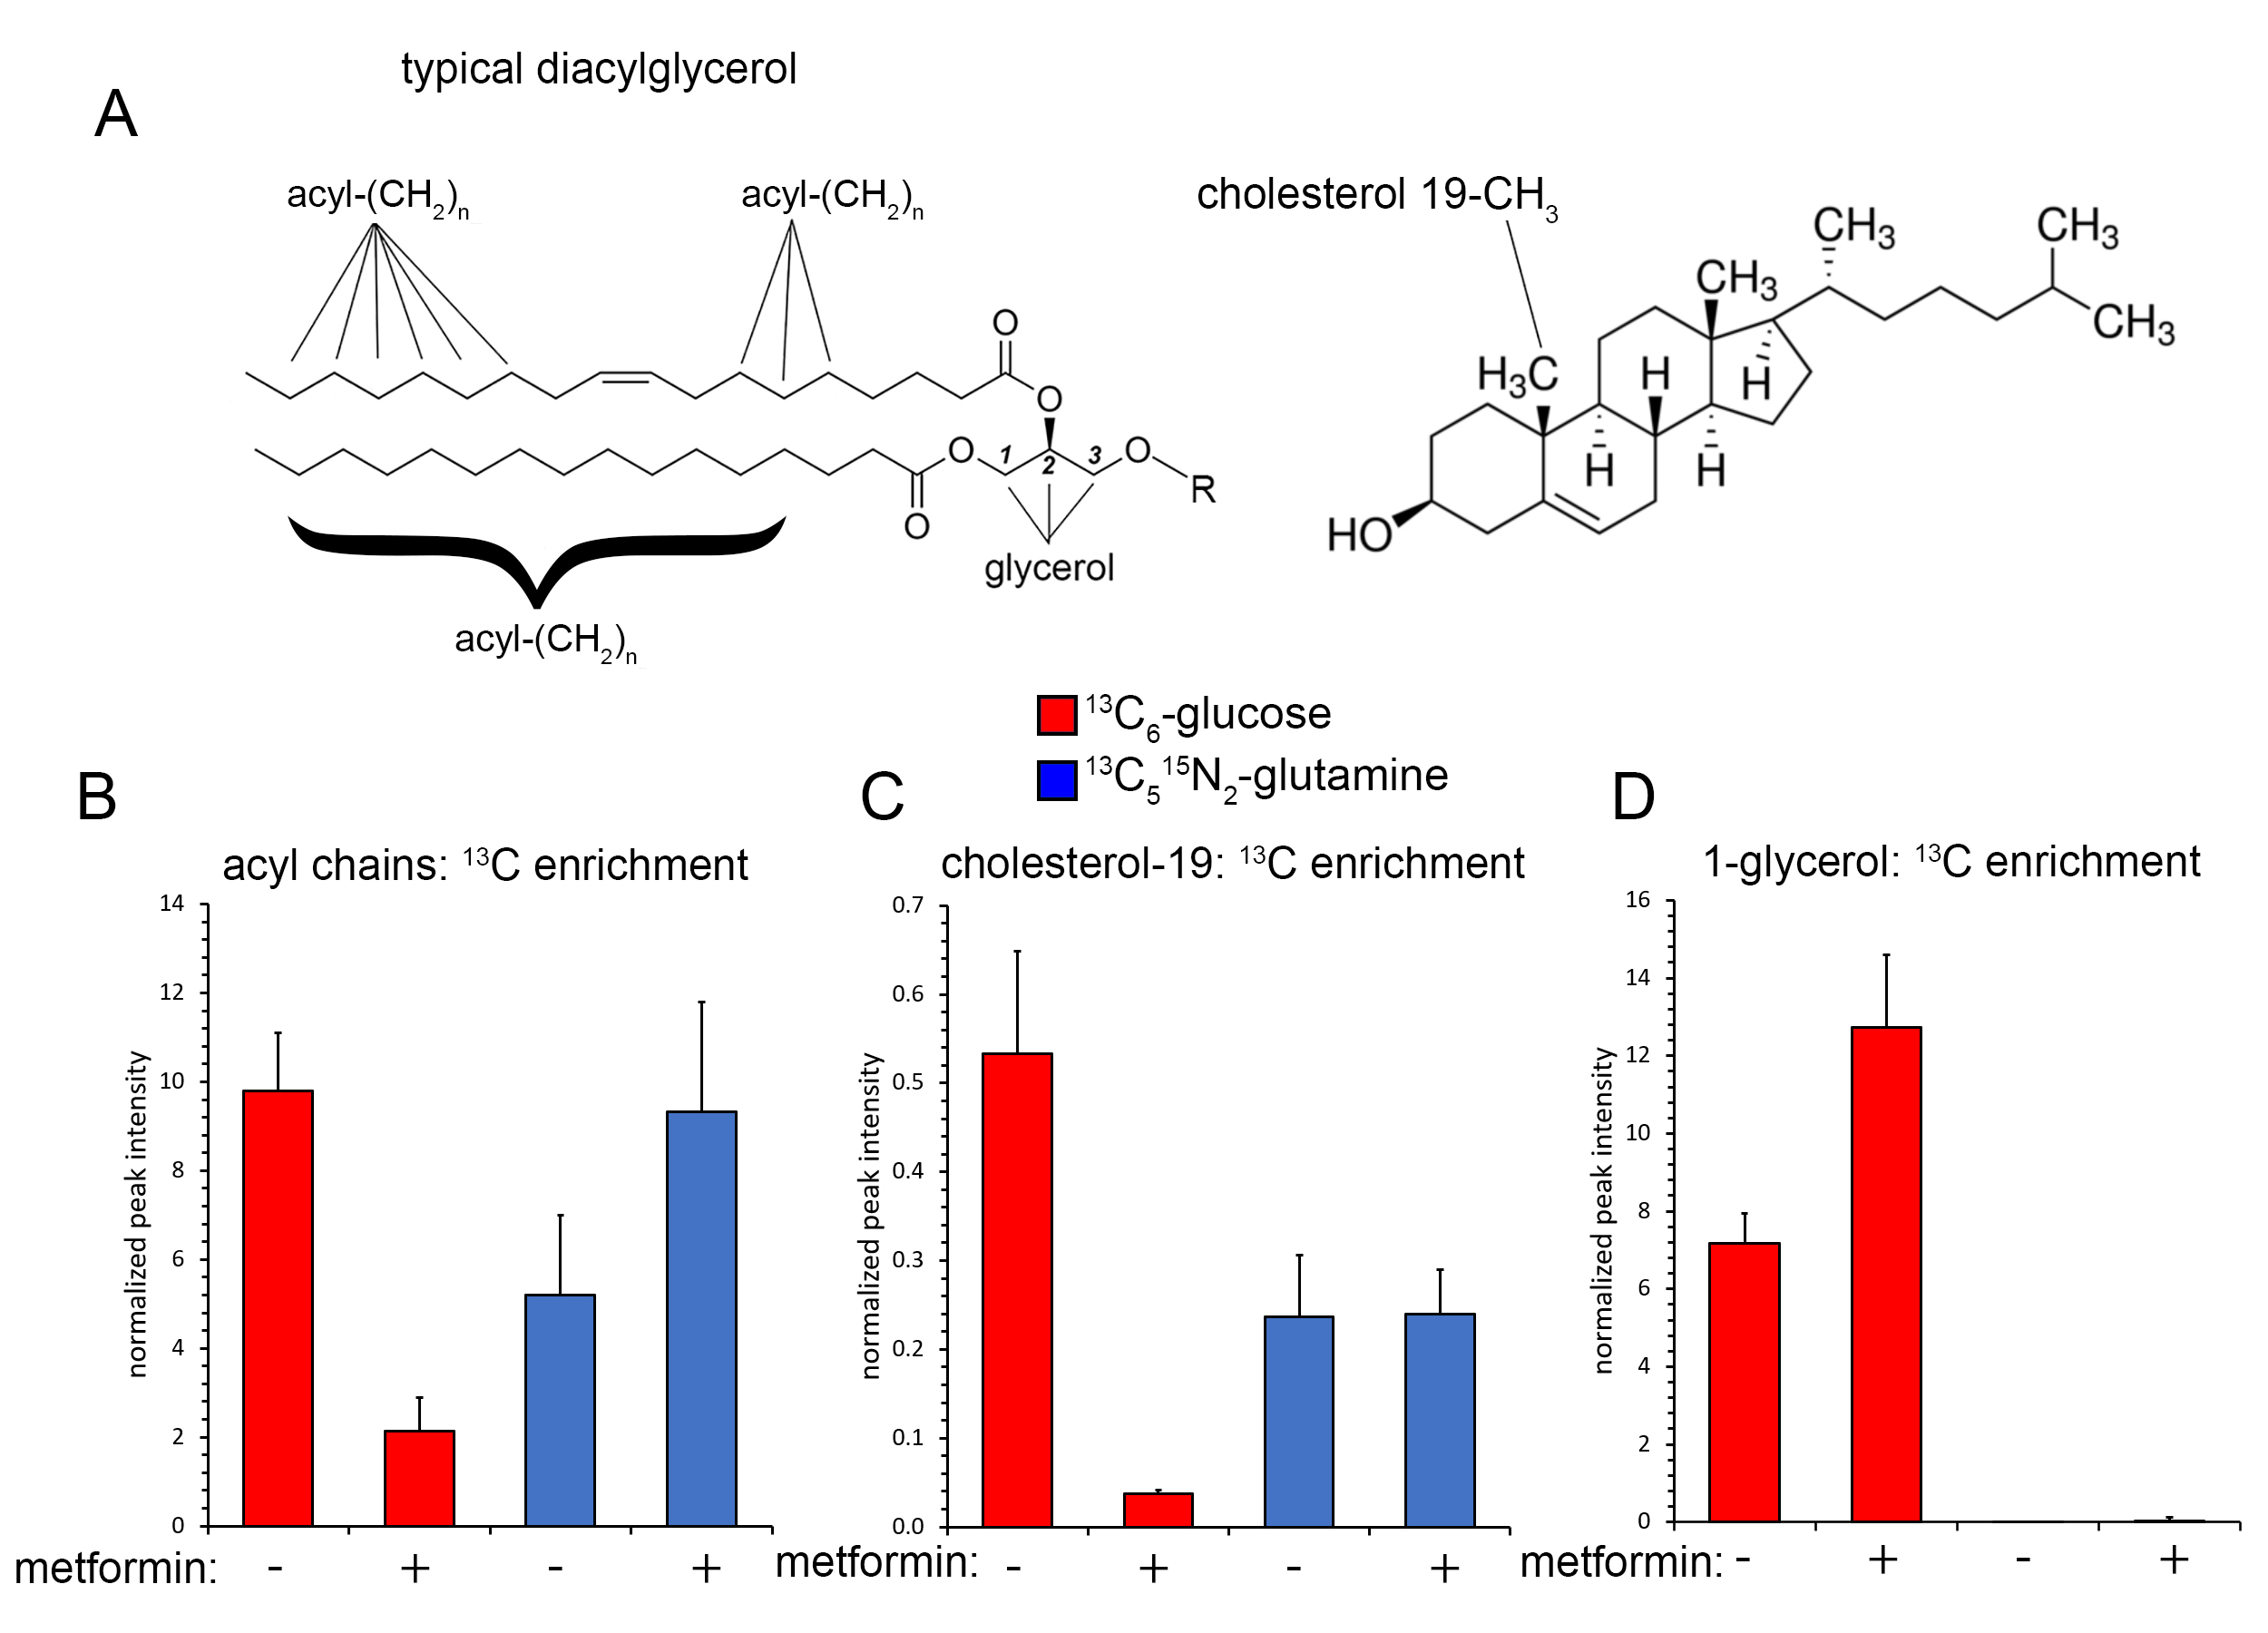
Incubation of UOK257 cells in the presence of 10 mM 13C6-glucose resulted in robust labeling of the glycerol resonances in lipids at 5.24, 4.45, 4.43, 4.17, and 4.00 ppm as measured by 1H{13C}-HSQC, whereas cells incubated with 13C515N2-L-glutamine did not show significant 13C labeling of glycerol (Figure 1). Resonances corresponding to acyl chain carbons (1.29ppm) including those proximal to the lipid head group (2.33 and 1.60ppm) and ω-methyl groups (0.9ppm) in 13C6-glucose and 13C515N2-L-glutamine labeled UOK257 cells showed significant 13C labeling as compared to spectra obtained from unlabeled cells (Figure 1). Metformin treatment resulted in an approximately 80% relative decrease in 13C incorporation into lipid acyl chains in UOK257 cells grown in the presence of 13C6-glucose (p<0.01; Figure 2B). In contrast, metformin non-significantly increased 13C incorporation into lipid acyl chain in cells grown in the presence of 13C5-glutamine (p=0.08; Figure 2B). Cholesterol synthesis from glucose was also greatly reduced to 7% of control in metformin-treated cells (p<0.01; Figure 2C), whereas utilization of glutamine-derived 13C for cholesterol biosynthesis was unchanged by metformin treatment.Discussion
Our data demonstrate that metformin induced a marked remodeling of cellular metabolism in FLCN-deficient tumor cells resulting in decreased utilization of glucose for lipid and cholesterol biosynthesis. In contrast, glutamine utilization for lipid formation proceeded in metformin treated cells, likely as a result of reductive carboxylation of glutamine to form citrate. Given that metformin is a known inhibitor of Complex I, and that FLCN-deficient tumors contain abundant and active mitochondria, we propose that metformin may be a promising therapeutic avenue for treatment and prevention of FLCN-deficient renal tumors.Acknowledgements
This work was supported by the NCI Intramural Research Program.References
1. Vocke, C.D., et al., High frequency of somatic frameshift BHD gene mutations in Birt-Hogg-Dube-associated renal tumors. J Natl Cancer Inst, 2005. 97(12): p. 931-5.
2. Linehan, W.M., et al., The Metabolic Basis of Kidney Cancer. Cancer Discov, 2019. 9(8): p. 1006-1021.
3. Crooks, D.R., T.W. Fan, and W.M. Linehan, Metabolic Labeling of Cultured Mammalian Cells for Stable Isotope-Resolved Metabolomics: Practical Aspects of Tissue Culture and Sample Extraction. Methods Mol Biol, 2019. 1928: p. 1-27.
4. Lin, P., et al., NMR Methods for Determining Lipid Turnover via Stable Isotope Resolved Metabolomics. Metabolites, 2021. 11(4).
Figures