4731
Unveiling Metabolite Alterations in Photon-Irradiated Tramp C1 Cells via Hyperpolarized 13C NMR1Research Center for Radiation Medicine, Chang Gung University, Taoyuan, Taiwan, 2Clinical Metabolomics Core Laboratory, Chang Gung Memorial Hospital, Linkou, Taoyuan, Taiwan, 3Department of Medical Imaging and Intervention, Chang Gung Memorial Hospital, Linkou, Taoyuan, Taiwan
Synopsis
Keywords: Probes & Targets, Hyperpolarized MR (Non-Gas)
Motivation: Investigating metabolic changes in glycolysis within Tramp C1 cells due to photon irradiation, focusing on the role of HP 13C pyruvate.
Goal(s): To determine how photon irradiation affects pyruvate-to-lactate flux in vitro, indicating metabolic reprogramming.
Approach: Utilizing benchtop NMR to monitor HP 13C dynamics in irradiated versus control cells, targeting lactate production.
Results: Photon irradiation elevated 13C lactate production by two-fold on Day 0, with persistently higher levels observed on Day 3, signifying altered metabolic flux post-irradiation.
Impact: This study's findings reveal photon irradiation's potent effect on cellular metabolism, potentially influencing radiation therapy strategies. It opens avenues for targeted metabolic interventions and underscores the metabolic resilience in Tramp C1 cells, crucial for cancer treatment optimization.
INTRODUCTION
The intricate mechanisms by which cellular metabolism responds to external stressors such as photon irradiation are pivotal to understanding and potentially manipulating cell fate in various medical applications, including cancer therapy. The glycolytic pathway, a central metabolic pathway, is particularly susceptible to such stressors, and thus, serves as an excellent indicator of cellular metabolic reactivity [1,2]. The Tramp C1 cell line, a model for prostate cancer, offers a unique opportunity to study these metabolic responses due to its well-characterized physiology [3]. By employing Hyperpolarized (HP) 13C pyruvate, a non-radioactive isotope used in dynamic nuclear polarization, we can observe the real-time metabolic flux between pyruvate and lactate—a critical aspect of glycolysis [4]. This study aims to elucidate the metabolic variations in Tramp C1 cells induced by photon irradiation.METHODS
Our study utilized a two-group experimental design: an irradiated set of Tramp C1 cells and a non-irradiated control group (n=3). The irradiated cells were exposed to a total radiation dose of 2 Gy using 6-MV X-rays from a linear accelerator, a standard model for clinical radiotherapy. Following irradiation, HP 13C pyruvate samples were prepared using a clinical hyperpolarizer (SPINlab; GE Healthcare), operating at a temperature of 0.8 K and a magnetic field strength of 5 T, to achieve significant nuclear spin polarization. This enhanced nuclear spin alignment allows for increased signal detection in magnetic resonance imaging and spectroscopy.For the detection and analysis of the HP 13C dynamic signal, we employed Magritek’s Spinsolve 43 MHz benchtop NMR, calibrated to a flip angle of 10 degrees and a repetition time of 2.0 seconds. These parameters were meticulously chosen to provide a robust signal-to-noise ratio, facilitating the precise quantification of metabolic changes. Signal measurements were conducted on Day 0 (n=3), immediately after irradiation, and on Day 3 post-irradiation (n=1), to monitor both the immediate and delayed metabolic responses to the photon irradiation.
We quantified the apparent exchange rates from pyruvate to lactate using kinetic modeling and integration of the area under the curve from the resultant HP 13C signal plot [5]. This allowed us to deduce the metabolic alterations and compare the glycolytic flux between the irradiated and control Tramp C1 cells effectively.
RESULTS
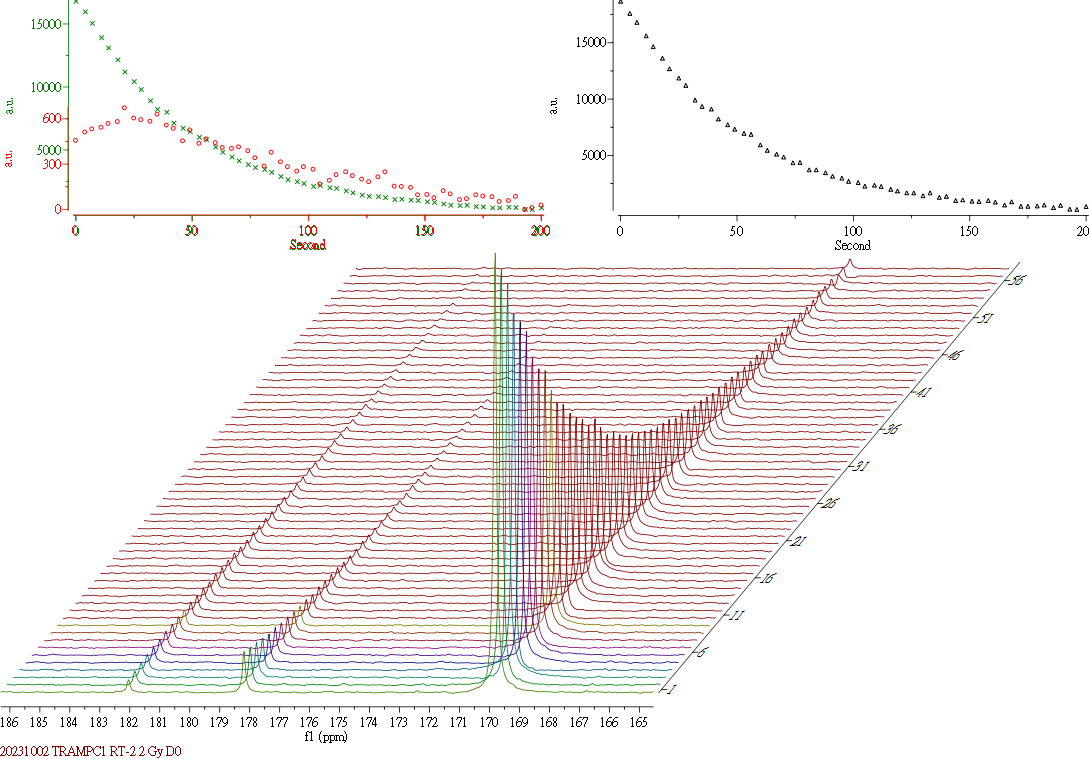
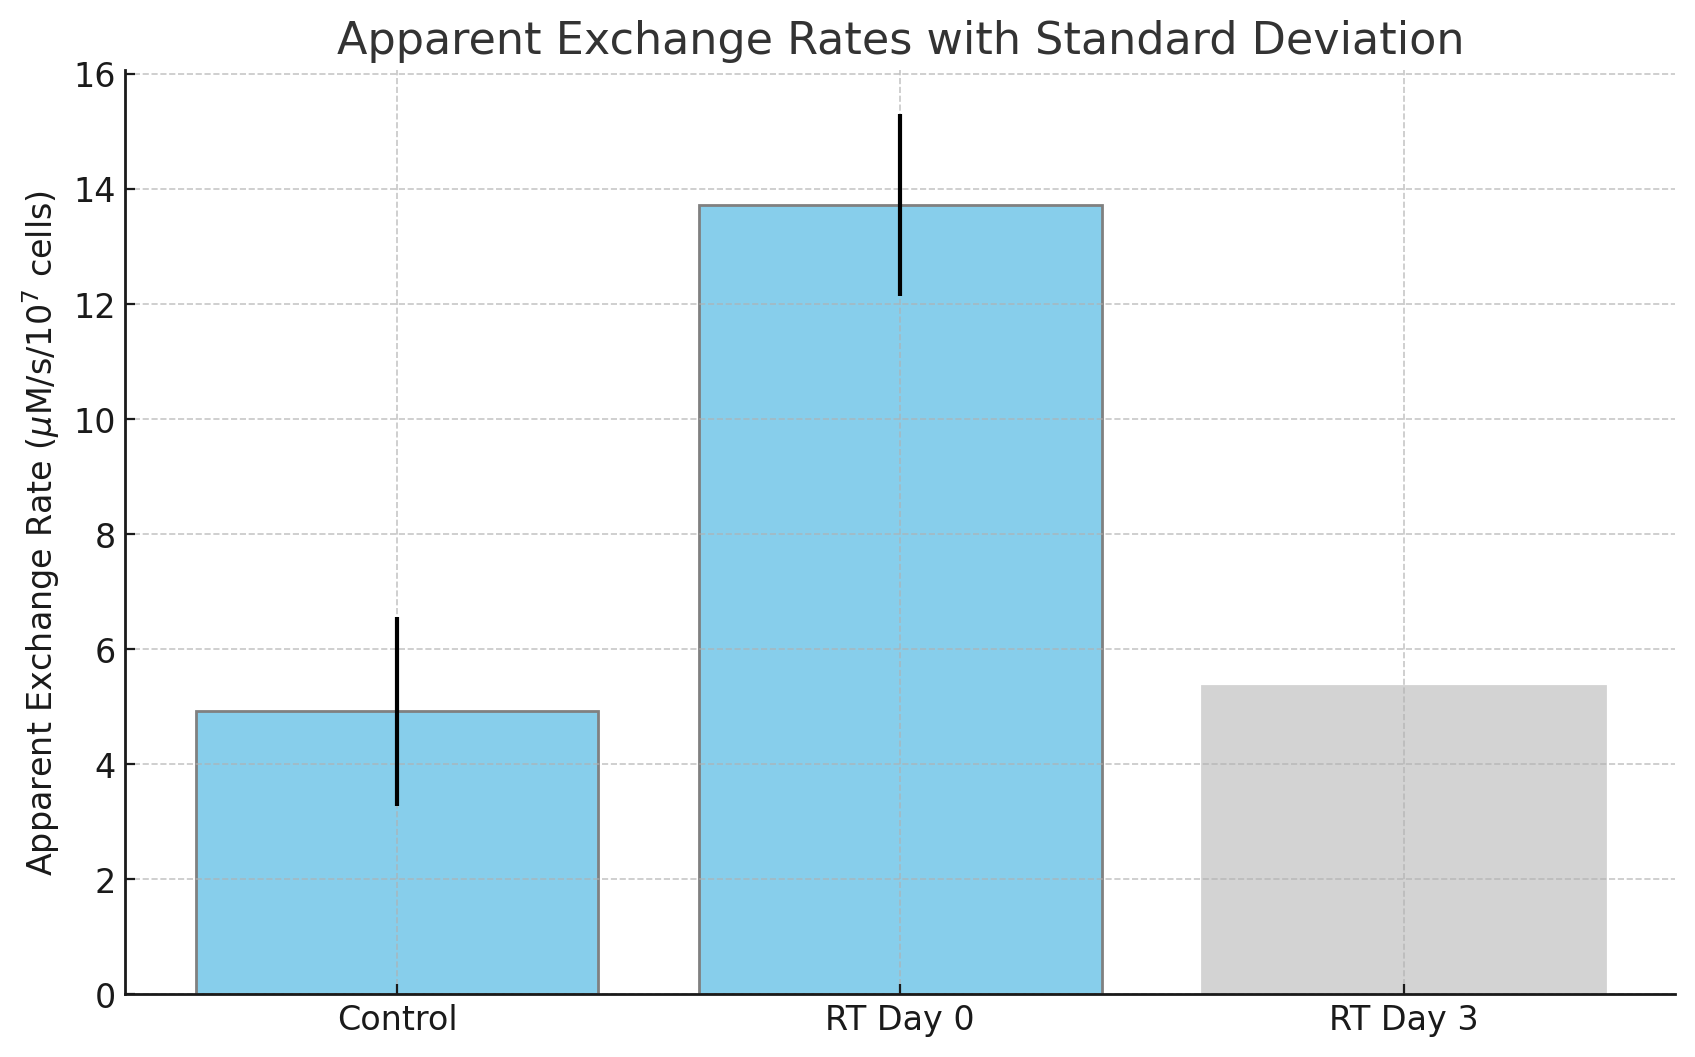
The analysis revealed a marked increase in 13C lactate production in the photon-irradiated group compared to the control group, with an approximate two-fold increase observed on Day 0. This enhanced lactate production directly correlates with the photon irradiation event, suggesting a substantial shift in metabolic flux towards glycolysis. By Day 3, the irradiated group continued to exhibit increased lactate production, albeit to a lesser extent, indicating a sustained metabolic response to the initial irradiation. These findings were visually represented in a time series plot (Figure 1) and quantitatively summarized in a bar chart (Figure 2), providing clear evidence of the metabolic variation between the two groups.DISCUSSION
The observed metabolic alterations following photon irradiation indicate an increased glycolytic activity, which is consistent with the "Warburg effect" often noted in cancer cells, where there is a propensity towards glycolysis even under aerobic conditions. The immediate increase in lactate production post-irradiation (Day 0) could be interpreted as a stress response, with cells rapidly upregulating glycolysis to meet the increased energy demands for repair processes. The sustained elevation on Day 3 suggests a possible adaptation or a lingering effect of the irradiation. The use of HP 13C pyruvate in this context allowed for the non-invasive tracking of this metabolic shift, highlighting the potential of HP 13C NMR spectroscopy as a tool for real-time analysis of cellular metabolism following irradiation. These results have significant implications for understanding the metabolic strategies employed by cancer cells in response to radiation therapy.CONCLUSION
This study successfully demonstrates the use of HP 13C pyruvate in conjunction with benchtop NMR spectroscopy to observe in vitro metabolic variations in Tramp C1 cells resulting from photon irradiation. The increased lactate production observed provides insight into the metabolic reprogramming that occurs in response to irradiation, potentially offering a window into the cellular mechanisms of radiation resistance. Such knowledge could inform the development of more effective therapeutic strategies that target metabolic pathways in cancer treatment. Future research could expand on these findings by exploring the long-term metabolic consequences of irradiation and the potential for metabolic interventions to enhance radiotherapy outcomes.Acknowledgements
The authors express their thanks to the great support from SanKing Technology Co., Ltd, and Albert Chen, PhD in GE Research Circle Technology. Transgenic adenocarcinoma of mouse prostate (Tramp-C) cancer cells cells and the cell irradiation were supported by the Radiation Research Core Laboratory of the Research Center for Radiation Medicine, Chang Gung University/Chang GungMemorial Hospital, Linkou.References
1. Chaumeil, M.M.; Najac, C.; Ronen, S.M. Studies of metabolism using 13 C MRS of hyperpolarized probes. Methods Enzymol. 2015,561, 1–71.
2. Merritt, M.E.; Harrison, C.; Storey, C.; Jeffrey, F.M.; Sherry, A.D.; Malloy, C.R. Hyperpolarized 13 C allows a direct measure of fluxthrough a single enzyme-catalyzed step by NMR. Proc. Natl. Acad. Sci. USA 2007, 104, 19773–19777.
3. Haughey CM, Mukherjee D, Steele RE, Popple A, Dura-Perez L, Pickard A, Patel M, Jain S, Mullan PB, Williams R, Oliveira P, Buckley NE, Honeychurch J, S McDade S, Illidge T, Mills IG, Eddie SL. Investigating Radiotherapy Response in a Novel Syngeneic Model of Prostate Cancer. Cancers (Basel). 2020 Sep 29;12(10):2804.
4. Lai Y-C, Hsieh C-Y, Lu K-Y, Sung C-H, Ho H-Y, Cheng M-L, Chen AP, Ng S-H, Chen F-H, Lin G. Monitoring Early Glycolytic Flux Alterations Following Radiotherapy in Cancer and Immune Cells: Hyperpolarized Carbon-13 Magnetic Resonance Imaging Study. Metabolites. 2021; 11(8):518.
5. Daniels, C.J.; McLean, M.A.; Schulte, R.F.; Robb, F.J.; Gill, A.B.; McGlashan, N.; Graves, M.J.; Schwaiger, M.; Lomas, D.J.;Brindle, K.M.; et al. A comparison of quantitative methods for clinical imaging with hyperpolarized 13 C-pyruvate. NMR Biomed.2016, 29, 387–399.
Figures