4730
Investigating the Predictive Power of Oxygen-Enhanced MRI to Assess Radio-sensitivity in a Murine Model of Oral Carcinoma1Radiotherapy and Imaging, The Institute of Cancer Research, London, United Kingdom
Synopsis
Keywords: Biology, Models, Methods, Head & Neck/ENT, Oxygen-enhanced MRI, Hypoxia, Radiation, Biomarker
Motivation: Tumour hypoxia is associated with radioresistance and is a negative factor in the prognosis of oral cavity squamous cell carcinoma. Non-invasive methods to rapidly quantify the extent and heterogeneity of tumour hypoxia would offer clinical benefit in treatment planning.
Goal(s): To assess the utility of oxygen-enhanced (OE-) MRI to image hypoxia and provide predictive imaging biomarkers of radiation response.
Approach: OE-MRI was performed in murine oral carcinoma allografts prior to 8Gy irradiation, and relationships with subsequent overall tumour response sought.
Results: Tumours exhibiting voxels with a marked hyperoxia-induced reduction in R2* yet negligible ΔR1 were more radiosensitive.
Impact: OE-MRI revealed extensive hypoxia in murine oral carcinoma allografts, and have the potential to predict tumour radiosensitivity based on the combined degree of hypoxia and haemodynamic vasculature.
Introduction
Oral cavity squamous cell carcinoma (OSCC) represents a prominent subset of head and neck cancers. An important negative prognostic factor in OSCC is hypoxia1,2, which is associated with resistance to radio-,3,4 chemo-5 and immunotherapy6, and mediates metastasis7,8.Oxygen-enhanced (OE)-MRI has been exploited to map and quantify tumour hypoxia and its response to radiotherapy9-11. OE-MRI relies on quantifying changes in the longitudinal MRI relaxation rate R1 induced by excess paramagnetic oxygen molecules dissolved in blood plasma and interstitial fluid with inhalation of oxygen. Previously, OE-MRI coupled with susceptibility-contrast MRI has been utilized to quantify the degree and spatial distribution of hypoxia in syngeneic murine oral carcinomas (MOC), in which perfused tumour sub-volumes refractory to hyperoxia-induced changes in R1, termed ‘pOxyR’, were associated with histologically-confirmed hypoxia12.
In this study, the utility of OE-MRI to provide predictive imaging biomarkers of overall response to radiotherapy in a MOC model was investigated.
Methods
MOC1 cells (1x10⁶) were injected subcutaneously into the right flanks of female C57BL/6J mice. MRI was performed on a Bruker 7T horizontal bore MRI system, using a 40mm birdcage coil, when tumours reached ~150–200 mm3 measured using callipers and the ellipsoid formula π/6.abc.Prior to OE-MRI, multi-slice T2-weighted RARE images (TR/TE=4.5s/36ms) were acquired. T1 (IR-TrueFISP, TR/TE=3.4/1.7ms, 50 TIs: 72.1-2738ms) and R2* (MGE, 8 echoes, TR/TEs=200/3-24ms) were quantified from a central 1mm transverse tumour slice under air and subsequently 100% oxygen-breathing. This was followed by intravenous administration of USPIO particles (ferumoxytol, 150μmol Fe/kg) and acquisition of a final set of MGE images. The USPIO-induced ΔR2*_Fe was used for determination of fractional blood volume (fBV) and to provide a perfusion mask. Parametric R1 (1/T1), R2* and fBV maps were calculated voxel wise for tumour ROIs using in-house software (ImageView running in IDL, and MATLAB R2023a). The ΔR1 maps were binarised to identify voxels that were enhanced (OxyE) or refractory (OxyR) to hyperoxia, and these maps were combined with fBV to identify perfused voxels refractory to hyperoxia (pOxyR)11.
The following day the mouse tumours were either irradiated with a single 8Gy dose (treated, n=12) administered using a small animal radiation research platform (SARRP, XStrahl), or imaged with cone beam CT only (control, n=11). Tumour volume was subsequently monitored to licence limits, and the time taken to reach 2x the pre-treatment volume was used to assess individual tumour radiation response.
Results and Discussion
Parametric maps of baseline R2*, oxygen-induced ΔR2*_O2, USPIO-induced ΔR2*_Fe and fBV from three MOC1 tumours, and a summary of the quantitative data determined from the entire cohort pre-irradiation, are shown in Figure 1. Baseline R1, hyperoxia-induced ΔR1_O2, OxyE/OxyR oxygen enhancement maps and perfused pOxyE/pOxyR maps from the same MOC1 tumours are shown in Figure 2. Evaluation of the maps and quantification of the OE-MRI metrics suggests that tumour perfusion and hypoxia in these MOC1 tumours present a wide range of intra- and inter-tumoural heterogeneity, consistent with previously reported data from this model12.Individual tumour growth curves for irradiated and control mice from the day of imaging to endpoint are shown in Figure 3A. Scatter plots of the time taken for each tumour to progress to 2x the pre-irradiation volume against ΔR2*_O2, OxyR and OxyE are shown in Figure 3B. Whilst the clustering of the irradiated and control cohorts shows that a single 8Gy dose elicited tumour growth delay for the majority of treated mice, no clear relationship with the OE-MRI metrics was apparent. This may reflect a balance between hypoxia-associated radioresistance (OxyR) and the normoxic fraction of tumour (OxyE), which may experience radiation-induced DNA damage13 that may or may not be repaired depending on regional oxygen perfusion levels (ΔR2*_O2). The bubble-plot shown in Figure 3C indicates that tumours that are highly perfused (where more negative values of ΔR2*_O2 represent higher perfusion) and are moderately hypoxic (OxyR in the range of 52-75%) were more radiosensitive.
To understand the contribution of perfusion in assessing radiosensitivity, the time taken for each tumour to progress to 2x the pre-irradiation volume plotted against fBV, pOxyR and pOxyE, and the corresponding bubble plot, are shown in Figure 4. This suggests that relatively radiosensitive MOC1 tumours have a pOxyR ~35% and fBv < 6%.
Conclusion
OE-MRI revealed extensive hypoxia in the MOC1 tumour model, consistent with the expected phenotype for OSCC. Our study reveals that OE-MRI data can predict the radiosensitivity in a heterogeneously hypoxic tumour model. Binarisation of OE-MRI data with a perfusion mask does not seemingly provide additional information relating to radiosensitivity.Acknowledgements
We acknowledge support from Cancer Research UK grant C16412/A27725 and The Barrow Neurological Foundation.References
1. Sorensen BS & Horsman MR. Tumor hypoxia: impact on radiation therapy and molecular pathways. Front Oncol. 2020; 10: 562.
2. Judd NP et al. ERK1/2 regulation of CD44 modulates oral cancer aggressiveness. Cancer Res. 2012; 72: 365-74.
3. Brizel DM et al. Tumor hypoxia adversely affects the prognosis of carcinoma of the head and neck. Int. J. Radiat. Oncol. 1997; 38: 285–89.
4. Nordsmark M et al. Prognostic value of tumor oxygenation in 397 head and neck tumors after primary radiation therapy. An international multi-center study. Radiother. Oncol. 2005; 77: 18–24.
5. Shannon AM et al. Tumour hypoxia, chemotherapeutic resistance and hypoxia-related therapies. Cancer Treat. Rev. 2003; 29: 297–307.
6. Chouaib, S. et al. Hypoxic stress: obstacles and opportunities for innovative immunotherapy of cancer. Oncogene 2017; 36: 439–445.
7. Kademani D. Oral cancer. Mayo Clin Proc 2007; 82: 878–87.
8. Rogers SN et al. Survival following primary surgery for oral cancer. Oral Oncol. 2009; 45: 201–11.
9. O'Connor JPB et al. Oxygen-enhanced MRI accurately identifies, quantifies, and maps tumor hypoxia in preclinical cancer models. Cancer Res. 2016; 76: 787-795.
10. Salem A et al. Oxygen-enhanced MRI is feasible, repeatable, and detects radiotherapy-induced change in hypoxia in xenograft models and in patients with non-small cell lung cancer. Clin Cancer Res. 2019; 25: 3818-3829.
11. Little RA et al. Mapping hypoxia in renal carcinoma with oxygen-enhanced MRI: comparison with intrinsic susceptibility MRI and pathology. Radiology, 2018; 288: 739-747.
12. Roy U et al. Imaging hypoxia in murine oral cavity squamous cell carcinomas with oxygen-enhanced MRI. Proc. Intl. Soc. Mag. Reson. Med. 30, 2022.
13. Lomax et al. Biological consequences of radiation-induced DNA damage: relevance to radiotherapy. Clin. Oncol. 2013; 25: 578-585.
Figures
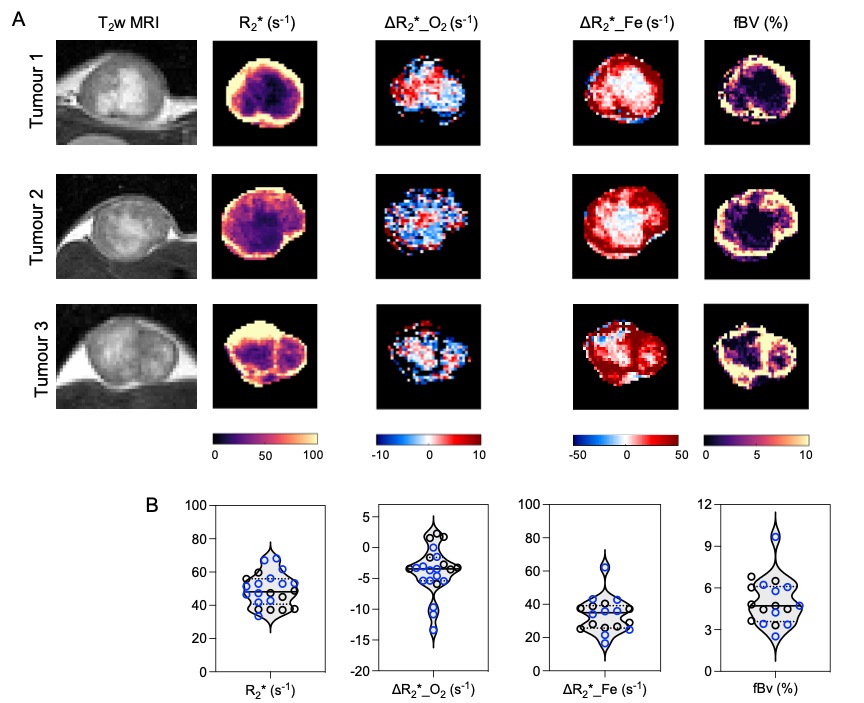
Figure 1: (A) T2-weighted images of three MOC1 tumours, and their associated parametric maps of baseline R2* on air, hyperoxia-induced ΔR2*_O2, USPIO-induced ΔR2*_Fe during oxygen inhalation, and fBV. (B) Quantitative summary of the pre-treatment data acquired from the entire MOC1 cohort (n=23), with subsequent irradiated and control tumours indicated in blue and black, respectively. Data points are median values from each individual tumour.
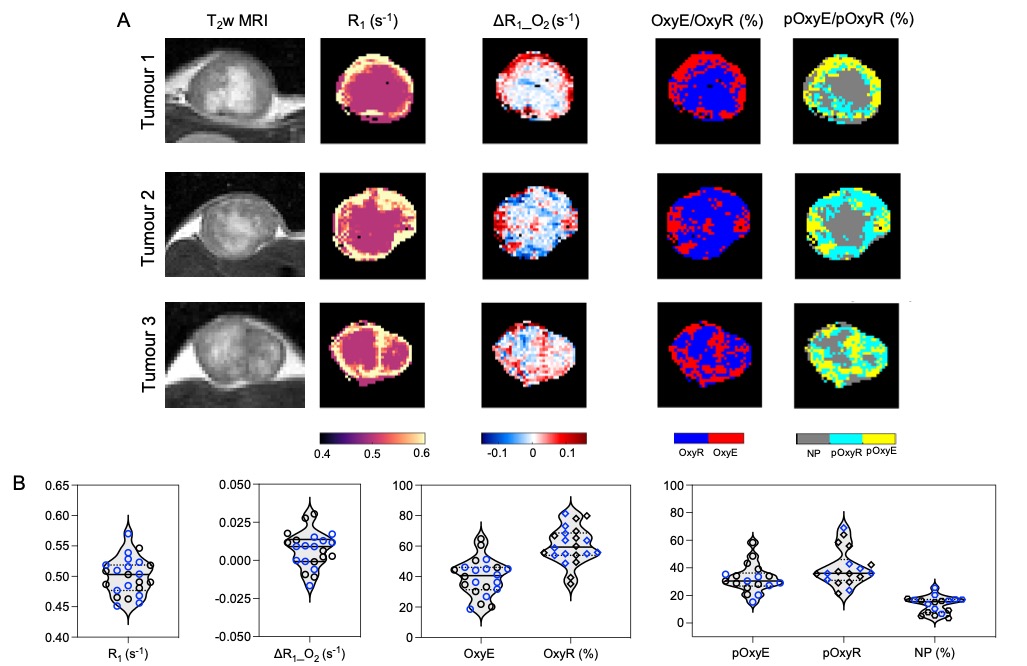
Figure 2: (A) T2-weighted images of three MOC1 tumours, and associated parametric maps of baseline R1 on air, hyperoxia-induced ΔR1_O2, OxyE-OxyR oxygen enhancement maps, and maps of perfused pOxyE-pOxyR and non-perfused (NP) voxels. (B) Quantitative summary of the pre-treatment data acquired from the entire MOC1 cohort (n=23), with subsequent irradiated and control tumours indicated in blue and black, respectively. Data points are median values from each individual tumour.
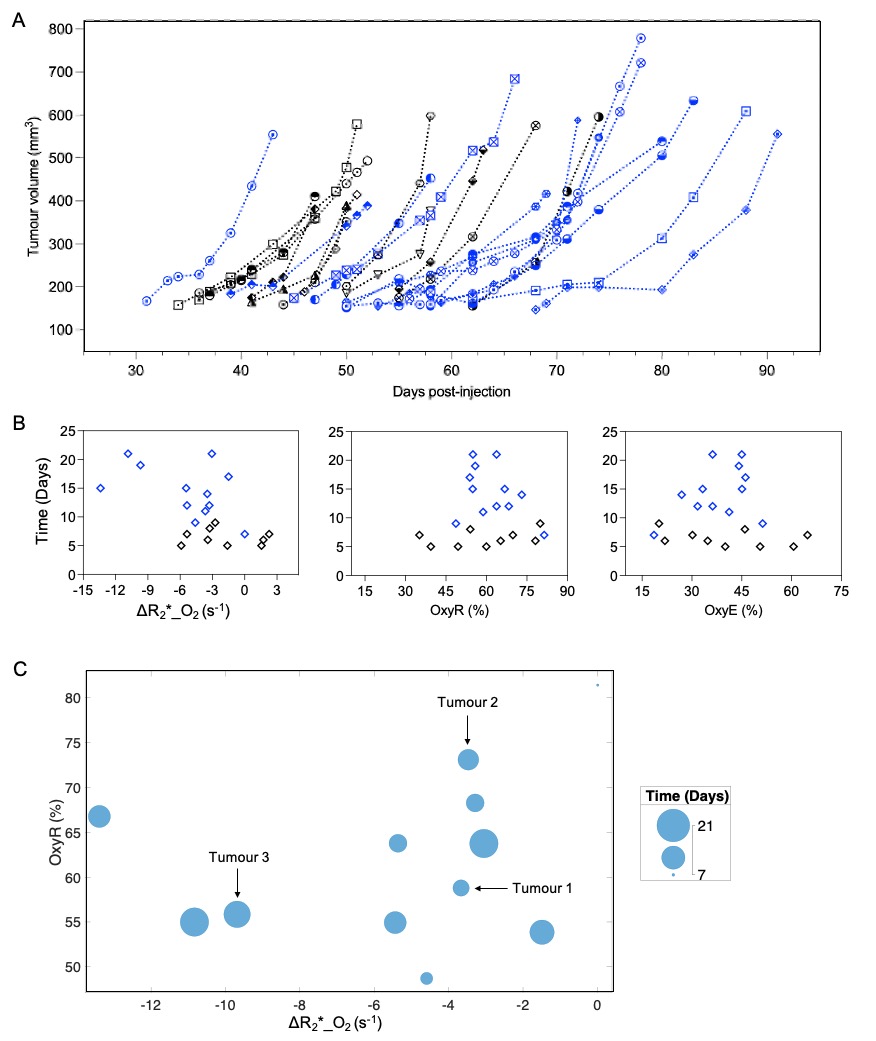
Figure 3: (A) Individual growth curves for irradiated (blue) and control (black) MOC1 tumours from the day of OE-MRI to endpoint. (B) Scatter plot of the time taken to reach 2x the pre-treatment tumour volume against ΔR2*_O2, OxyR and OxyE. (C) Bubble plot in MATLAB showing combined relationship between ΔR2*_O2, OxyR and the time taken to reach 2x the pre-treatment tumour volume. The relative positions of the three tumours in Figure 1 and 2 are indicated.
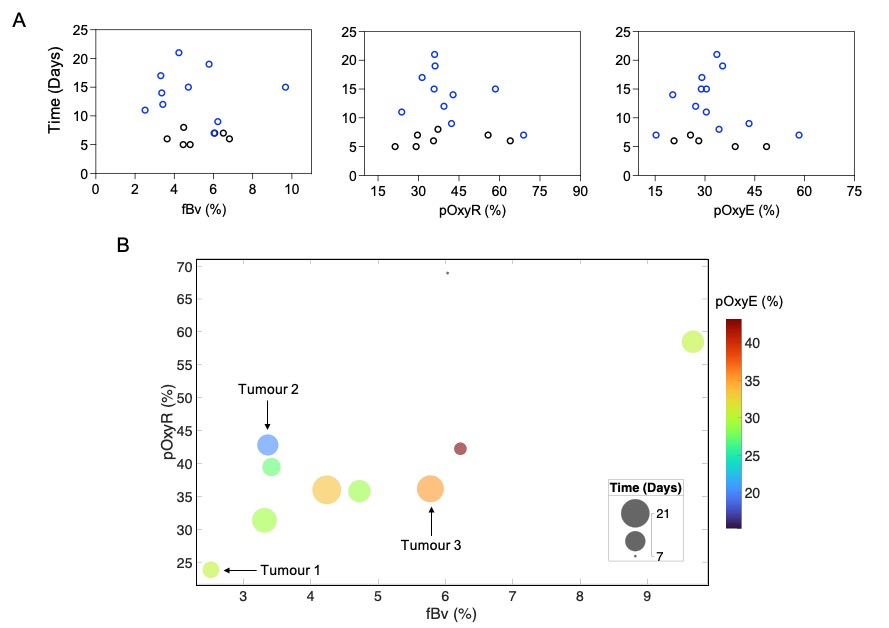
Figure 4: (A) Scatter plot of the time taken to reach 2x the pre-treatment tumour volume against fBv, pOxyR and pOxyE. (B) Bubble plot in MATLAB showing combined relationship between fBv, pOxyR, pOxyE and the time taken to reach 2x the pre-treatment tumour volume. The relative positions of the three tumours in Figure 1 and 2 are indicated.