4728
Evaluating Glucose Uptake in Brown Adipose Tissue by In-Vivo GlucoCEST MRI1Heart Center Bonn, Department of Internal Medicine II, University Hospital Bonn, Bonn, Germany, Bonn, Germany, 2Clinic of Radiology, University of Münster, Münster, Germany, Münster, Germany
Synopsis
Keywords: Small Animals, Preclinical, Quantitative Imaging
Motivation: The project assessed the glucose uptake in brown adipose tissue (BAT) without using ionizing radiation since current methods, such as PET, have safety risks.
Goal(s): In a preclinical study we investigated whether chemical exchange saturation transfer MRI (CEST-MRI) could quantify the uptake of exogenous glucose in BAT.
Approach: We utilized CEST-MRI to monitor and analyze the glucose uptake in 6 mice following intravenous (i.v.) and intraperitoneal (i.p.) administration of glucose.
Results: GlucoCEST MRI successfully detected glucose uptake in BAT and revealed distinct glucose kinetics after i.v. and i.p. administration.
Impact: GlucoCEST is a promising radiation-free technique to measure relative glucose uptake in BAT, which can be used to investigate BAT activity e.g. in metabolic diseases. Additionally, it can provide further insight into BAT function and pharmacological activation.
INTRODUCTION
Brown adipose tissue (BAT) plays a critical role in regulating glucose metabolism. Unlike white adipose tissue, BAT is characterized by its high glucose uptake, driven primarily by its thermogenic function and energy dissipation as heat. While traditional methods, such as PET imaging with 18F-fluorodeoxyglucose (FDG), have been used to measure glucose in BAT, they require the use of radiotracers, exposing patients to radiation hazards[1]. Chemical exchange saturation transfer MRI (CEST) is a non-ionizing MRI technique that utilizes the natural proton exchange between molecules with labile protons and water as a contrast mechanism[2]. This study aimed to investigate the potential of CEST MRI by using natural D-glucose as a contrast agent to assess the glucose uptake in BAT at rest.METHODS
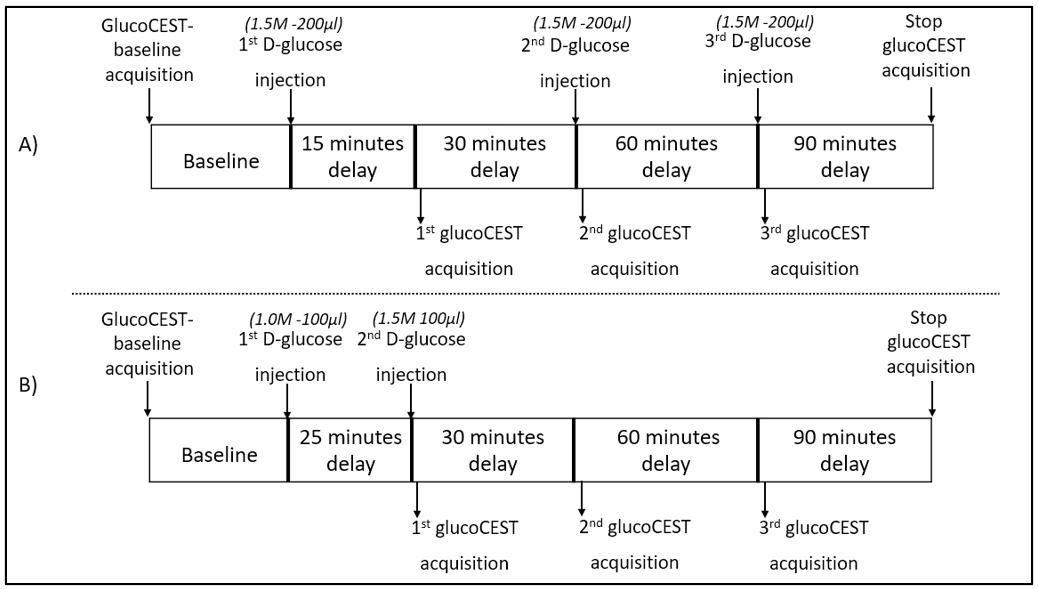
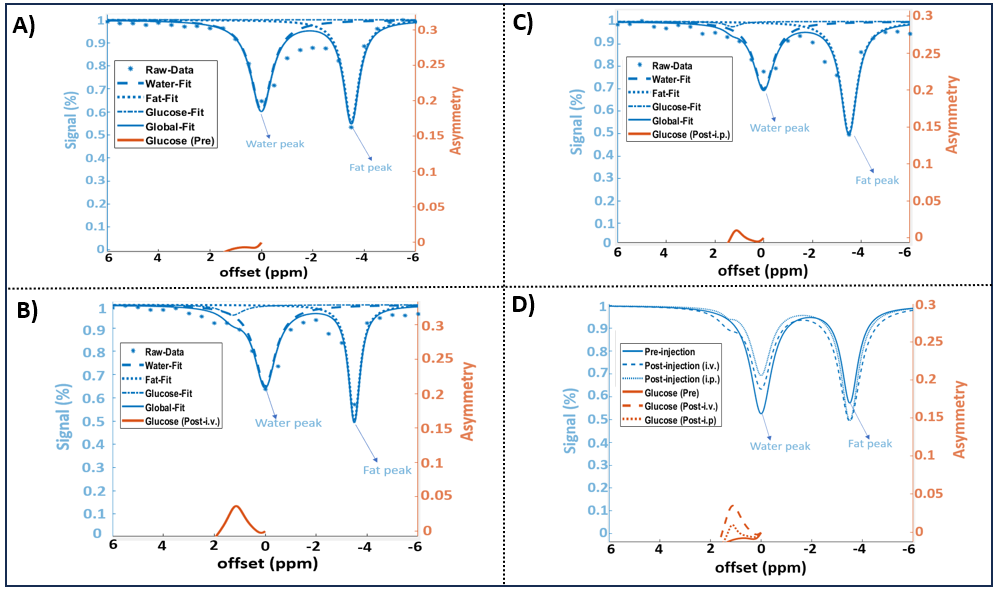
Sequence: The current study included 12 male C57BL/6 mice with an average age of 9 weeks. A respiratory-gated CEST-RARE sequence was applied using a series of 5 Gaussian saturation pulses. Each pulse had a duration of 100 ms and was separated by a 0.010 ms inter-pulse delay. The experiments were conducted at a 11.7T preclinical system (Bruker MR system BioSpec USR 117/16) with a cryoprobe serving as the trans-receiver coil. Saturation frequencies were applied in a range from -3000 to +3000 Hz at intervals of 250 Hz. S0 was set to 100,000 Hz. Other imaging parameters included: TR=1100 ms, TE=37.40 ms, Band Width: 100 kHz, RARE-Factor=16, Echo Spacing= 4.676, Slice Thickness = 1 mm, Resolution= 260x260 μm2. Study Protocol: Animals were divided into 2 groups. In the first group (N=6) mice underwent dynamic glucoCEST MRI before and after i.v. administration of 3 doses of 15 mmol/kg glucose with 3 subsequent acquisitions between 30 to 90 minutes post-injection (Fig. 1). The second group (N=6) was scanned using the same protocol (i.e. dynamic series of 3 scans) before and after the i.p. administration of 5 and 7.5 mmol/kg glucose (Fig. 1). The blood glucose level (BGL) was measured using a blood glucose meter. Image Analysis: All data were processed by region-of-interest (ROI) based analysis using an in-house developed MATLAB toolbox (v.2023a, Mathworks, Waltham, MA). The Z-spectra were corrected for B0 inhomogeneities using a 6001-point spline function. They were fitted with a 3-pool Lorentzian fitting algorithm and non-linear optimization (Fig. 2). Glucose quantification (both for pre and post glucose injections) was based on the asymmetric magnetization transfer ratio MTRasym at 640 Hz. The difference between MTRasym pre and post glucose administration (ΔMTRasym) was calculated and the results were expressed as a percentage (ΔMTRasym%). Quantitative glucose maps were finally calculated from asymmetry spectra by integrating the area under the curve (AuCasym) within the range of 0.5 to 2.0 ppmRESULTS
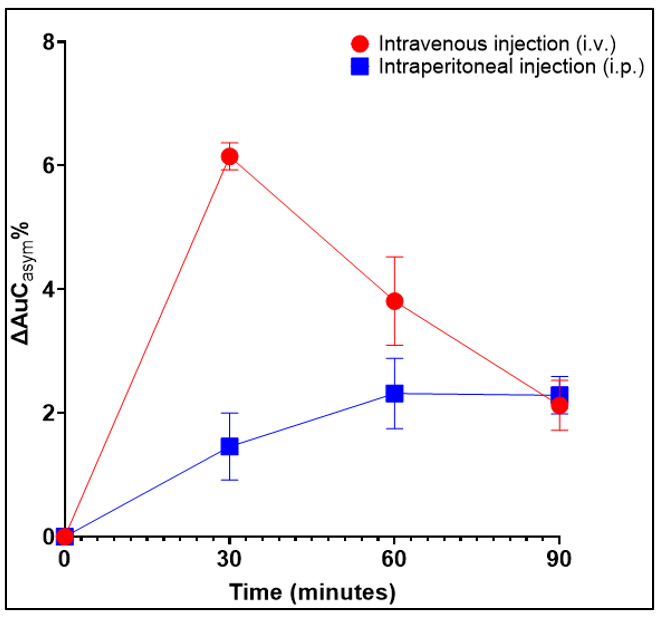
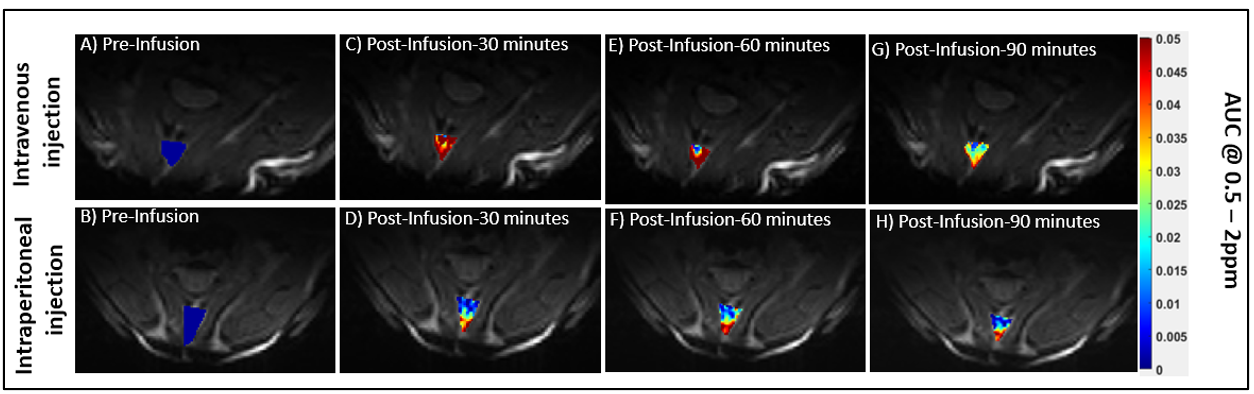
The Mann-Whitney U-test revealed significant differences in ΔMTRasym% between the i.v. and i.p. routes of glucose administration at 30- and 60-minutes post-injection (p<0.05). At 90 minutes, ΔMTRasym% did not significantly differ between the two methods (p>0.05). Thus, the analysis of the Z-spectra indicated distinct glucose kinetics for i.v. and i.p. glucose administrations (Fig 2-3). The i.v. injection demonstrated a rapid wash-in (ΔMTRasym% =5.658±0.7589) at 30 minutes and wash-out of glucose (ΔMTRasym%=1.702 at 60 minutes, while the i.p. injection showed a prolonged slow enhancement until 60 minutes post-injection remaining steady until 90 minutes (ΔMTRasym% =1.490 at 30 minutes; ΔMTRasym% =2.303 at 60 minutes; ΔMTRasym% =2.188 at 90 minutes). According to the glucose AuCasym maps (Fig 4), the i.v. administration resulted in a more uniform uptake compared to the i.p. route. Upon examination, the averaged maximum BGL was 396.8±39.96 mg/dL for both injections group.DISCUSSION
This study evaluated the glucoCEST technique for the non-invasive detection of exogenously administered glucose uptake in BAT, offering implications for BAT’s characterization and activity monitoring. Our findings revealed distinctive glucose uptake patterns in BAT between i.v. and i.p. glucose injections. Specifically, i.v. administration demonstrated rapid uptake and clearance, whereas i.p. injections led to sustained enhancement. This discovery is of particular interest for projects investigating pharmacological BAT activation in metabolic research, as the maximum lifetime of a pharmacologically activated BAT tissue is around 40 minutes [3]. Accordingly, it suggests that i.v. injection in the context of glucoCEST quantification in BAT yields more reliable results than i.p. injection, considering that the maximum uptake of glucose occurs at around 30 minutes post administration, leading to a sharp change in the Z-spectrum within the range of 0.5 to 2.0 ppm.CONCLUSION
This preliminary study represents the first successful demonstration of the glucoCEST technique for detecting exogenously administered glucose uptake kinetics in BAT using MRI. Based on our findings, we recommend the i.v. route of glucose administration.Acknowledgements
This work was supported by the Deutsche Forschungsgemeinschaft (German Research Foundation, Project-ID 397484323).References
1. Virtue, S. and A. Vidal-Puig, Assessment of brown adipose tissue function. Front Physiol, 2013. 4: p. 128.
2. Kim, M., et al., What do we know about dynamic glucose-enhanced (DGE) MRI and how close is it to the clinics? Horizon 2020 GLINT consortium report. MAGMA, 2022. 35(1): p. 87-104.
3. Olsen, J.M., et al., β3-Adrenergically induced glucose uptake in brown adipose tissue is independent of UCP1 presence or activity: Mediation through the mTOR pathway. Molecular Metabolism, 2017. 6(6): p. 611-619.
Figures