4726
Pancreatic cancer habitats using CEST pH Imaging, Quantitative Susceptibility Mapping and R2* relaxivity at 7T1Small Animal Imaging Lab, Moffitt Cancer Center, Tampa, FL, United States, 2Department of Cancer Physiology, Moffitt Cancer Center, Tampa, FL, United States
Synopsis
Keywords: Small Animals, Cancer
Motivation: Many cancer studies concentrate in isolated markers like oxygenation, pH or relaxivity measurements. We believe studying all biomarkers and its interactions as microenvironments is the key.
Goal(s): Our goal is to build a library of multiparametric data with pH-derived habitats to aid treatment response in the future.
Approach: Mice with flank implanted pancreatic tumors were imaged to estimate tumor volume, pH, R2* and susceptibility maps. All maps were compared using one-way ANOVA between two pH-derived habitats.
Results: Significant differences in susceptibility and R2* were found between pH-derived habitats for large tumors. The same trend, without significant differences, was found in smaller tumors.
Impact: The study of different tumor microenvironments defined by CEST-derived pH habitats was demonstrated. A larger subset of animals with different tumor volumes and other multiparametric data will help understand tumor microenvironment better and aid treatment response in the future.
INTRODUCTION
Pancreatic cancer is ranked as one of the highest causes of cancer mortality in the world. Many factors impact the survival rates but tumor stage at the time of diagnosis is the most important. Therefore, early detection is crucial. Understanding the tumor microenvironment better would help not only early diagnosis but also monitor treatment response.Tumor microenvironment is well known to be largely acidic1, coupled with poor perfusion and correlated to hypoxia. We believe studying all biomarkers and its interactions as microenvironments (habitats) is the key. In this work we investigate the correlation of tumor pH microenvironment with relaxivity (R2*) and susceptivity maps (QSM) to better understand tumor microenvironment in pancreatic tumors.METHODS
All MRI experiments were done in a 7T horizontal magnet (Agilent-Technologies) and Bruker electronics (BioSpec AV3HD) with a 35mm volume birdcage coil (Doty Scientific). The human pancreatic cell line BxPC3 was used to establish subcutaneous primary tumors in four NSG mice where a total of 5 million cells was injected into the right flank of each animal.Tumor volumes were estimated by manual segmentation using a MATLAB code in images from a multi slice T2-weighted RARE sequence. A gradient echo sequence was used to acquire 7 echoes (3.34 to 23.4) with 3.34ms echo spacing to estimate R2* and susceptibility maps.
R2* maps were produced using mono‐exponential fitting of magnitude signal at different echo‐times2. For QSM, phase from different echo‐times were processed, corrected and normalized3-5. CEST images were acquired, before and after iopamidol tail vein injection, using a CW saturation protocol (3 µT for 5 seconds) consisting of 46 offset frequencies between +/- 10ppm. Post-iopamidol images were acquired for 20 mins after injection, to calculate pH maps6. Two habitats were defined from the pH maps (pH<7 and pH>=7) for each mouse to investigate the relationship with R2* and susceptibility using a one-way analysis of variance in MATLAB.
RESULTS
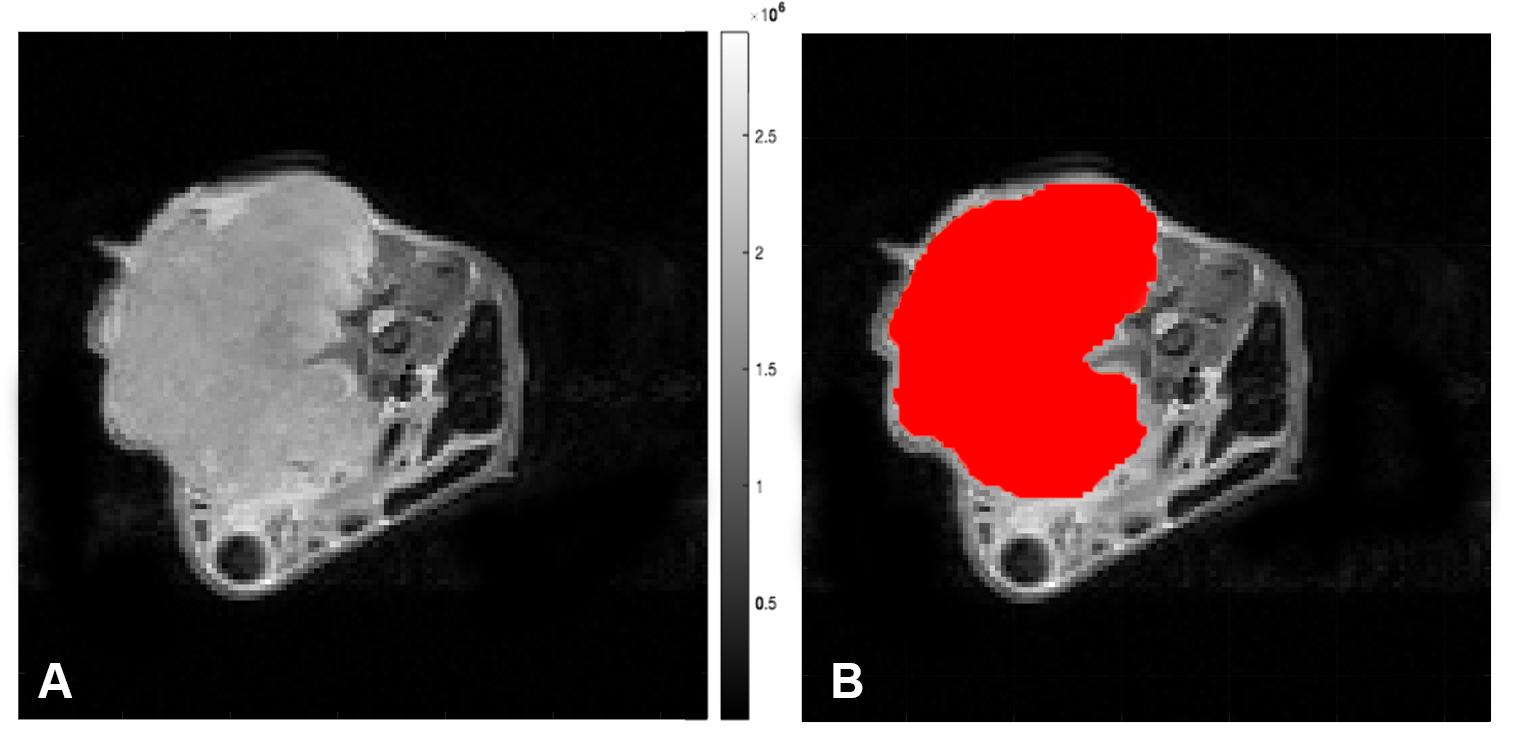
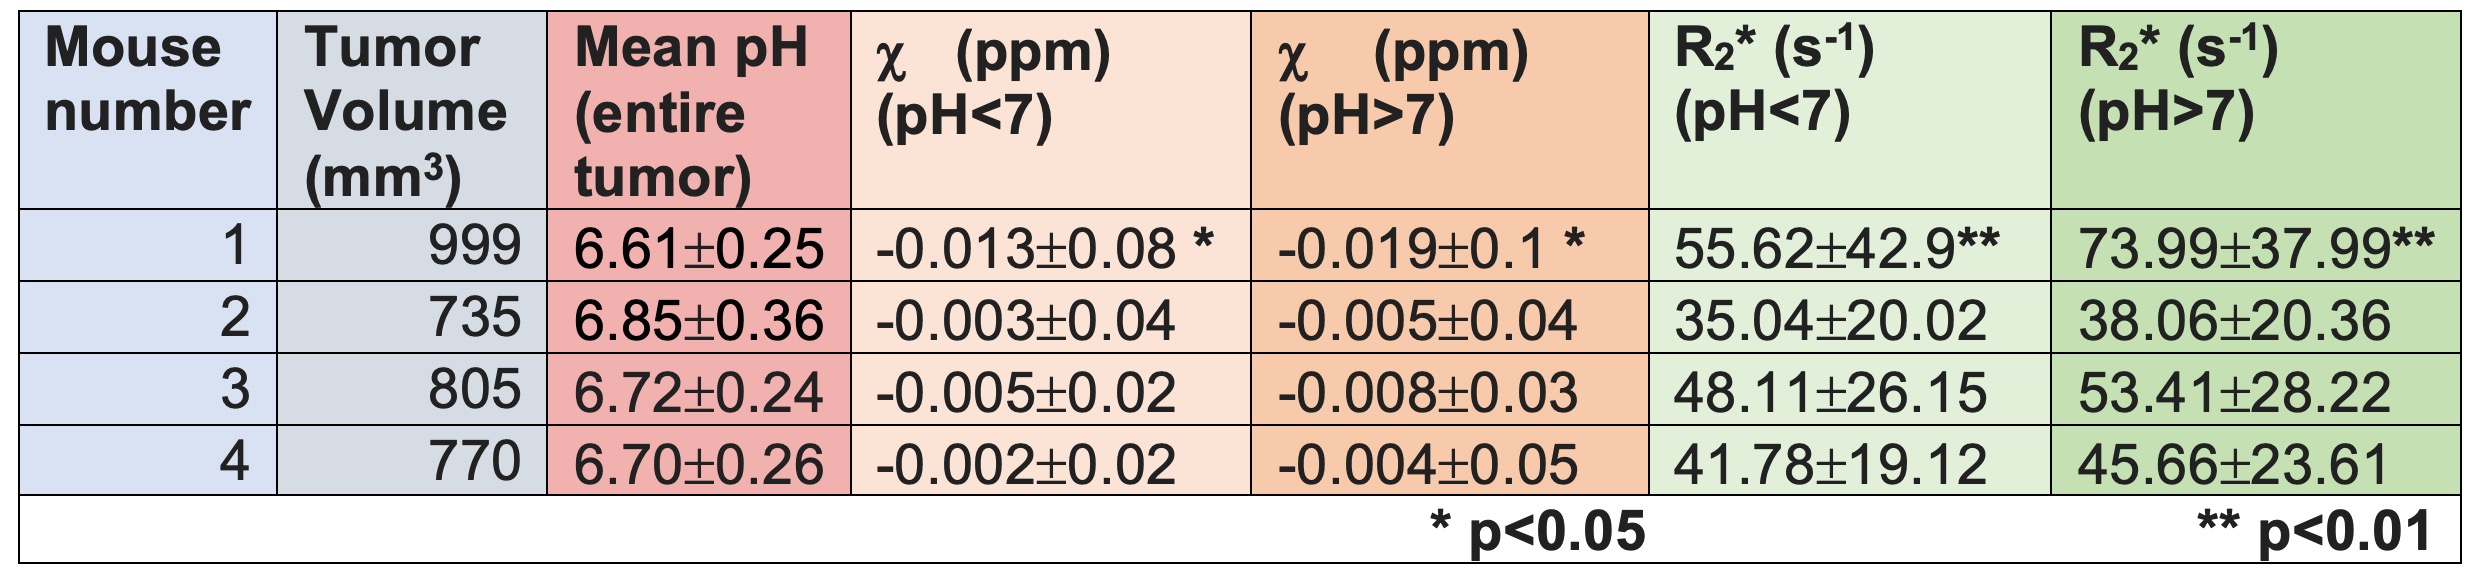
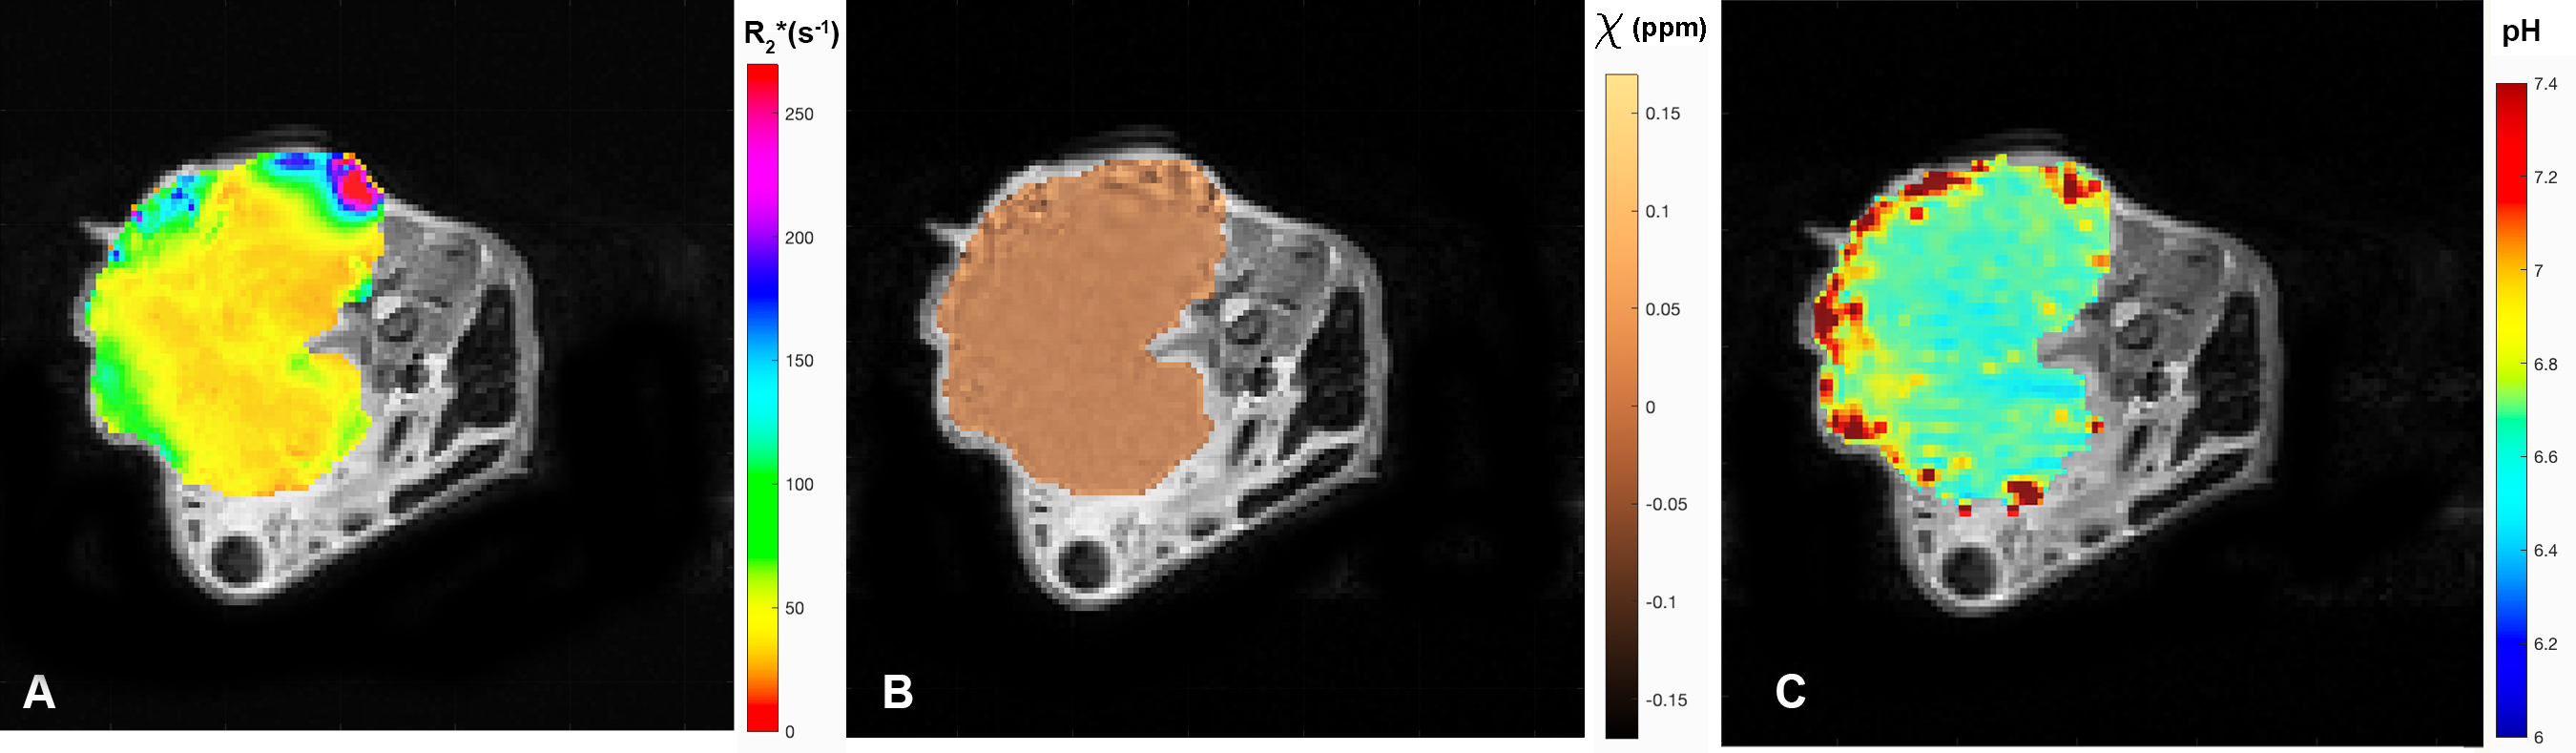
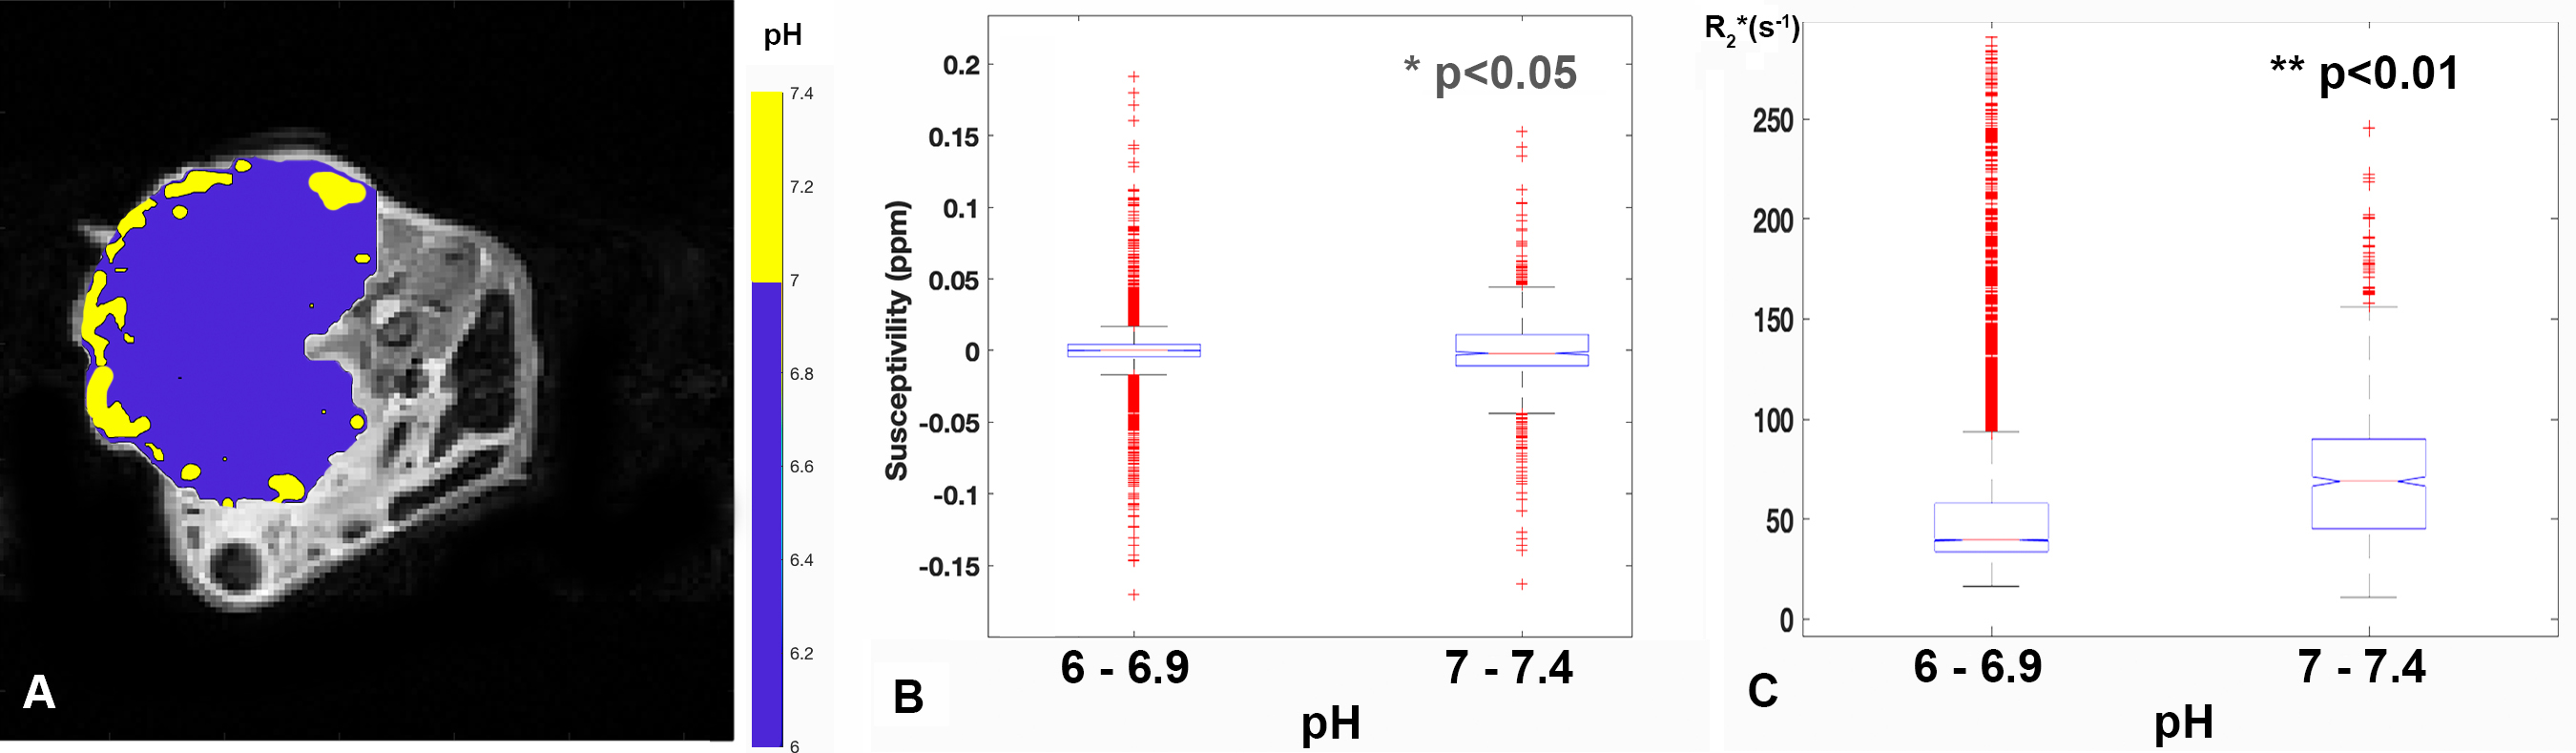
Figure 1(A) shows a representative T2-weighted slice of mouse number one and tumor segmentation as a red overlayed area in Figure 1(B). Tumor volumes of mice one through four are presented in Figure 2 along with the corresponding mean pH, susceptibility and R2* values for each pH habitat. Mouse one had the biggest tumor and the lowest mean pH. There were significant differences in susceptibility (p<0.05) and R2* (p<0.01) between habitats only for mouse one. For smaller tumor volumes there was not significant differences between habitats, although the same trend of slightly higher susceptibility and relaxivity for higher pH was still present. Additionally there was a slight correlation between tumor volumes and mean pH, resulting in lower pH for the bigger tumors. Figure 2 shows representative quantitative maps for the center slice of mouse one. Corresponding pH-derived tumor habitats are shown in Figure 3(A) as well as the analysis of variance of susceptibility and R2* showing significant differences (p<0.05) and (p<0.01) respectively Figure 3(B) and (C).DISCUSSION
Significant differences were found in the biggest tumor showing higher R2*, susceptibility and pH around the periphery of the tumor, while the low pH and R2* as well as susceptibility closer to zero around the center of the tumor. This corresponds to a typical hypoxic pattern where the blood flow is only existent in the periphery of the tumor and the center is mostly hypoxic or even necrotic in larger tumors. For tumor volumes lower than 900mm3 the necrotic core is not well defined or not present causing minimal changes in microenvironments which is reflected in the lack of significant differences between habitats as shown in Figure 2. The presented method aids the study of different pH-derived microenvironments, especially for larger tumors with more defined pH areas. While larger number of animals will be needed to understand the habitats correlation in smaller tumors where different pH areas are less defined. In the future, it may be more helpful to calculate the percent of oxygen per pixel instead of just susceptibility.CONCLUSIONS
In this work we demonstrated the possibility of studying different tumor habitats defined by CEST-derived pH maps. Significant differences in susceptibility and R2* were found between pH habitats in large tumors. Our method did not find significant differences for smaller tumors where pH habitats are less defined. In the future a bigger subset of animals with different tumor volumes will be studied to find a meaningful correlation. Perfusion, T1 maps and oxygen measurements will also be implemented in the near future to better characterize each habitat. The future goal is to have a library of multiparametric data to aid treatment response.Acknowledgements
Research reported in this publication was supported by the National Cancer Institute of the National Institutes of Health under Award Number P30CA076292; 02/01/2022 - 1/31/2027. The research reported herein was supported by the NIH/NCI (R01CA239219)References
- Vaupel P., Kallinowski F., Okunieff P. Blood flow, oxygen and nutrient supply, and metabolic microenvironment of human tumors: A review. Cancer Res. 1989; 49:6449–6465.
- Treit S, Naji N, Seres P, Rickard J, Stolz E, Wilman AH, Beaulieu C. R2* and quantitative susceptibility mapping in deep gray matter of 498 healthy controls from 5 to 90 years. Hum Brain Mapp. 2021 Oct 1;42(14): 4597-4610. doi: 10.1002/hbm.25569.
- Hussein S. Abdul-Rahman, Munther A. Gdeisat, David R. Burton, Michael J. Lalor, Francis Lilley, and Christopher J. Moore, "Fast and robust three-dimensional best path phase unwrapping algorithm," Appl. Opt. 46, 6623-6635 (2007).
- Hirohito Kan, Harumasa Kasai, Nobuyuki Arai, Hiroshi Kunitomo, Yasujiro Hirose, Yuta Shibamoto. Background field removal technique using regularization enabled sophisticated harmonic artifact reduction for phase data with varying kernel sizes. Magnetic Resonance Imaging, Volume 34, Issue 7, 2016, Pages 1026-1033, ISSN 0730-725X.
- Liu T, Xu W, Spincemaille P, Avestimehr AS, Wang Y. Accuracy of the morphology enabled dipole inversion (MEDI) algorithm for quantitative susceptibility mapping in MRI. IEEE Trans Med Imaging. 2012 Mar;31(3):816-24. doi: 10.1109/TMI.2011.2182523.
- Jardim-Perassi, Bruna, Irrera, Pietro, Lau, Justin, Budzevich, Mikalai, Whelan, Christopher, Abrahams, Dominique, Ruiz, Epi, Ibrahim -Hashim, Arig, Erturk, Sultan, Longo, Dario, Pilon-Thomas, Shari, Gillies, Robert. Intraperitoneal Delivery of Iopamidol to Assess Extracellular pH of Orthotopic Pancreatic Tumor Model by CEST-MRI. Contrast Media & Molecular Imaging. 2023. 1-12. 10.1155/2023/ 1944970.
Figures