4724
EPR oximetry using Ox071 detects acute kidney injury induced by cyclophosphamide1NCI, BETHESDA, MD, United States, 2Genepria, Rockville, MD, United States, 3NCI, Bethesda, MD, United States, 4NINDS, Bethesda, MD, United States
Synopsis
Keywords: Electron Paramagnetic Resonance, Oxygenation, EPR oximetry, Ox071
Motivation: EPR oximetry using Ox071 holds promise in detecting chemotherapy-induced acute kidney injury by monitoring pO2 distribution.
Goal(s): Using EPR, our study assessed the ability to discern pO2 variations between healthy kidneys and kidney injury models induced by intraperitoneal cyclophosphamide treatment.
Approach: To validate these changes, we performed ex vivo histological assessments with pimonidazole staining, comparing these results with EPR based pO2 maps.
Results: Analysis of the hypoxic fraction in tumor tissues via pimonidazole staining revealed a transient reduction at 2 days post-treatment, followed by recovery at 30 days. EPR oximetry results consistently mirrored these trends, affirming its reliability as a non-invasive method.
Impact: Historically, EPR oximetry focused on tumor hypoxia due to Ox063's limitations in well-oxygenated tissues. Using Ox071, a deuterated analog, current research extends oximetry to normoxic tissues, notably the kidneys.
Purpose
Historically, EPR oximetry studies primarily focused on assessing tumor oxygenation. This emphasis on tumors was due to the limitations of the previously employed Triarylmethyl (TAM) spin probes Ox063, which had a shorter signal life and was consequently better suited for oximetry in hypoxic tissues. In a previous study, the use of Ox071 in EPR oximetry demonstrated superior accuracy in estimating pO2 levels in normoxic tissues when compared to the Ox063 probe.(1) These findings suggested that Ox071 EPR oximetry could potentially be used to detect acute kidney injury resulting from chemotherapy-related adverse events by monitoring changes in pO2 distribution. In the current research, we have investigated our ability to discern variations in pO2 levels between healthy kidneys and kidney injury models induced by intraperitoneal injections of 200 mg/kg of cyclophosphamide.(2) Furthermore, we aimed to reconstruct high-resolution EPR oximetry images of the kidneys.Methods
MethodsMouse 3D EPR kidney imaging data were acquired in SPI mode at 23 × 23 × 23 Cartesian grid and the image reconstruction was done at 64 × 64 × 64 grid by zero filling the k-space matrix. Image reconstruction was performed by fast Fourier transformation. To determine R2* values, multi-gradient acquisitions at gradient maxima (Gm) of 14, 11.4, and 9.6 mT/m were performed. R2* maps were computed using 12 images at different tp values from the multi-gradient data where tp is the time delay from the excitation pulse. Tissue pO2 images were computed from the R2* maps. The feasibility of kidney oximetry was confirmed by comparing the distribution of pO2 levels under different conditions, including air, 10% oxygen, and carbogen (95% O2 and 5% CO2) inhalation.To confirm the impact of the cyclophosphamide-induced change in kidney oxygenation, we conducted ex vivo histological assessments using pimonidazole staining. We also employed EPR oximetry with the Ox071 probe, using the R2*-based single point imaging method, at different time points: pre-treatment, 2 days post-treatment, and 30 days post-treatment. The results obtained from EPR oximetry were then compared with the findings from the histological evaluations.Results and Discussion
Kidney oximetry under carbogen and 10% oxygen inhalation conditions exhibited elevated (48.1 mmHg) and reduced (24.8 mmHg) median pO2 levels in contrast to air inhalation conditions (35.8 mmHg).(Fig. 1) These findings indicate the sensitivity of EPR oximetry in detecting fluctuations in kidney oxygenation. The analysis of the hypoxic fraction, determined through pimonidazole staining of kidney tissues, revealed a transient decrease at the 2-day post-treatment mark, followed by a recovery at the 30-day post-treatment phase.(Fig. 2) Remarkably, the data obtained through EPR oximetry revealed a median kidney pO2 of 33.4 mmHg before treatment, increasing to 37.3 mmHg 2 days after treatment. This finding closely corresponded with the histological observations, demonstrating a notable reduction in the hypoxic fraction. The results suggest that EPR oximetry is a viable method for assessing a range of kidney disease conditions.(Fig. 3) Notably, this imaging technique holds promise for the evaluation of chronic kidney diseases (CKD), as kidney hypoxia is recognized as a potential prognostic indicator for CKD.(3) By optimizing the number of gradient steps and computations from image data captured after the RF pulse at later delay time-points, we successfully generated a high-resolution signal intensity map with an effective pixel resolution of 0.84 mm. Similarly, we achieved high-resolution pO2 mapping with an effective pixel resolution of 1.06 mm using the same dataset.(Fig. 4) High-resolution EPR kidney oximetry effectively revealed both the peripherally located higher pO2 regions and the centrally situated lower pO2 regions. This pO2 gradient between the cortex and medulla/pelvis regions is naturally preserved in a healthy kidney. Therefore, the capability to detect variations in pO2 distribution's heterogeneity can be valuable for assessing kidney health.Acknowledgements
This research was supported by intramural funds from the Center for Cancer Research of the National Institutes of Health. The authors declare no conflicts of interest.References
(1)Kishimoto, S., Devasahayam, N., Chandramouli, G. V. R., Murugesan, R., Otowa, Y., Yamashita, K., Yamamoto, K., Brender, J. R., & Krishna, M. C. (2023). Evaluation of a Deuterated Triarylmethyl Spin Probe for In Vivo R2∗-Based EPR Oximetric Imaging with Enhanced Dynamic Range. Magnetic Resonance in Medicine. Advance online publication. https://doi.org/10.1002/mrm.29811
(2)Bhat, N., Kalthur, S. G., Padmashali, S., & Monappa, V. (2018). Toxic Effects of Different Doses of Cyclophosphamide on Liver and Kidney Tissue in Swiss Albino Mice: A Histopathological Study. Ethiopian Journal of Health Sciences, 28(6), 711–716. https://doi.org/10.4314/ejhs.v28i6.5
(3)Hirakawa, Y., Tanaka, T., & Nangaku, M. (2017). Renal Hypoxia in CKD: Pathophysiology and Detecting Methods. Frontiers in Physiology, 8, 99. https://doi.org/10.3389/fphys.2017.00099
Figures
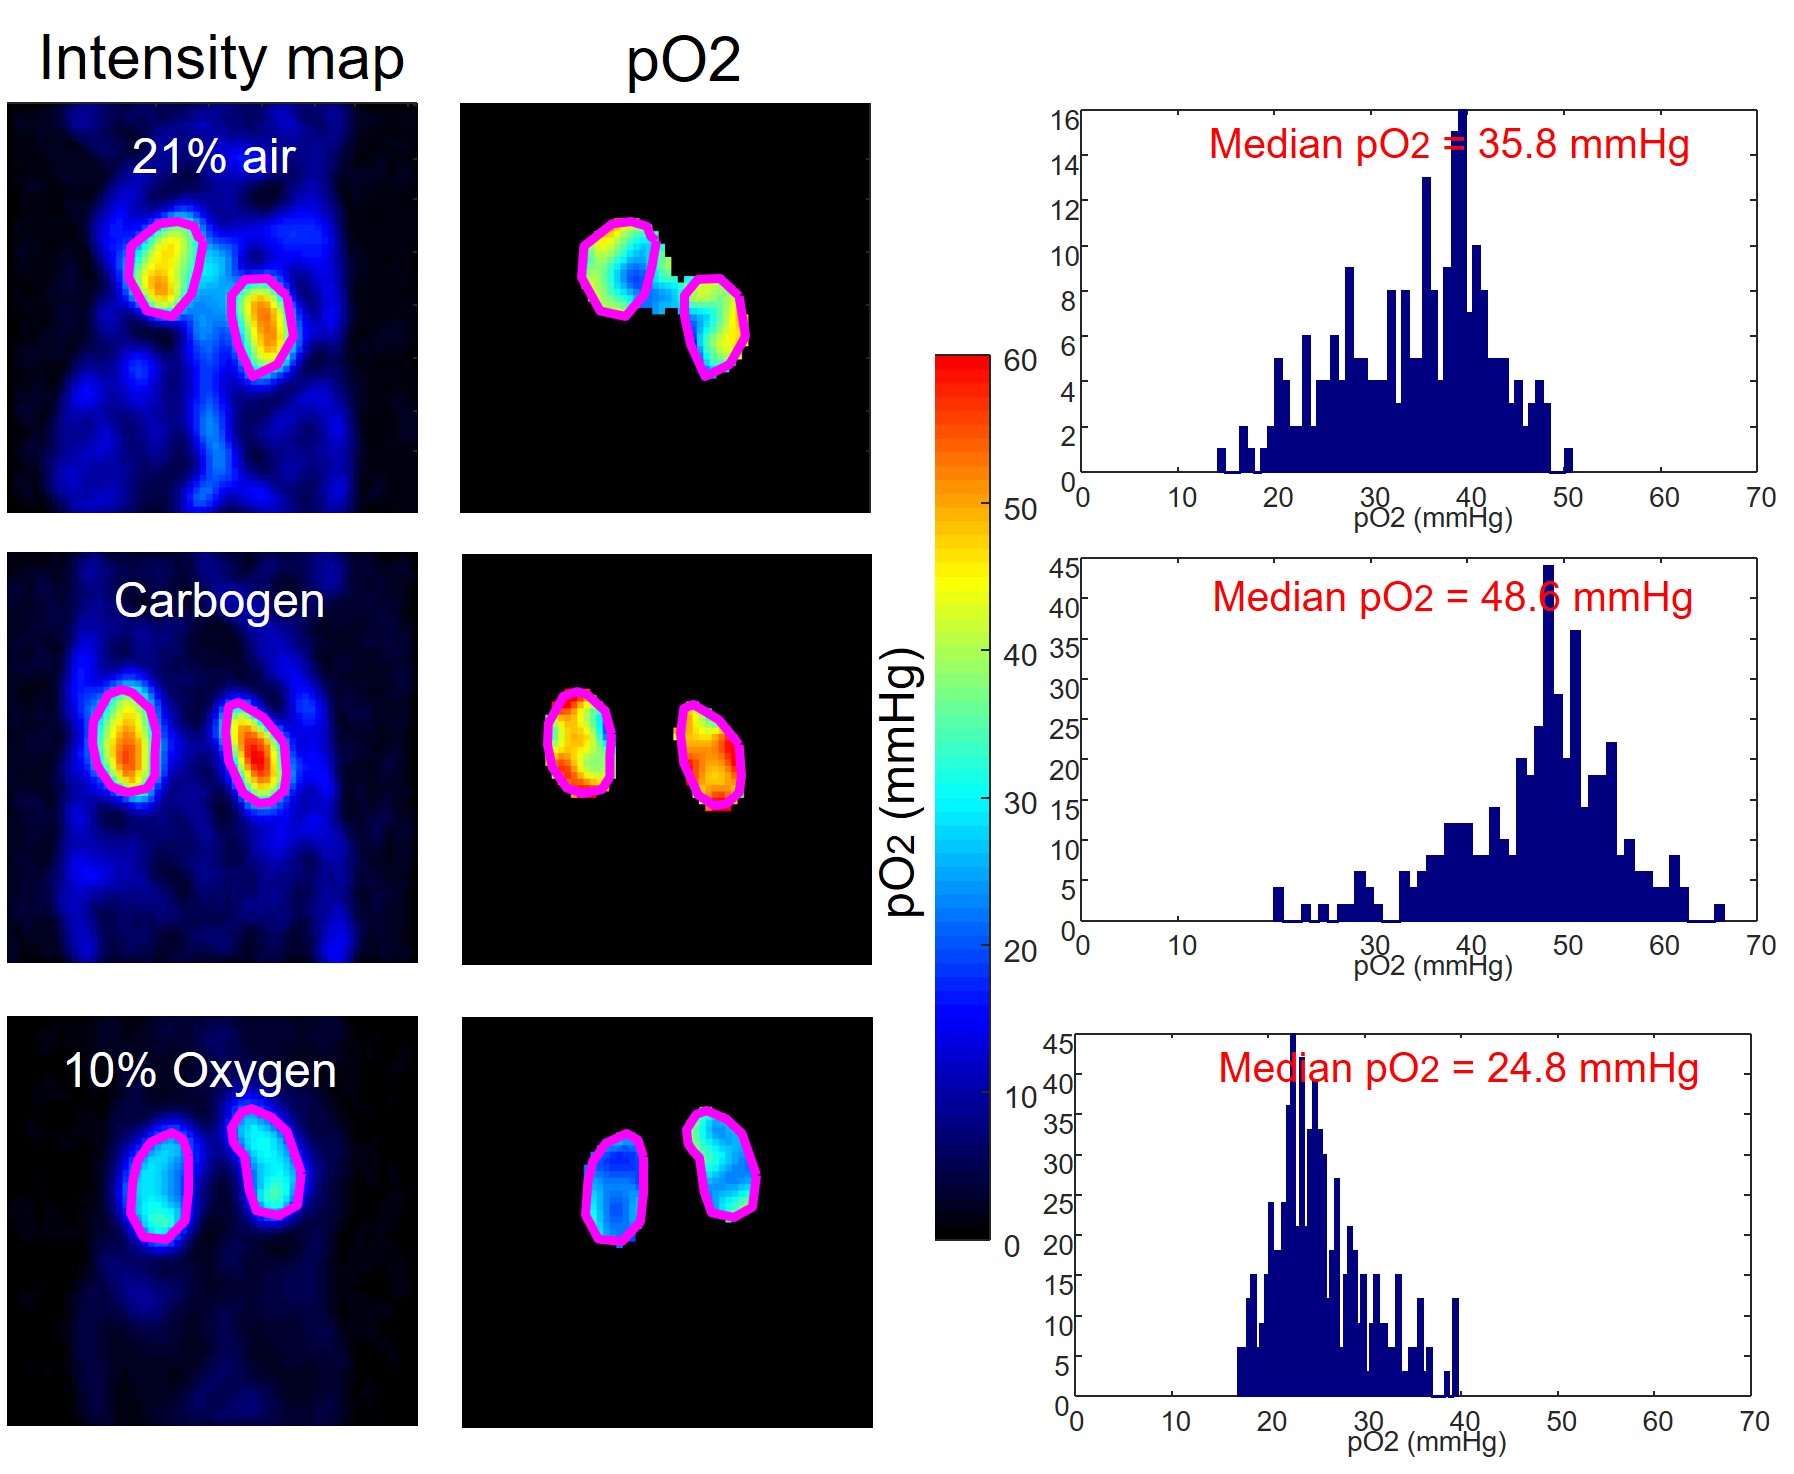
Figure 1
Top panels: Representative Ox71 intensity map, pO2 map, and pO2 histogram of mouse kidney under air inhalation. Center panels: Representative Ox71 intensity map, pO2 map, and pO2 histogram of mouse kidney under Carbogen inhalation. Bottom panels: Representative Ox71 intensity map, pO2 map, and pO2 histogram of mouse kidney under 10% oxygen inhalation.
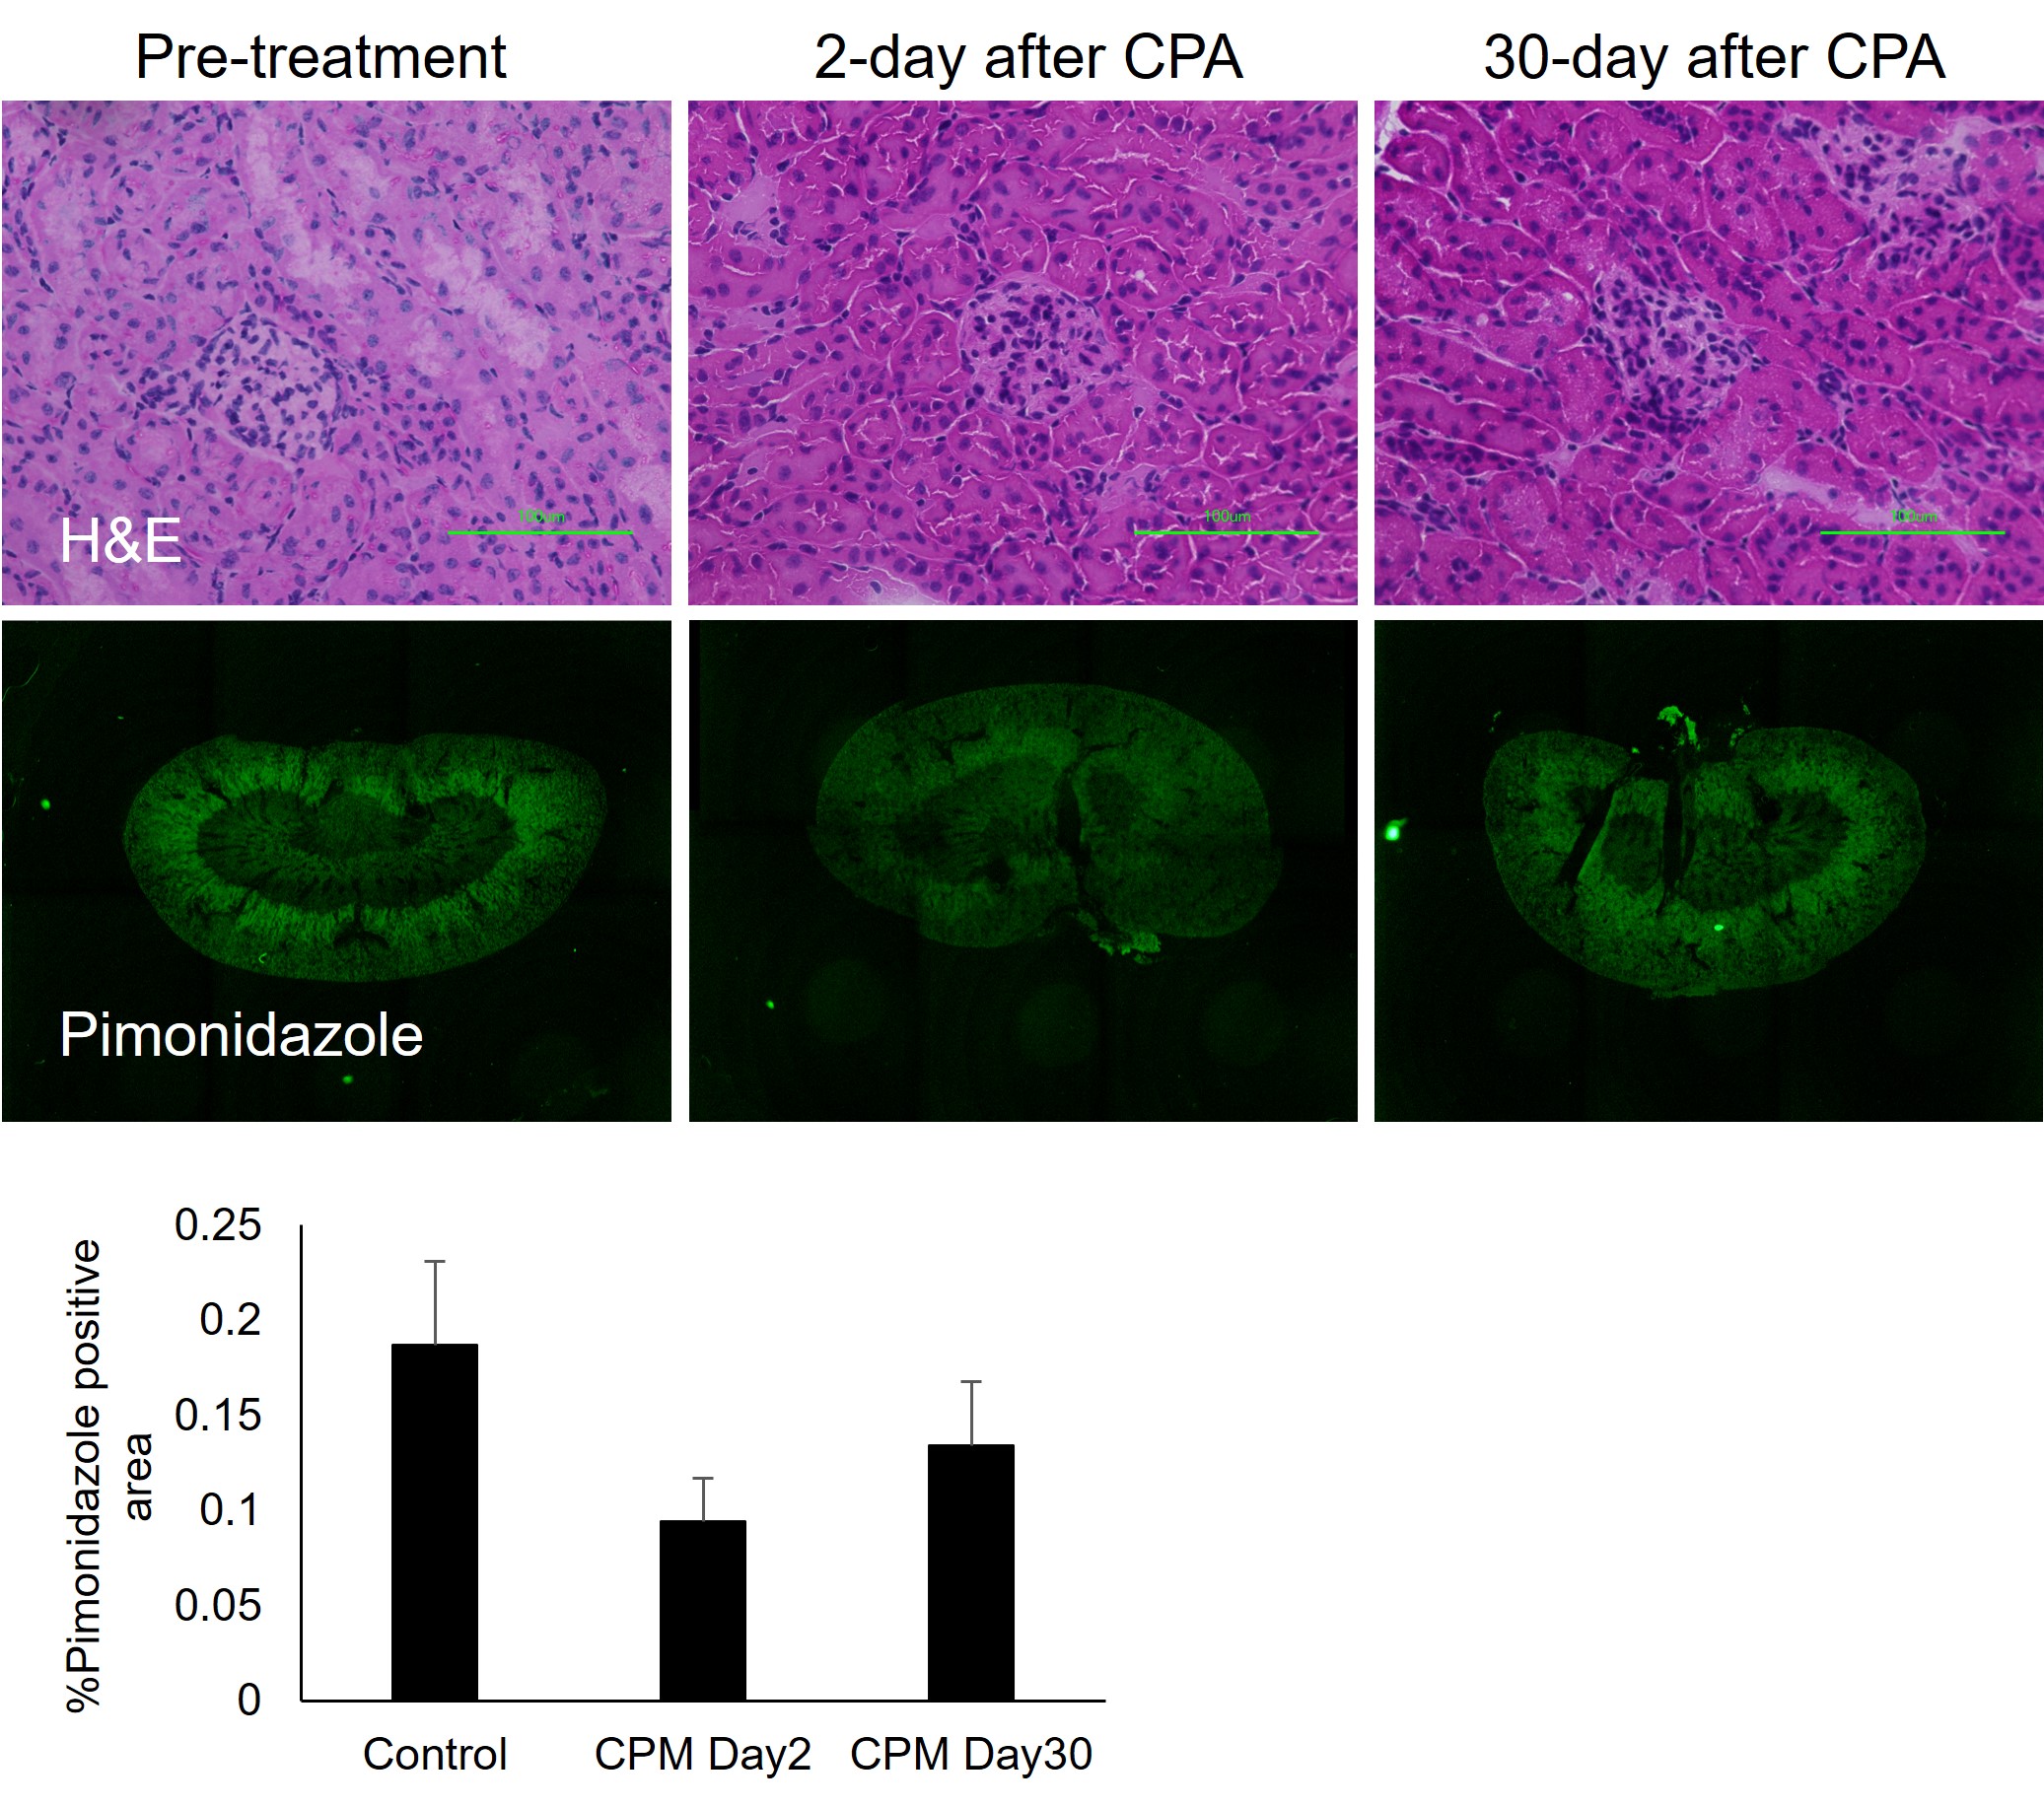
Figure 2
Top panels: Representative H&E staining of kidney of pre-treatment, 2-day after cyclophosphamide 200mg/kg treatment and 30-day after cyclophosphamide 200mg/kg treatment. Center panels: Representative pimonidazole staining of kidney of pre-treatment, 2-day after cyclophosphamide 200mg/kg treatment and 30-day after cyclophosphamide 200mg/kg treatment. Bottom bar plot: % pimonidazole staining positive area of each condition.
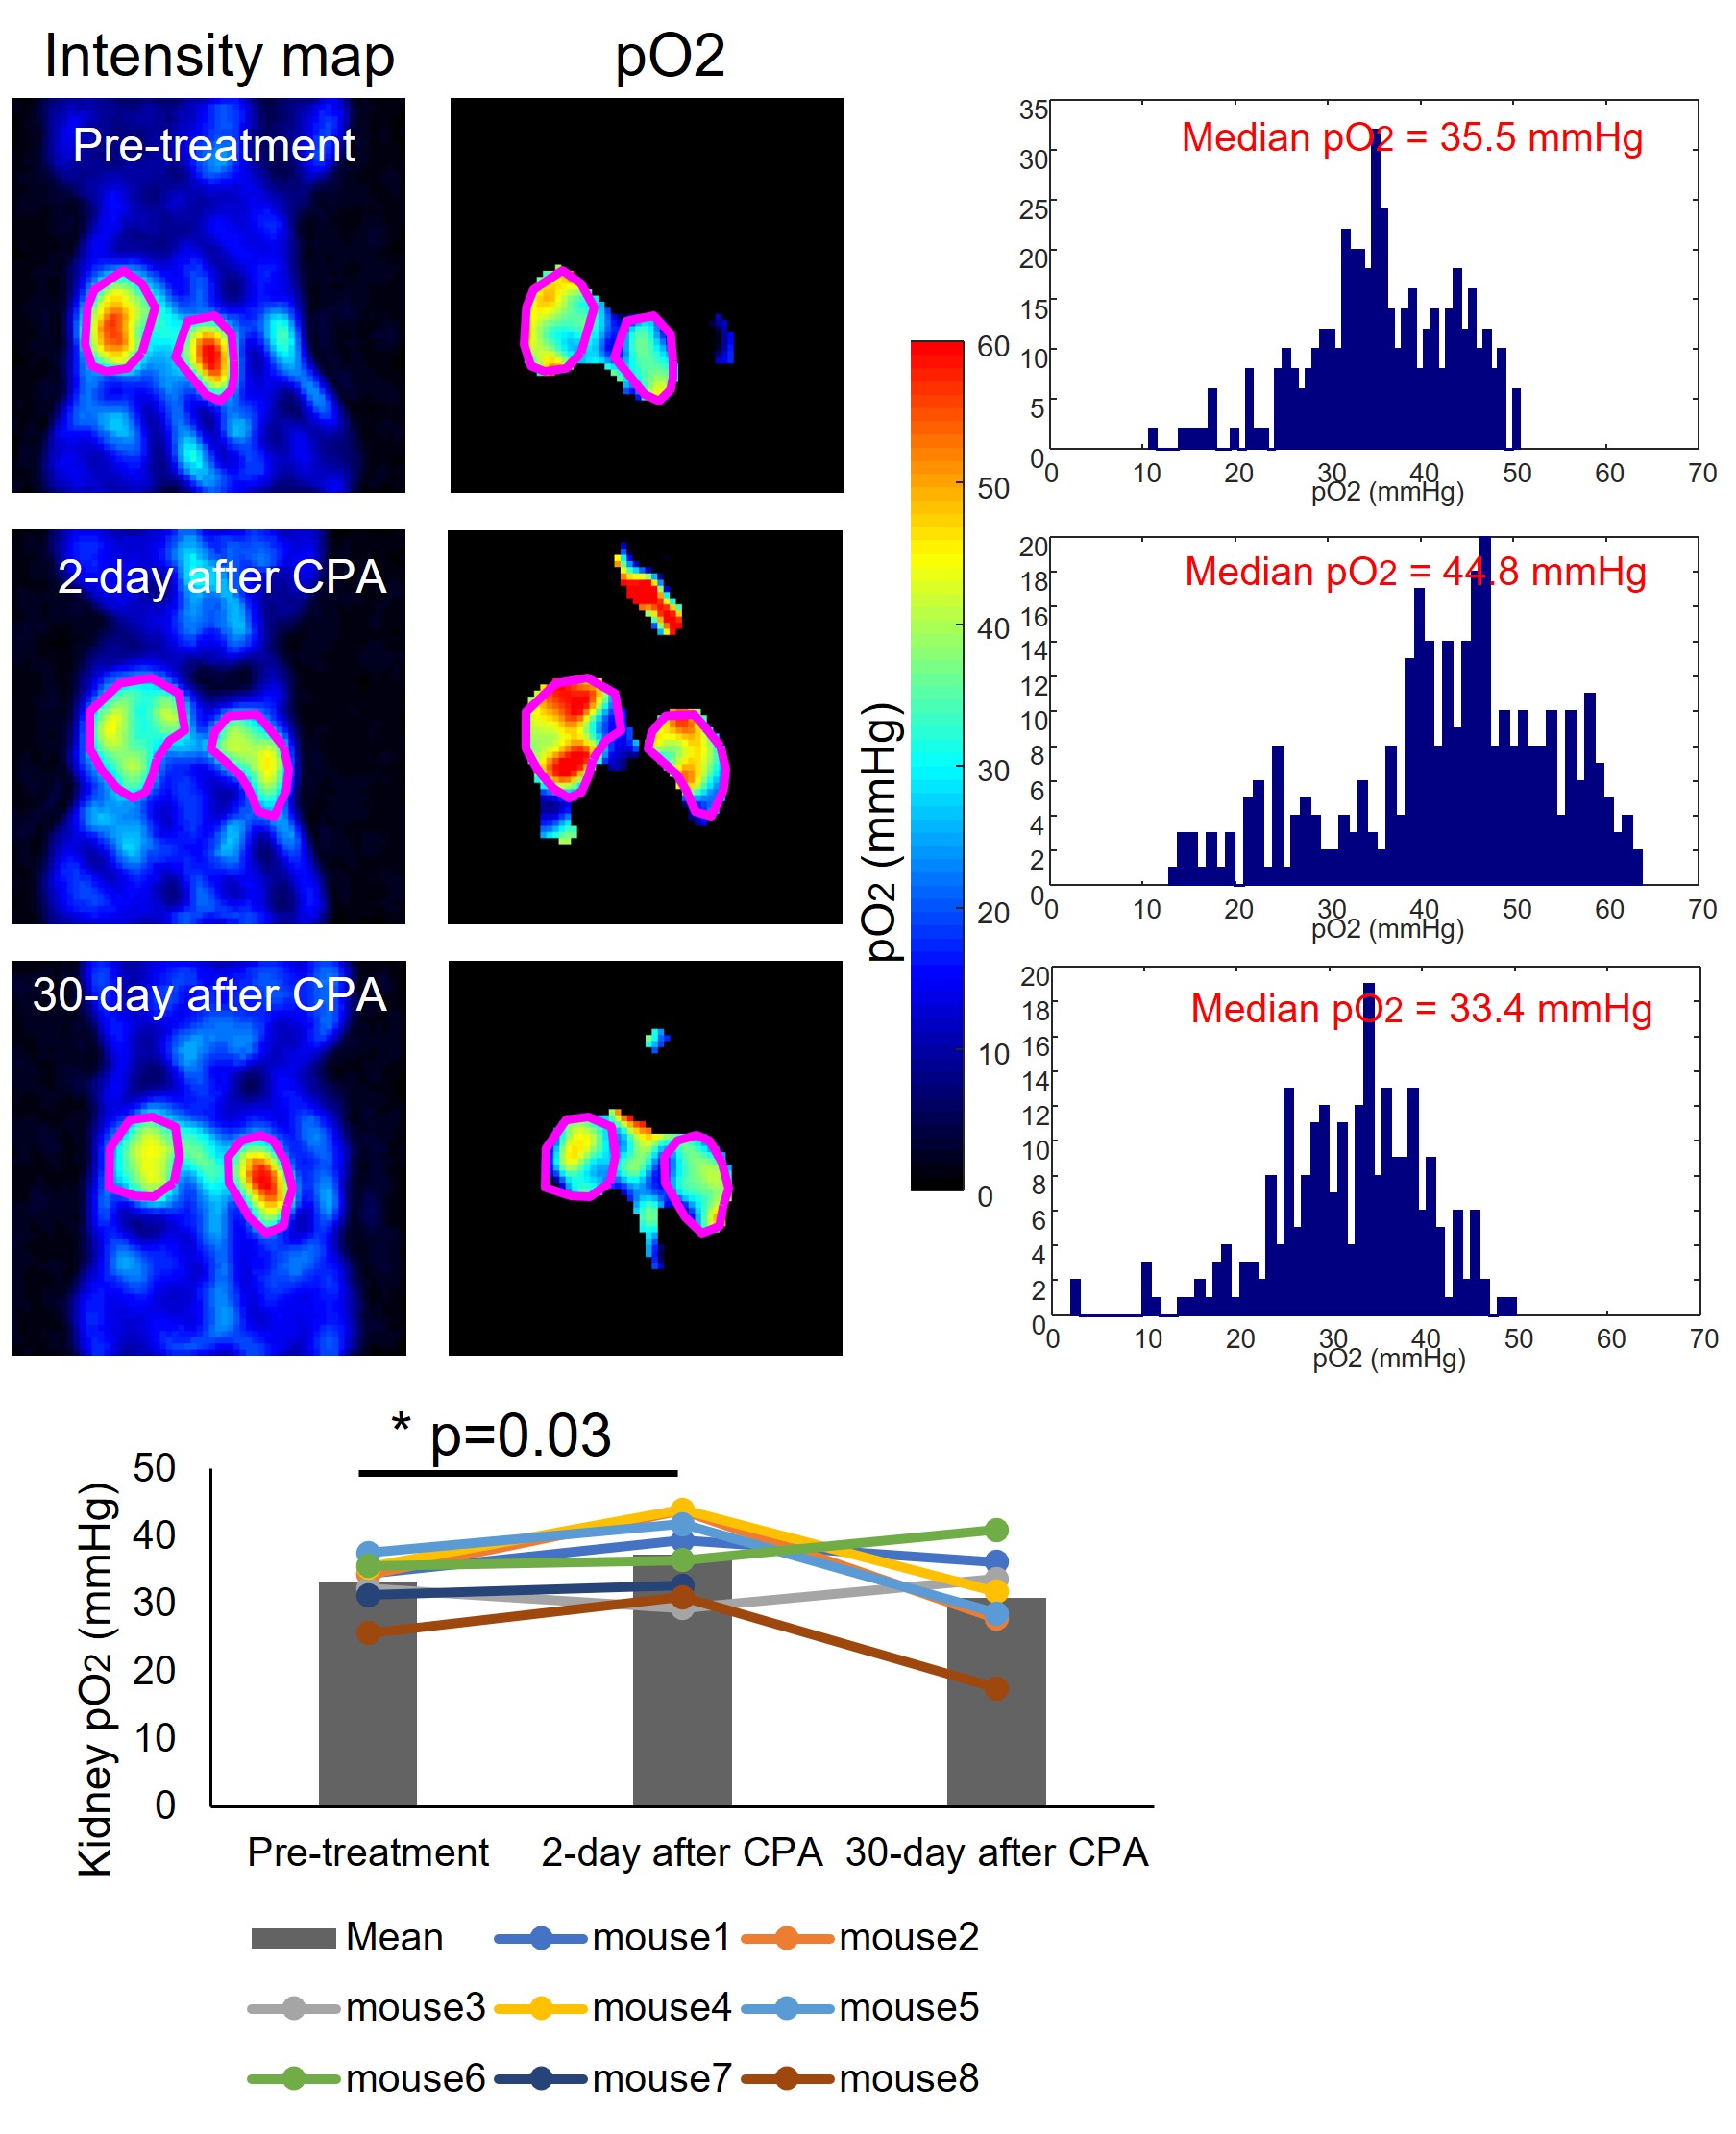
Figure 3
Top panels: Representative kidney Ox071 signal intensity map, pO2 map, and pO2 histogram of pre-treatment, 2-day after cyclophosphamide 200mg/kg treatment and 30-day after cyclophosphamide 200mg/kg treatment. Bottom bar plot: plot of mean kidney pO2.
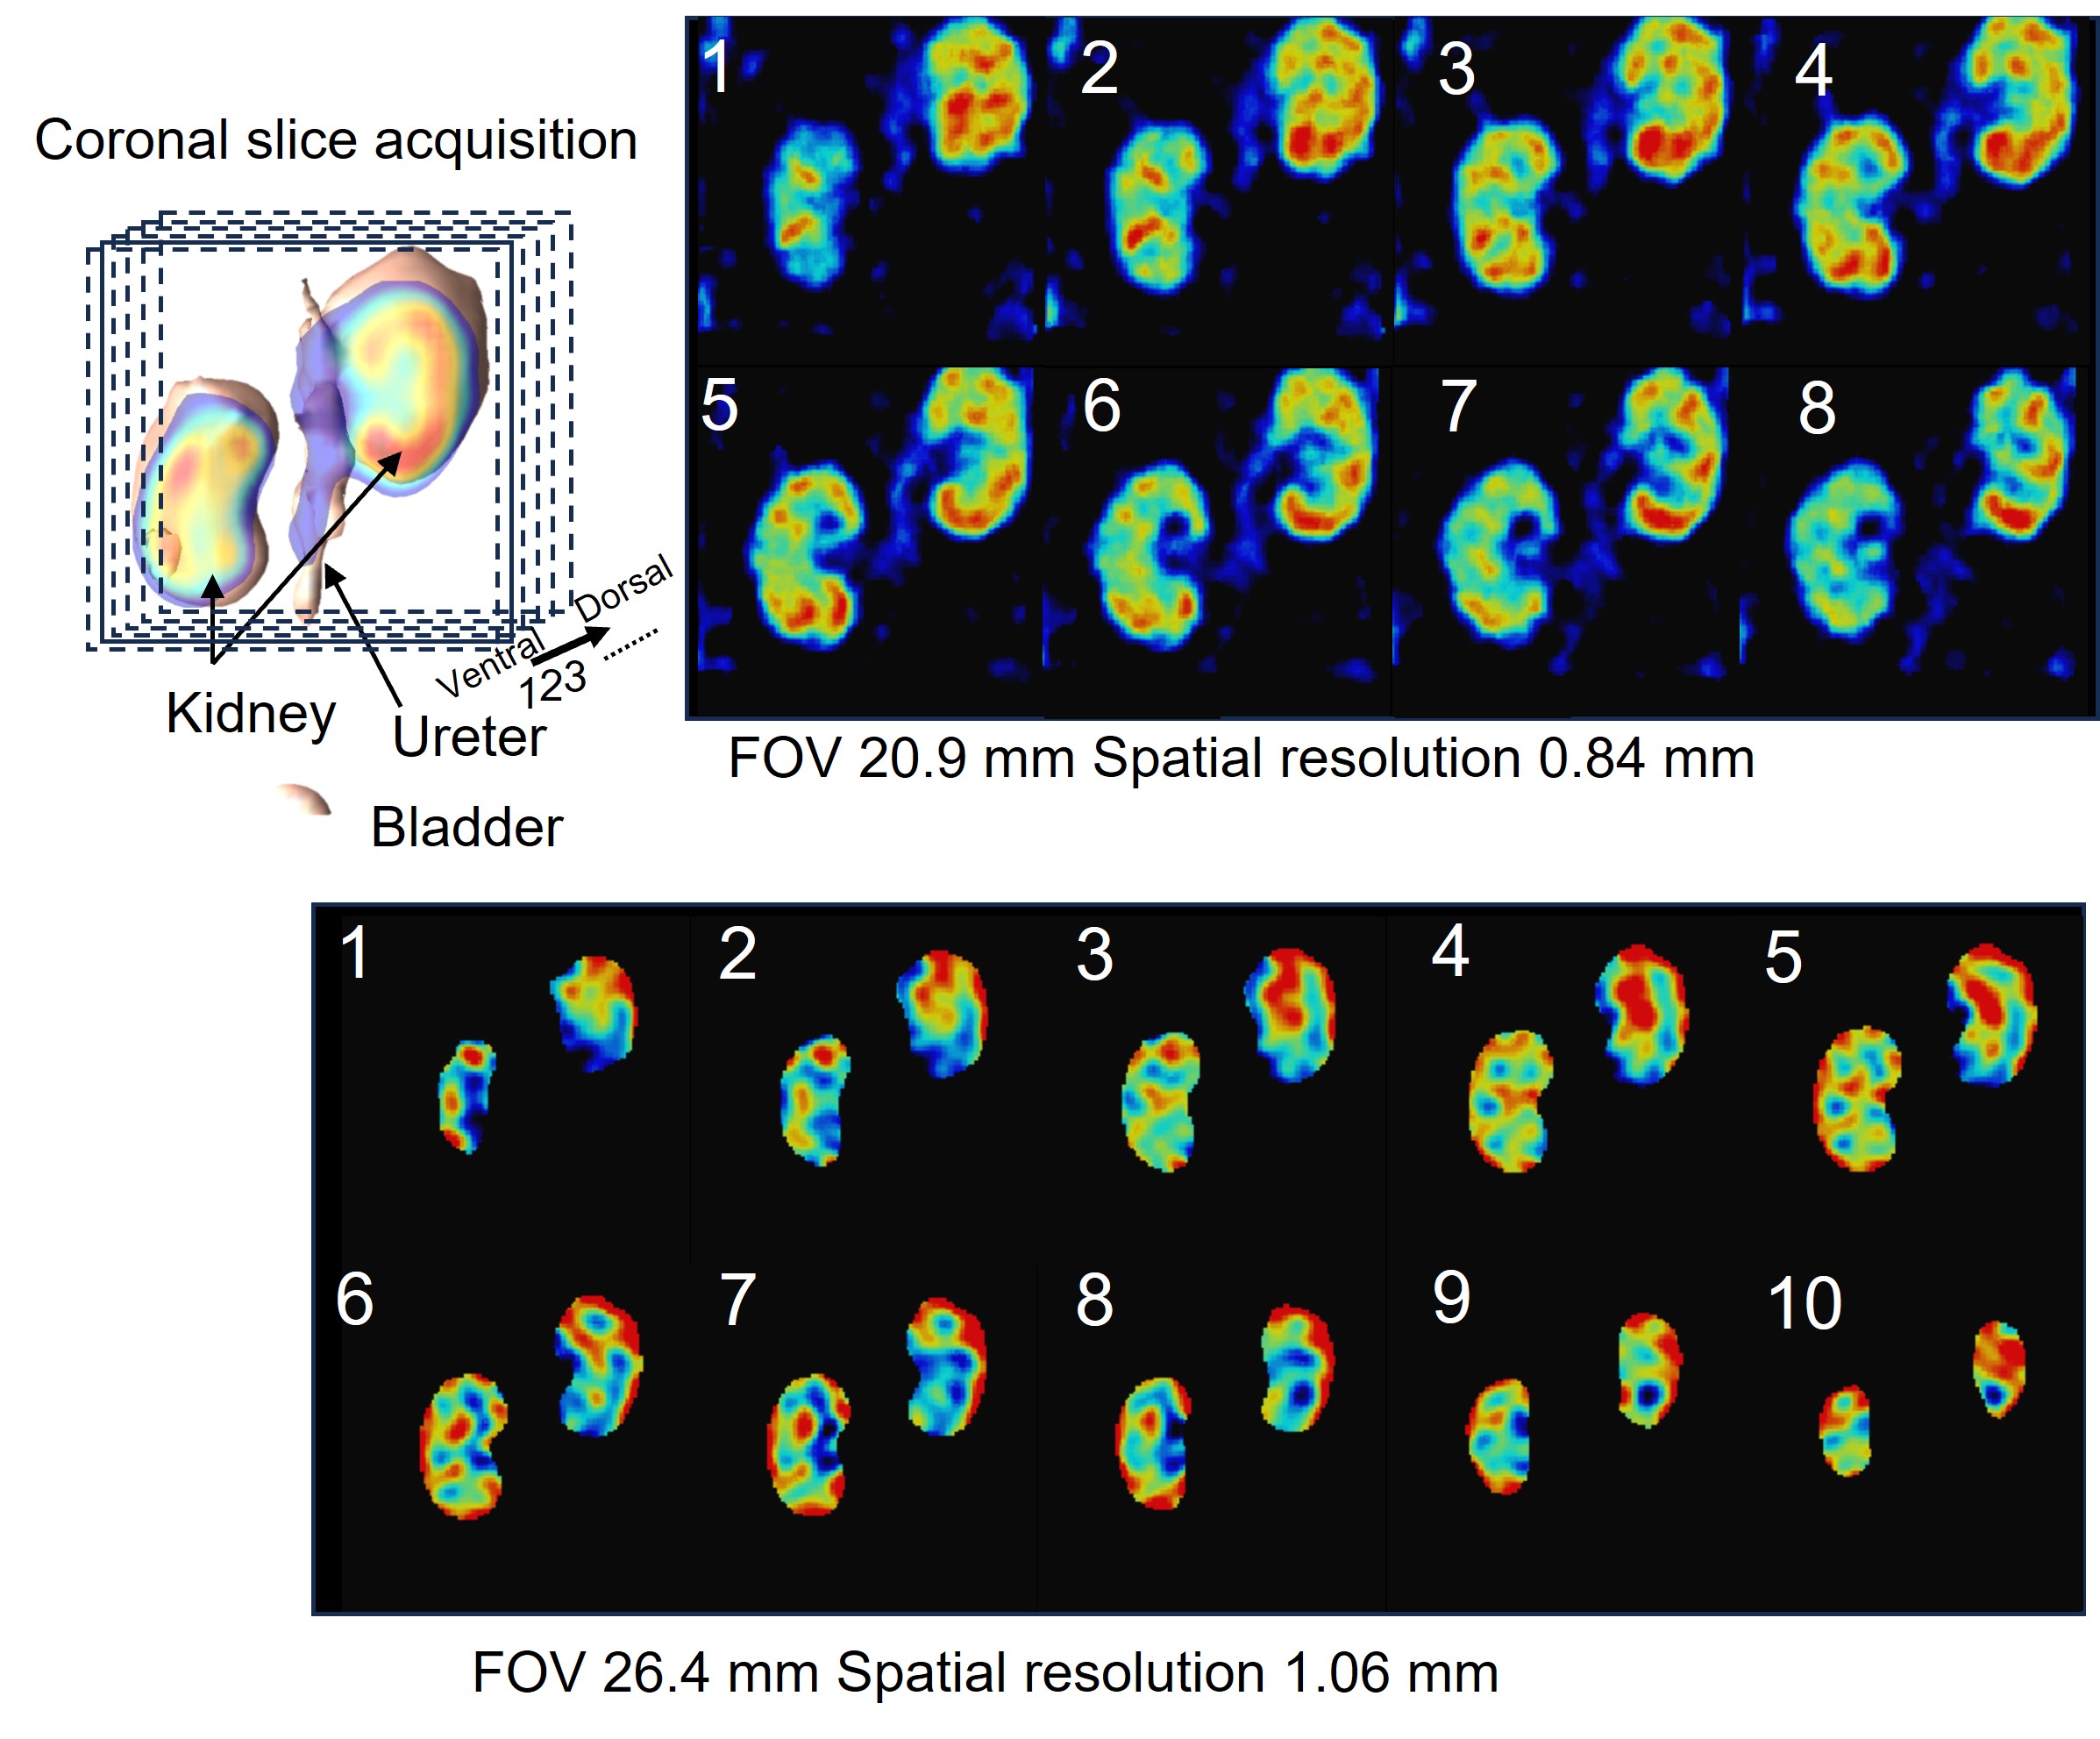
Figure 4
Top right panel: Schematic of kidney slice image acquisition. Top left panels: A series of Ox071 distribution map, Bottom panels: A series of kidney pO2 image.